For the Random Columbus Photos 9 edition, we take a not-so-distant look back for a change.
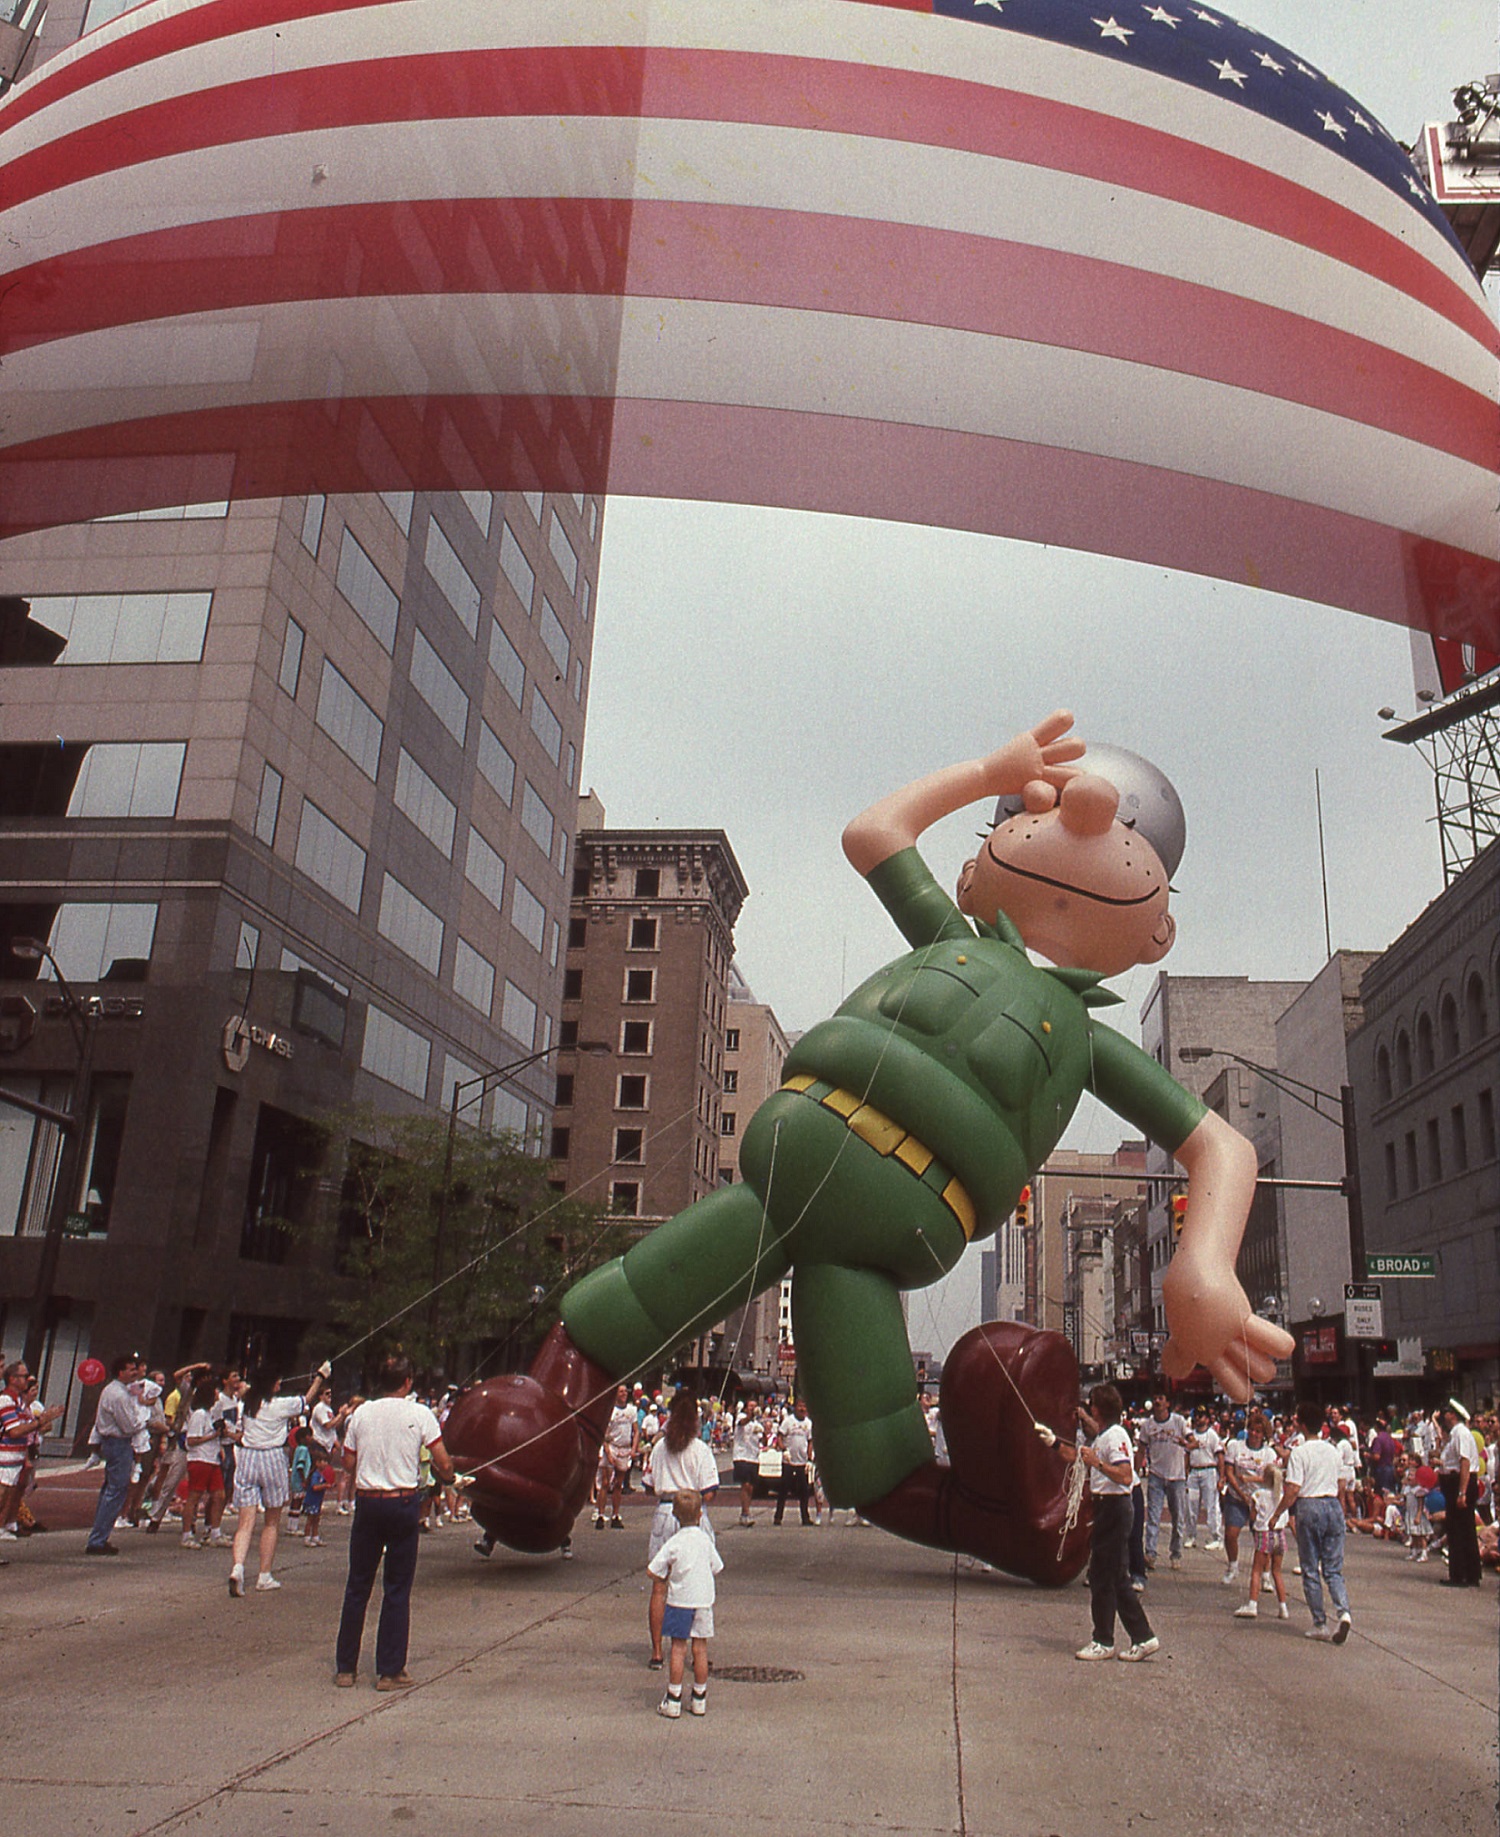
Photo Location: High and Broad intersection, looking north. Photo Date: August 31, 1991 Photo History: The Celebrate Them Home Columbus parade occurred as an event to honor returning Gulf War and Operation Desert Storm veterans, as well as veterans of previous wars. The event was held only one time. National patriotism was unusually high during this short war, and helped to revive Lee Greenwood’s 1984 song “God Bless the USA”, which often played on the radio during the conflict. Contrary to what may be popular belief, the Beetle Bailey character represented in the balloon does not date back to WWII. Instead, he first appeared in comic strips in 1950 and continues to run today.
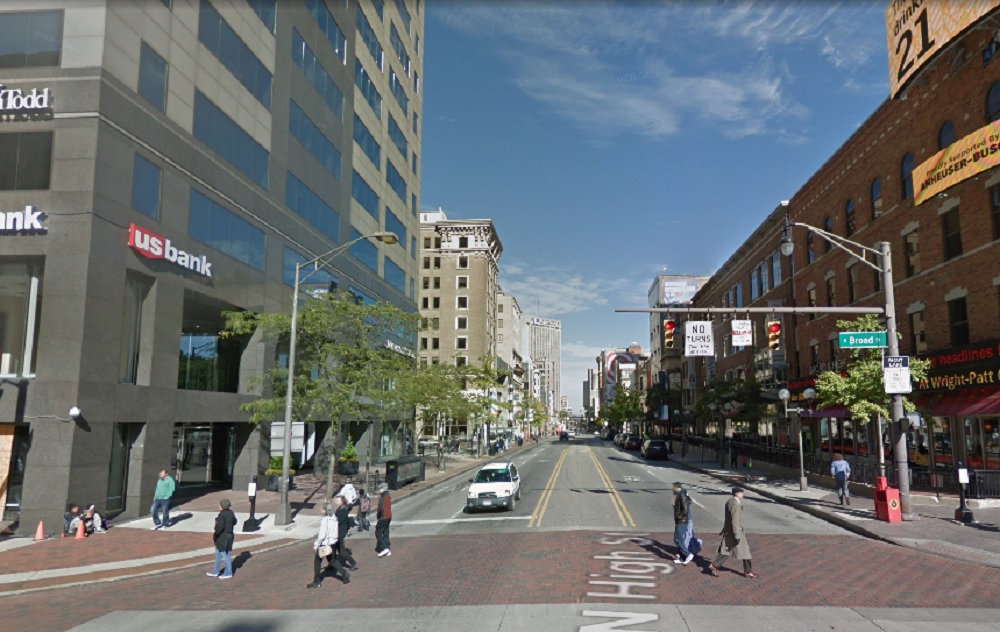
The same view today. Not much has changed since the 1991 photo. A few buildings have been renovated and the streetscape has seen improvements, but otherwise, the view is largely the same.
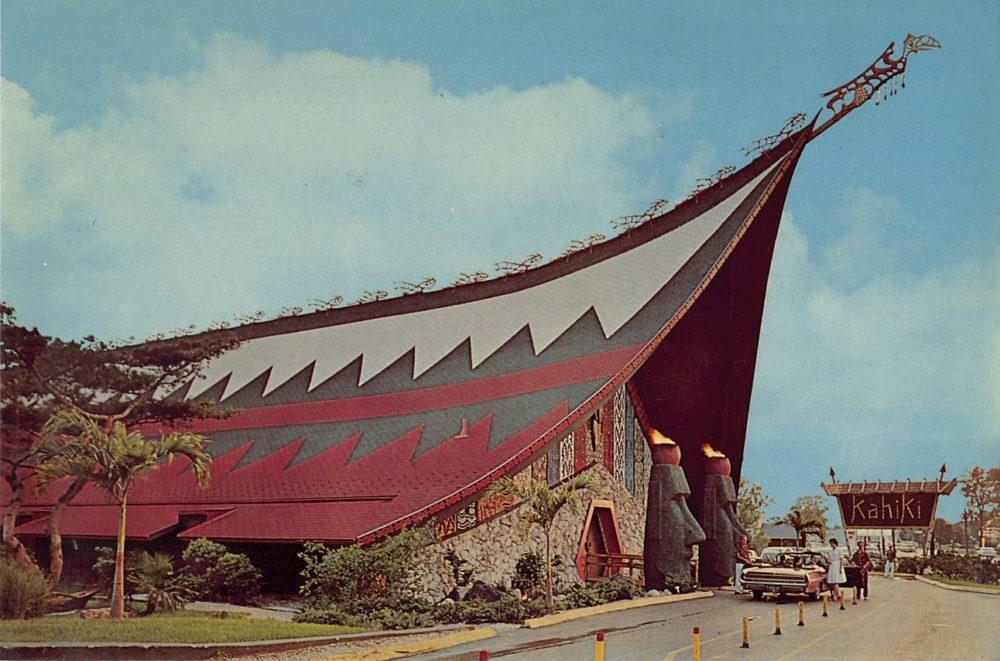
Ever looked at a building and wondered if it was ever a former Pizza Hut? Or wanted to know how long Kahiki was in business? Columbus Restaurant History is a fantastic link for all of the local area’s foodie history. Not only are there stories about individual restaurants and chains, but you can look up former restaurant locations, dates of existence, old menus and so much more! It’s just a really cool link for a niche part of Columbus’ history.
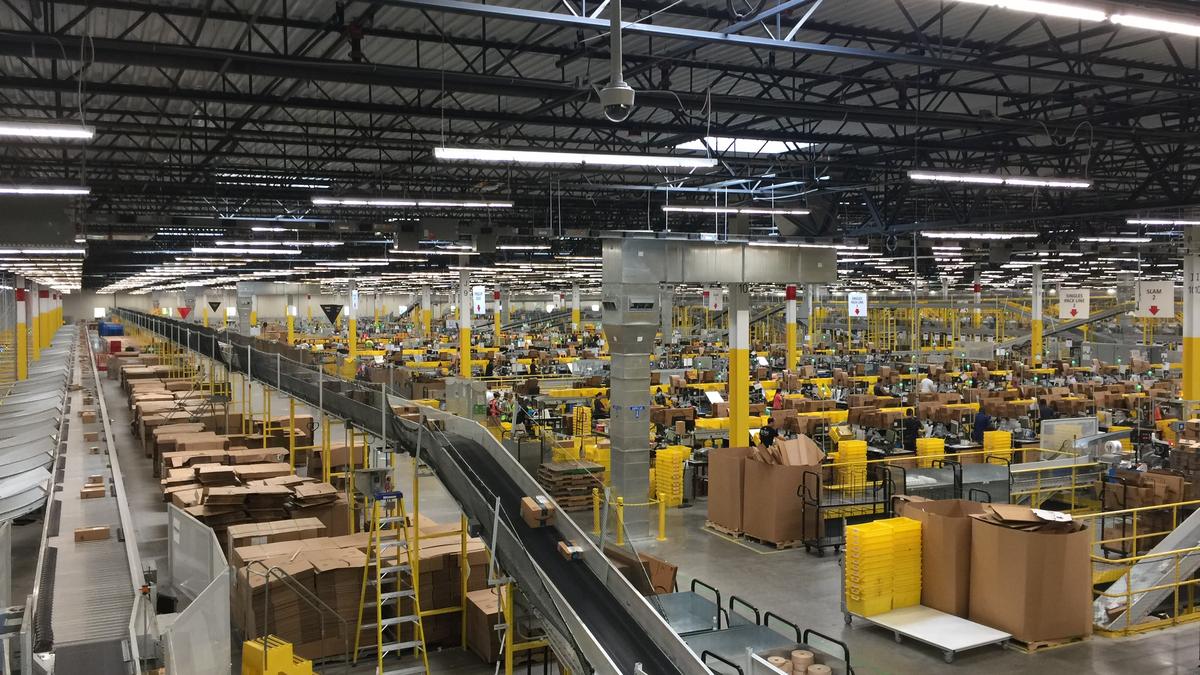
For the Columbus economy July 2022 report, we find several local industries in record high territory, but with a metro labor force that is barely growing. The data comes from the Bureau of Labor Statistics.
Overall Metro Area July 2022 and Change from July 2021 Labor Force: 1,136,345 +1,050 Employed: 1,093,966 +13,074 Unemployed: 42,379 -12,024 Unemployment Rate: 3.7% -1.1 Total Non-Farm Jobs: 1,126,200 +16,400 Numbers continued the trend of improvement year-over-year, but labor force growth remained relatively slow.
Overall Metro Area July 2022 and Change from February 2020 (Pre-Pandemic) Labor Force: 1,136,345 +15,541 Employed: 1,093,966 +17,126 Unemployed: 42,379 -1,585 Unemployment Rate: 3.7% -0.2 Total Non-Farm Jobs: 1,126,200 +14,800 The overall metro area remained better in July than the last month prior to the pandemic.
Now let’s view the results by industry.
Mining/Logging/Construction 7/2020———–7/2021———-7/2022 45,200————46,800———48,200 These industries remain near their all-time highs for total metro jobs. Mining/Logging/Construction Jobs as a % of Total Metro Jobs 7/2020————7/2021———7/2022 4.3——————4.2————–4.3
Manufacturing 7/2020———–7/2021———-7/2022 70,100———–72,700———-72,900 Manufacturing has largely recovered from pandemic losses, but remains well below historic highs achieved decades ago. Manufacturing Jobs as a % of Total Metro Jobs 7/2020————7/2021———-7/2022 6.7——————6.6—————6.5
Trade/Transportation/Utilities 7/2020———–7/2021———-7/2022 215,000———-225,400———240,200 These industries are at historic highs. Trade/Transportation/Utilities Jobs as a % of Total Metro Jobs 7/2020————7/2021———7/2022 20.4—————–20.3———–21.3
Information 7/2020———–7/2021———-7/2022 15,300———–16,000———-17,000 While nowhere near previous highs of the late 1990s-early 2000s “Dot.com” boom, this industry has been steadily growing since it hit a pandemic bottom in late 2020, and has returned to levels last seen in 2019. Information Jobs as a % of Total Metro Jobs 7/2020————7/2021———-7/2022 1.5——————1.4—————1.5
Financial Activities 7/2020———–7/2021———-7/2022 85,200———–85,900———-85,600 Financial jobs initially recovered from the pandemic recession, but then in late 2021 through part of 2022 plummeted to their lowest levels in 6 years. However, since May, they have been shooting back up and are once again close to historic highs. Financial Activities Jobs as a % of Total Metro Jobs 7/2020————7/2021———-7/2022 8.1——————7.7—————7.6
Professional and Business Services 7/2020———–7/2021———-7/2022 172,800———-183,800———181,200 These industries have been hovering around their highs since about 2015, so it seems like these jobs have not been changing much in recent years. Professional and Business Services Jobs as a % of Total Metro Jobs 7/2020———–7/2021———-7/2022 16.4—————-16.6————–16.1
Education and Health Services 7/2020———–7/2021———-7/2022 152,100———-159,800———161,800 While these industries have not fully recovered to pre-pandemic levels, they are relatively close to doing so. Education and Health Services Jobs as a % of Total Metro Jobs 7/2020———–7/2021———-7/2022 14.4—————-14.4————-14.4
Leisure and Hospitality 7/2020———–7/2021———-7/2022 90,600———–105,600————108,000 This industry should be near historic highs by the holiday season, despite being hit the hardest during the recent recession. Leisure and Hospitality Jobs as a % of Total Metro Jobs 7/2020————7/2021————7/2022 8.6——————9.5——————9.6
Other Services 7/2020———–7/2021———-7/2022 37,400———–41,100———-41,900 This industry is near historic highs. Other Services Jobs as a % of Total Metro Jobs 7/2020———–7/2021———-7/2022 3.5—————–3.7—————-3.7
Government 7/2020———–7/2021———-7/2022 170,100———-172,700———169,400 Government jobs have been in a slow decline since the pandemic recession. Government Jobs as a % of Total Metro Jobs 7/2020———–7/2021———-7/2022 16.1—————15.6————–15.0
For the Housing Market Update July 2022, it seems that whatever minor signs of a market slowdown all but disappeared in July, with strong price increases and shrinking supply almost across the board. All data comes from Columbus Realtors.
Note: LSD= Local School District, CSD= City School District. In both cases, school district boundaries differ from city boundaries.
Top 15 Most Expensive Locations By Median Sales Price in July 2022 1. New Albany: $1,001,000 2. New Albany Plain LSD: $836,500 3. German Village: $590,000 4. Powell: $582,500 5. Dublin: $557,000 6. Grandview Heights: $544,500 7. Bexley: $520,000 8. Worthington: $512,000 9. Dublin CSD: $510,000 10. Olentangy LSD: $500,000 11. Big Walnut LSD: $499,990 12. Upper Arlington CSD: $494,950 13. Granville LSD: $471,000 14. Buckeye Valley LSD: $460,000 15. Pickerington: $455,900 New Albany finally blew past the 1 million mark in July, almost 2x the next set of most expensive markets.
Top 15 Least Expensive Locations by Median Sales Price in July 2022 1. Valleyview: $163,000 2. Hamilton LSD: $184,500 3. Newark CSD: $200,000 4. Circleville CSD: $205,000 5. Lancaster CSD: $219,000 6. Miami Trace LSD: $234,900 7. Groveport Madison LSD: $240,000 8. Columbus CSD: $246,000 9. Jefferson LSD: $253,500 10. South Western CSD: $260,500 11. London CSD: $264,000 12. Columbus: $275,000 13. Grove City: $288,000 14. Reynoldsburg CSD: $297,500 15. Northridge LSD: $300,000 Only 2 metro markets remain below $200,000.
Overall Market Median Sales Price in July: $317,880 Based on the 10 Columbus Metro Area counties. This price was slightly lower than in May.
Top 15 Locations with the Highest Median Sales Price % Growth Between July 2021 and July 2022 1. Miami Trace LSD: +60.9% 2. Obetz: +36.8% 3. New Albany: +31.3% 4. Newark CSD: +31.1% 5. Pickerington: +29.0% 6. Teays Valley LSD: +26.4% 7. New Albany Plain LSD: +25.8% 8. Powell: +25.3% 9. Delaware CSD: +23.9% 10. German Village: +23.8% 11. Circleville CSD: +23.1% 12. Worthington: +22.8% 13. Westerville: +21.9% 14. Jefferson LSD: +21.9% 15. Marysville CSD: +20.2% 16. Canal Winchester CSD: +19.1%
Top 15 Locations with the Lowest Median Sales Price % Growth Between July 2021 and July 2022 1. Bexley: -15.4% 2. Short North: -13.0% 3. Northridge LSD: -9.5% 4. Hamilton LSD: -5.8% 5. Valleyview: -5.8% 6. Grove City: -2.3% 7. Sunbury: -0.6% 8. London CSD: +0.3% 9. Upper Arlington CSD: +0.5% 10. Buckeye Valley LSD: +2.2% 11. Columbus CSD: +4.75 12. Dublin: +5.1% 13. Downtown: +5.2% 14. Jonathan Alder LSD: +6.1% 15. South Western CSD: +6.3% 16. Beechwold/Clintonville: +6.5% Downtown finally broke a string of negative months.
Overall Market Median Sales Price % Change July 2022 vs. July 2021:+13.1% Based on 53 metro market locations.
Top 10 Locations with the Most New Listings in July 2022 1. Columbus: 1,278 2. Columbus CSD: 854 3. Olentangy LSD: 204 4. South Western CSD: 181 5. Dublin CSD: 159 6. Westerville CSD: 158 7. Hilliard CSD: 155 8. Pickerington LSD: 109 9. Gahanna Jefferson CSD: 100 10. Newark CSD: 79
Top 10 Locations with the Fewest New Listings in July 2022 1. Valleyview: 0 2. Jefferson LSD: 3 3. Minerva Park: 6 4. Lithopolis: 6 5. Obetz: 6 6. Grandview Heights: 7 7. Northridge LSD: 9 8. Granville LSD: 9 9. Miami Trace LSD: 10 10. New Albany: 10 11. Jonathan Alder LSD: 13 12. Sunbury: 14 13. Germany Village: 15 14. Hamilton LSD: 16 15. Whitehall: 16
Total New Listings in the Columbus Metro in July 2022:+3,239 Overall Metro New Listings % Change July 2022 vs July 2021:-20.3% New listings fell strongly in July versus a year prior as the familiar story of demand far outpacing supply continued in the metro area.
Top 10 Fastest-Selling Locations by # of Days Homes Remain on the Market Before Sale in July 2022 1. Lithopolis: 3 2. Minerva Park: 4 3. Circleville CSD: 5 4. Gahanna: 6 5. Obetz: 6 6. Sunbury: 6 7. Canal Winchester CSD: 7 8. Hilliard: 7 9. Jonathan Alder LSD: 7 10. Pickerington: 7 11. Big Walnut LSD: 8 12. Dublin: 8 13. Hamilton LSD: 8 14. Hilliard CSD: 8 15. Newark CSD: 8 16. Northridge LSD: 8 17. Reynoldsburg CSD: 8 18. Upper Arlington CSD: 8 19. Valleyview: 8 20. Whitehall: 8 21. Worthington CSD: 8 22. Granville LSD: 9 23. Jefferson LSD: 9 24. Pickerington LSD: 9 25. New Albany LSD: 9 26. Powell: 9 27. Delaware CSD: 10 28. Lancaster CSD: 10 29. South Western CSD: 10 30. Westerville CSD: 10 31. Worthington: 10 32. Blacklick: 11 33. Columbus: 11 34. Dublin CSD: 11 35. Gahanna Jefferson CSD: 11 36. London CSD: 11 37. New Albany: 11 38. Beechwold/Clintonville: 12 39. Groveport Madison LSD: 12 Most local markets continue to have very low selling spread between them.
Top 10 Slowest-Selling Locations by # of Days Homes Remain on the Market Before Sale in July 2022 1. Short North: 48 2. German Village: 39 3. Downtown: 37 4. Teays Valley LSD: 35 5. Miami Trace LSD: 30 6. Grandview Heights: 19 7. Grove City: 16 8. Johnstown Monroe LSD: 16 9. Marysville CSD: 15 10. Pataskala: 15 11. Buckeye Valley LSD: 14 12. Columbus CSD: 14 13. Olentangy LSD: 14 14. Bexley: 13 15. Westerville: 13
Top 10 Locations with the Greatest % Decline of # of Days on the Market Before Sale July 2022 vs. July 2021 1. Big Walnut LSD: -63.6% 2. New Albany LSD: -57.1% 3. Buckeye Valley LSD: -53.3% 4. Dublin: -46.7% 5. New Albany: -45.0% 6. Minerva Park: -42.9% 7. Northridge LSD: -42.9% 8. Granville LSD: -40.0% 9. Circleville CSD: -37.5% 10. Hamilton LSD: -33.3% 11. Pickerington: -30.0%
Top 10 Locations with the Lowest % Decline of # of Days on the Market Before Sale July 2022 vs. July 2021 1. Teays Valley LSD: +600.0% 2. Johnstown Monroe LSD: +433.3% 3. German Village: +387.5% 4. Short North: +269.2% 5. Obetz: +200.0% 6. Valleyview: +166.7% 7. Gahanna Jefferson CSD: +120.0% 8. Grove City: +100.0% 9. Reynoldsburg CSD: +100.0% 10. Westerville: +85.7% 11. Blacklick: +83.3%
Total # of Days Homes Remain on the Market Before Sale Across the Metro Overall: 16.2 Overall Metro Days on Market % Change July 2022 vs July 2021: +45.9% Homes spent much longer on the market across the metro than they did the year before, but the pace was still relatively fast.
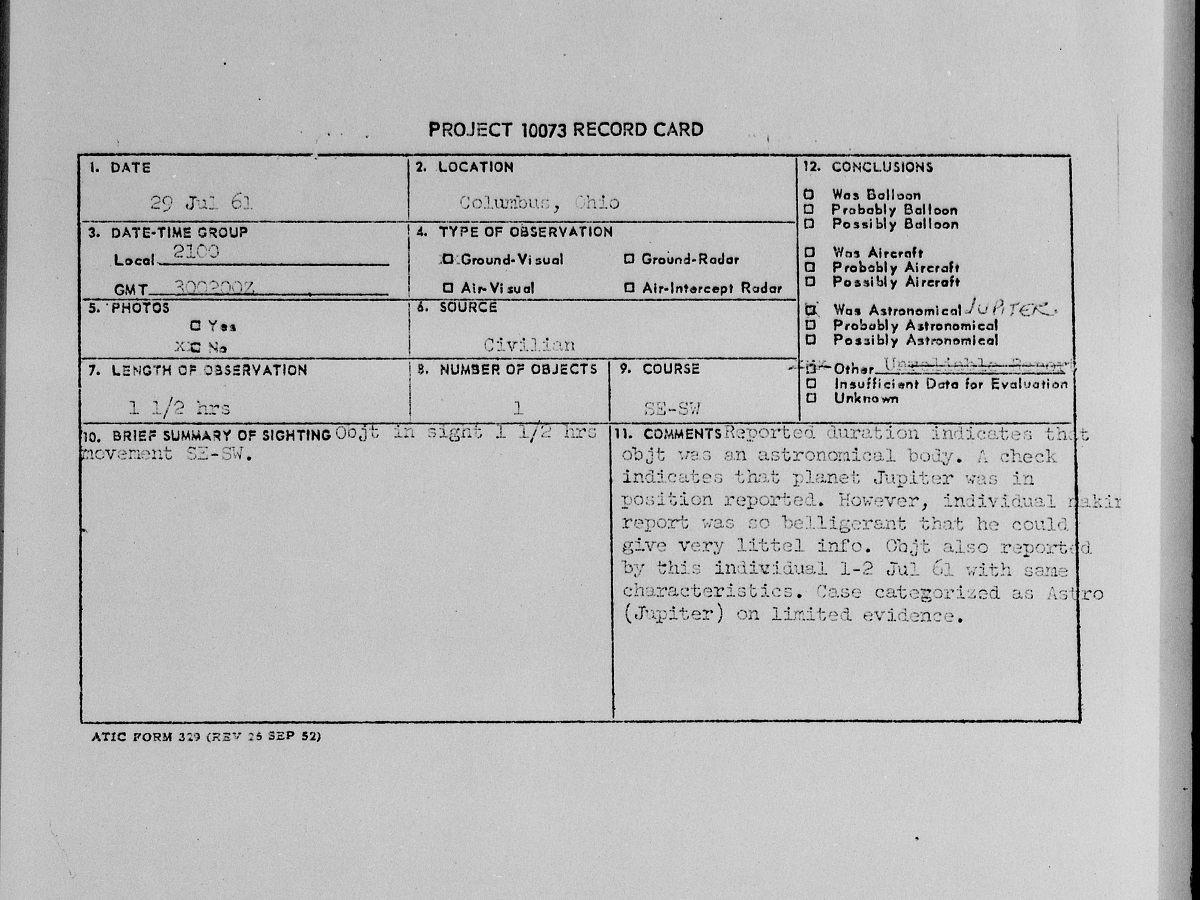
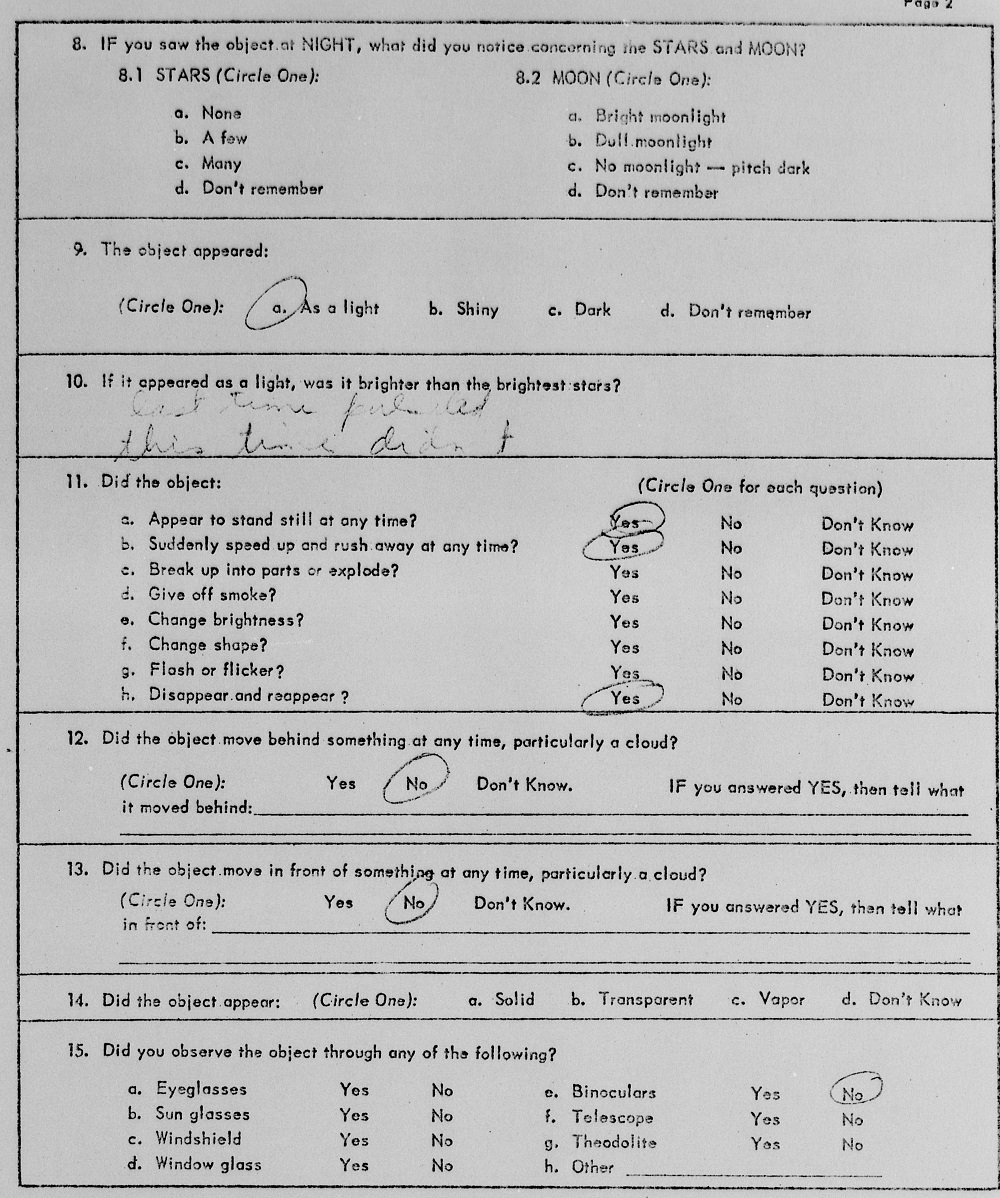
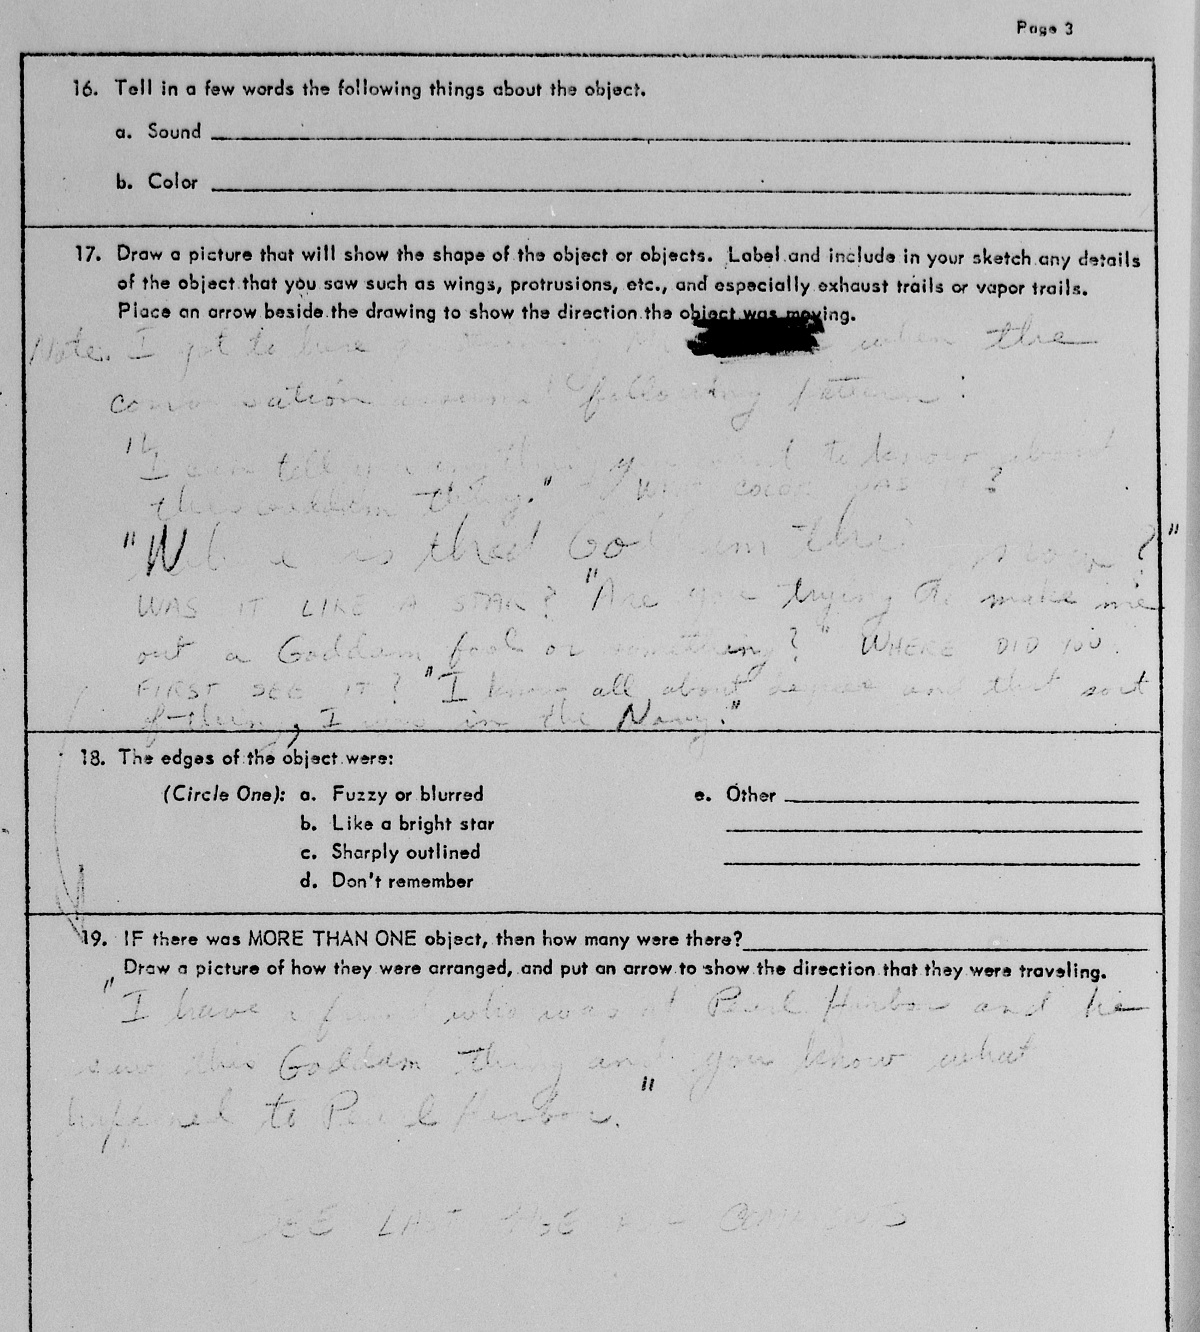
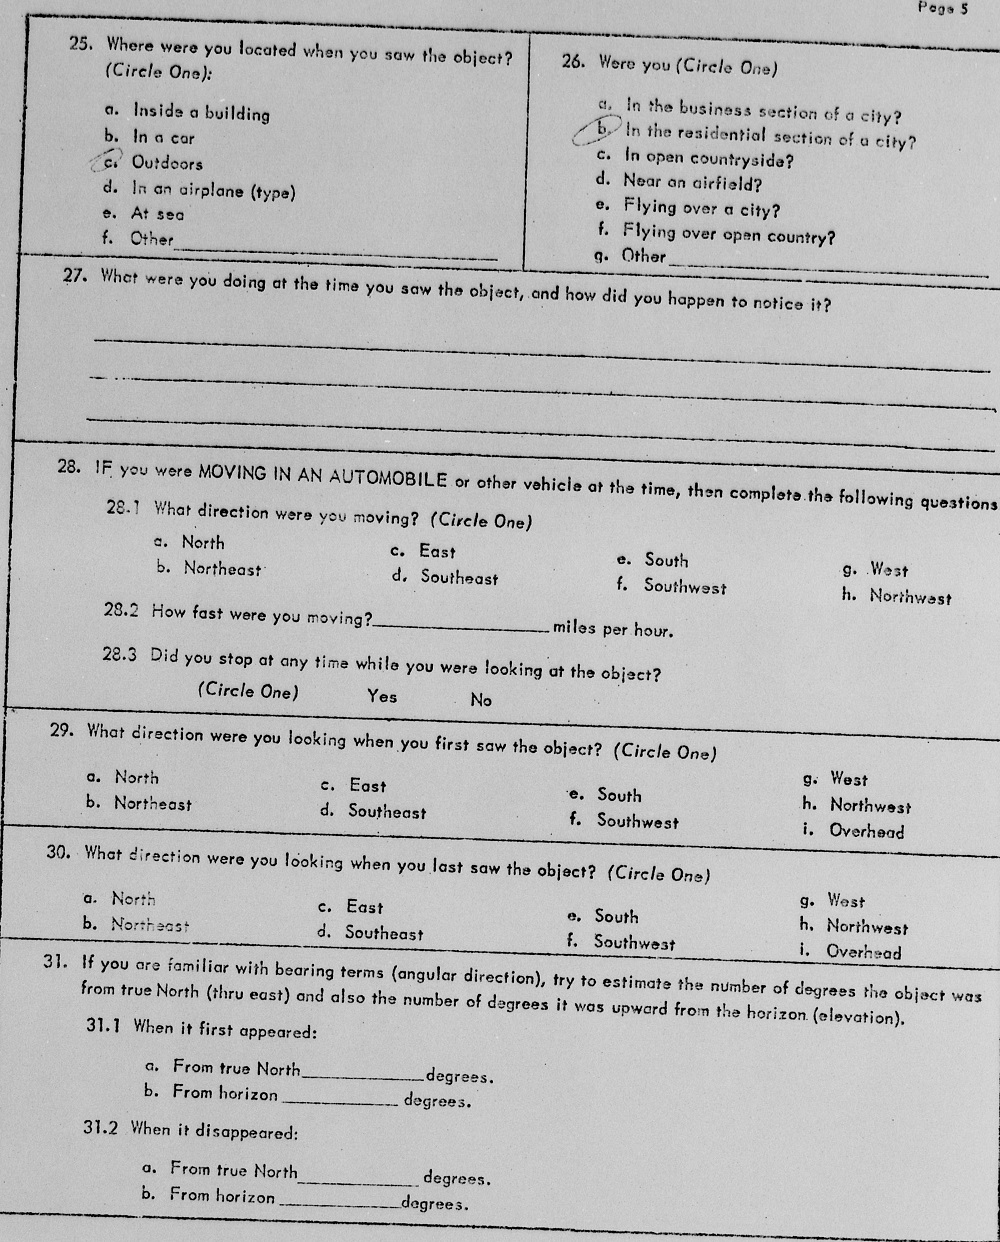
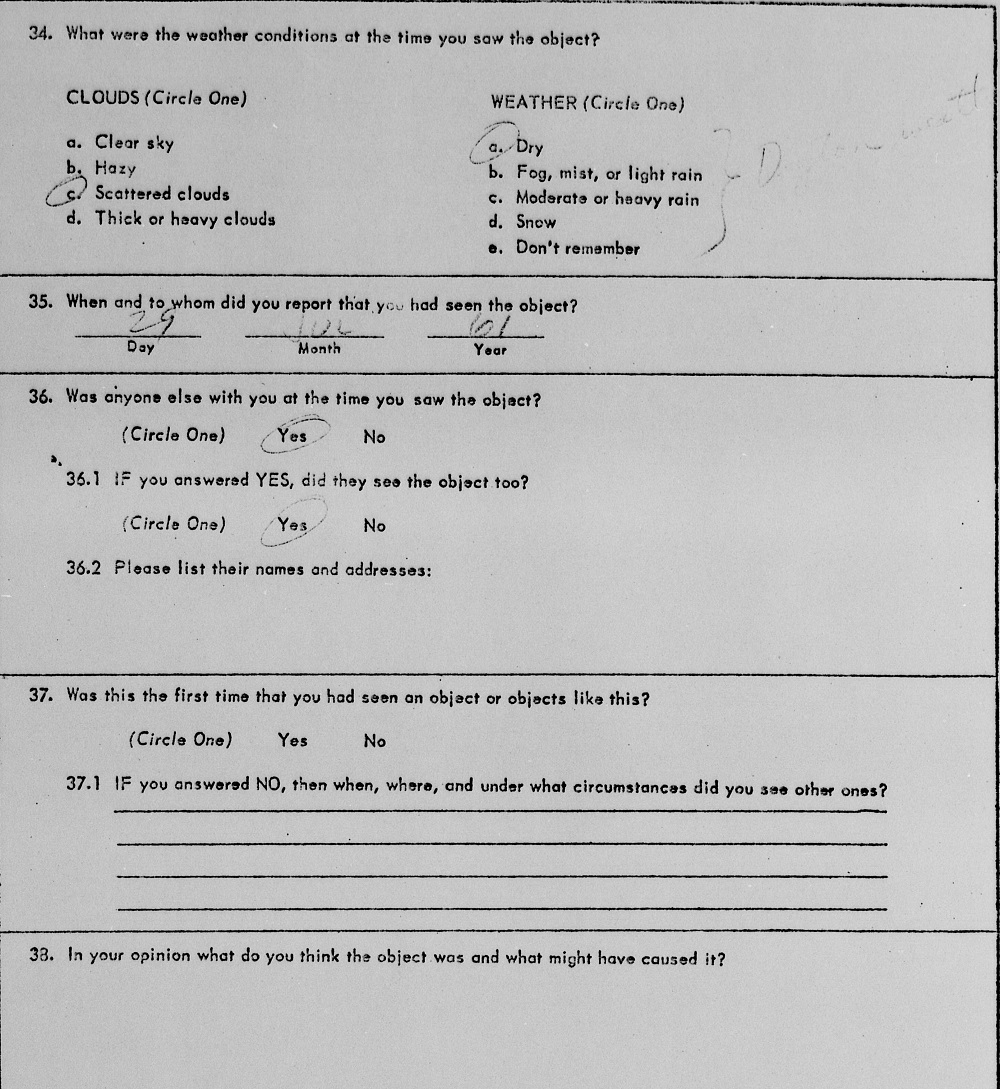
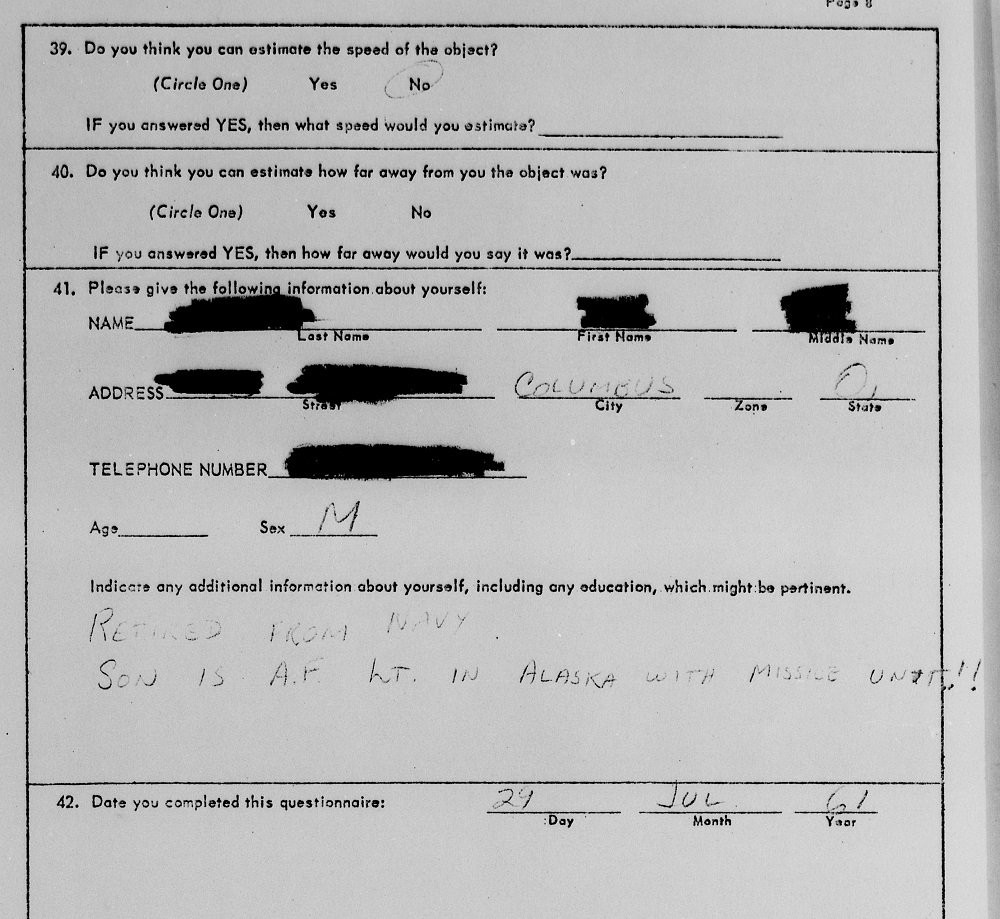
From the files of Project Blue Book, this incident is somewhat humorous as the person who reported the incident seemingly had reported objects in the past and was considered extremely “belligerent” in reporting information about what they witnessed. The witness testimony included in the report is full of colorful language. Whether the witness was simply trying to gain attention seems to have been a factor in concluding this event was Jupiter.
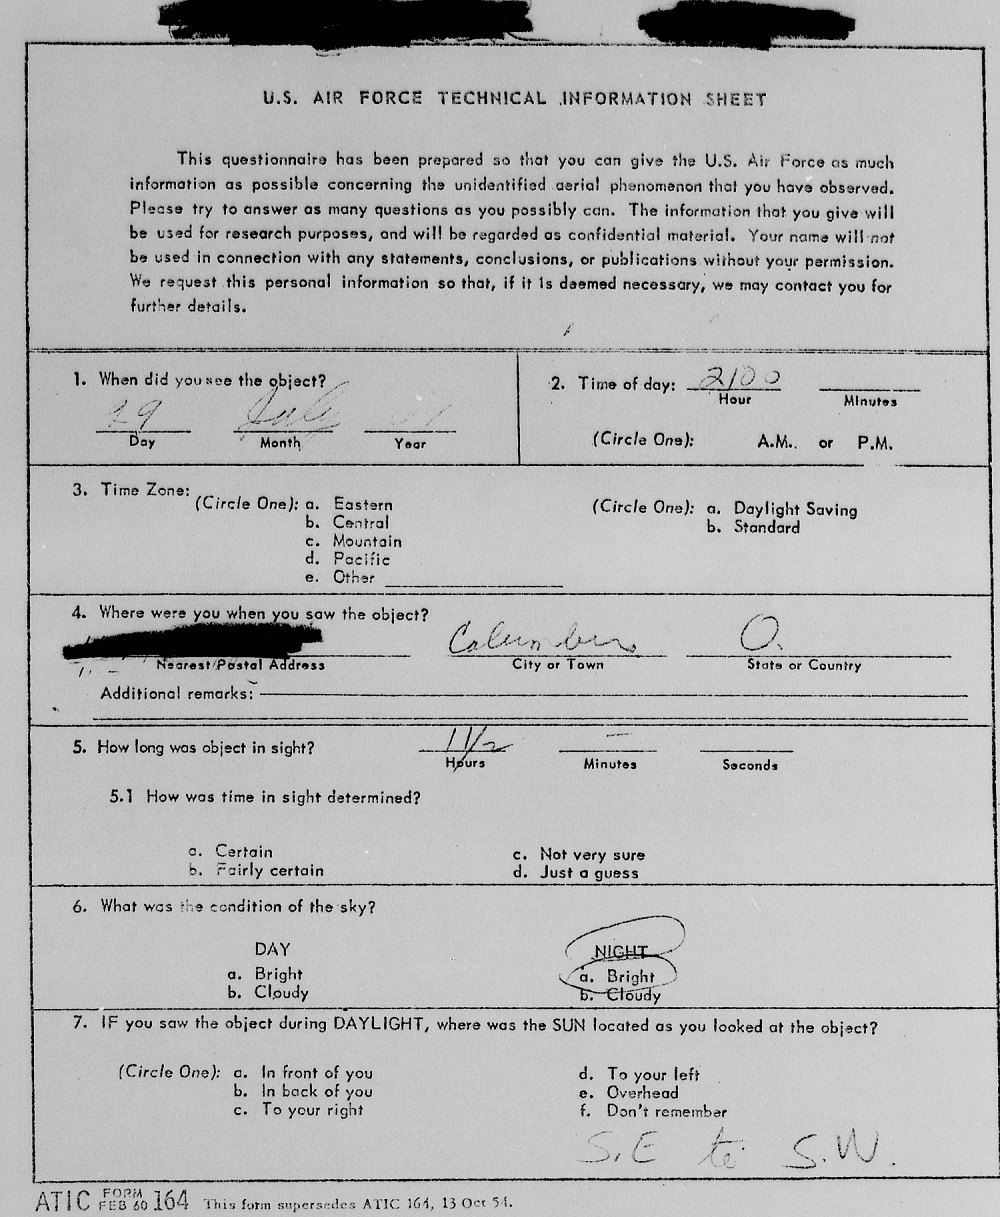
Much of the written part has faded over the last 60 years, so quite a bit is unreadable. However, it looks like it was part notes from an interviewer and part response from the interviewee/witness. It seems to be relating to how the witness was largely uncooperative in answering questions. 17. *Interviewer* Notes: I got to home of *unreadable* Mr. *Redacted*… *unreadable* conversation around following pattern. -Witness- I can tell you something you want to know about the goddamn thing. *Interviewer* What color was it? -Witness- *unreadable* is that goddamn thing *unreadable*? *Interviewer* Was it like a star? -Witness- Are you trying to make me out (to be) a goddamn fool or something? *Interviewer* Where did you first see it? -Witness- I know all about *unreadable* and that sort of thing, I was in the Navy. 19. -Witness- I have a friend who was at Pearl Harbor and he saw this goddamned thing, and you know what happened at Pearl Harbor.”
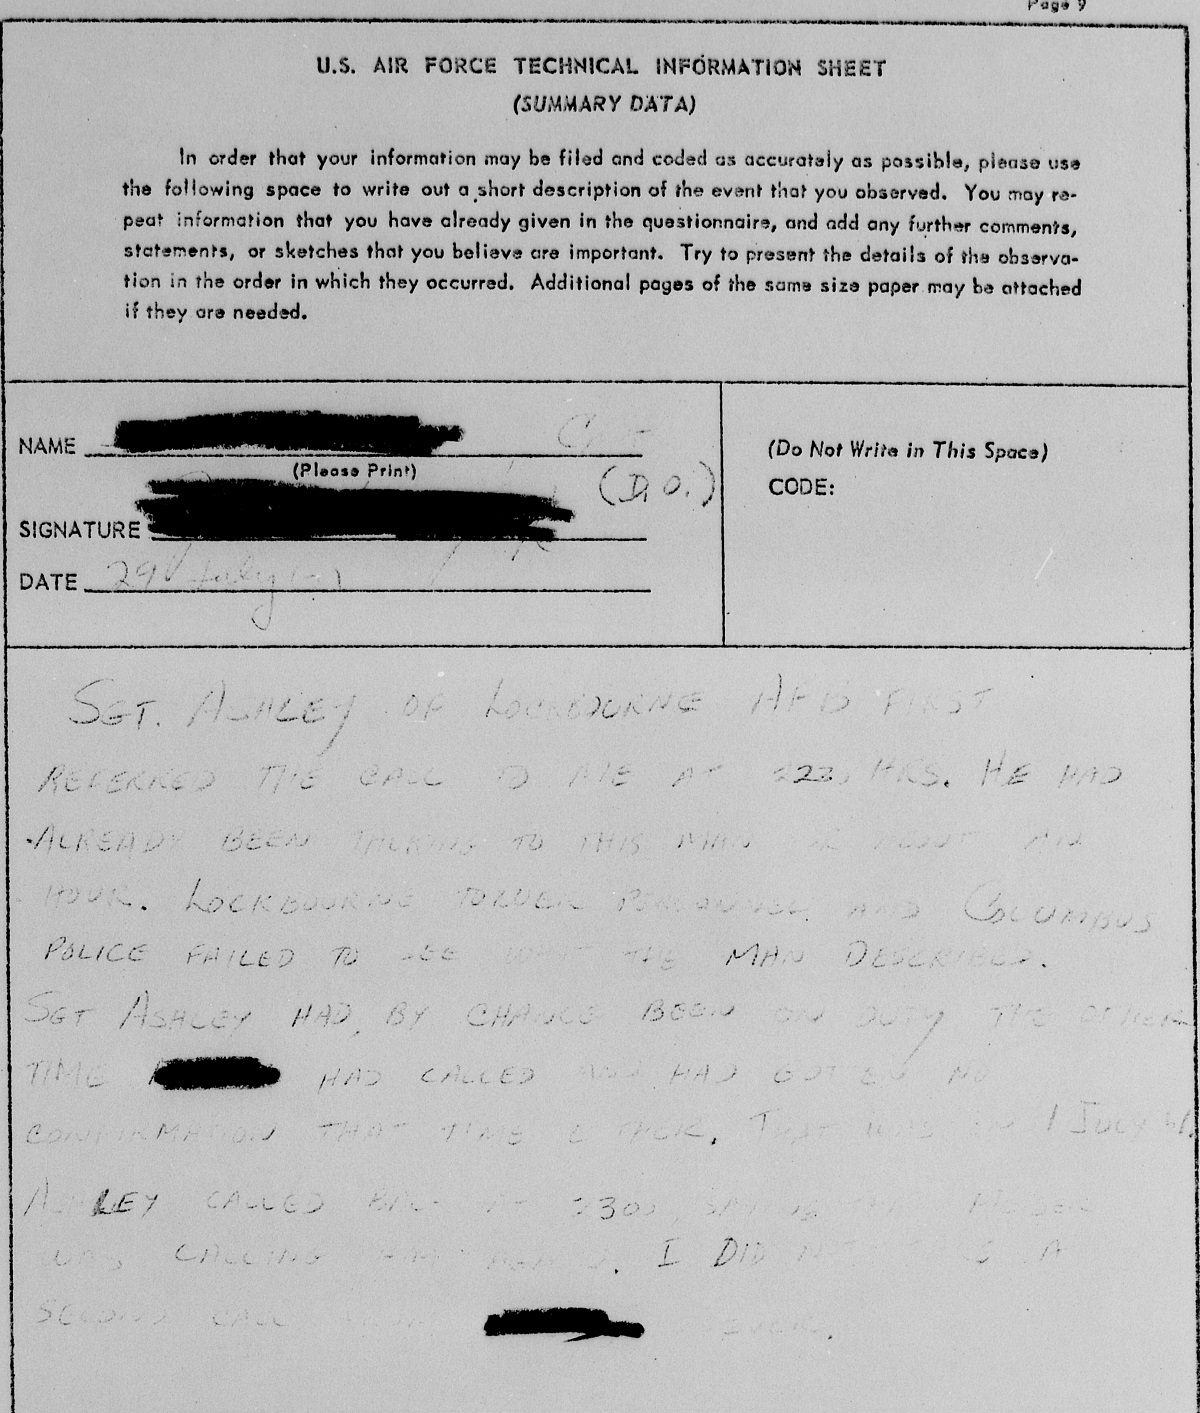
The exclamation points are a good indication the interviewer was basically mocking the witness by that point. Again, some of the writing has faded. Here is what I could decipher. Sgt. Ashley of Lockbourne AFB first referred the call to me at 2230 HRS. He had already been talking to this man for about an hour. Lockbourne Tower personnel and Columbus police failed to see what the man described. Sgt. Ashley had by chance been on duty the other time *redacted* had called and had gotten no confirmation that time either. That was *unreadable* July *unreadable*. Ashley called back at 2300 saying that *unreadable* was calling *unreadable* again. I did not take a second call from *redacted*.
To view more incidents around the world, visit this link. UFO Database