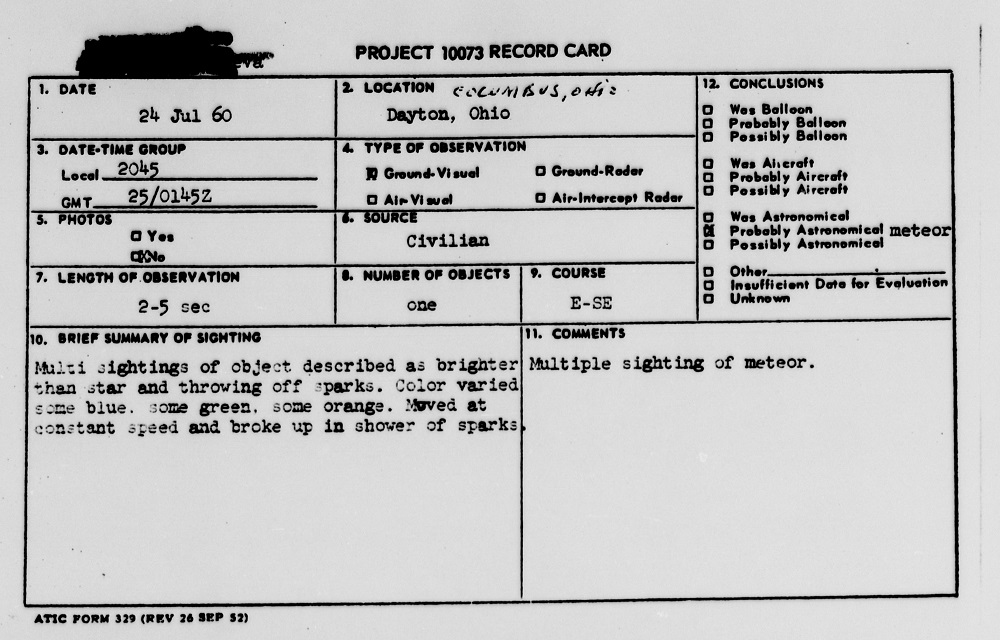
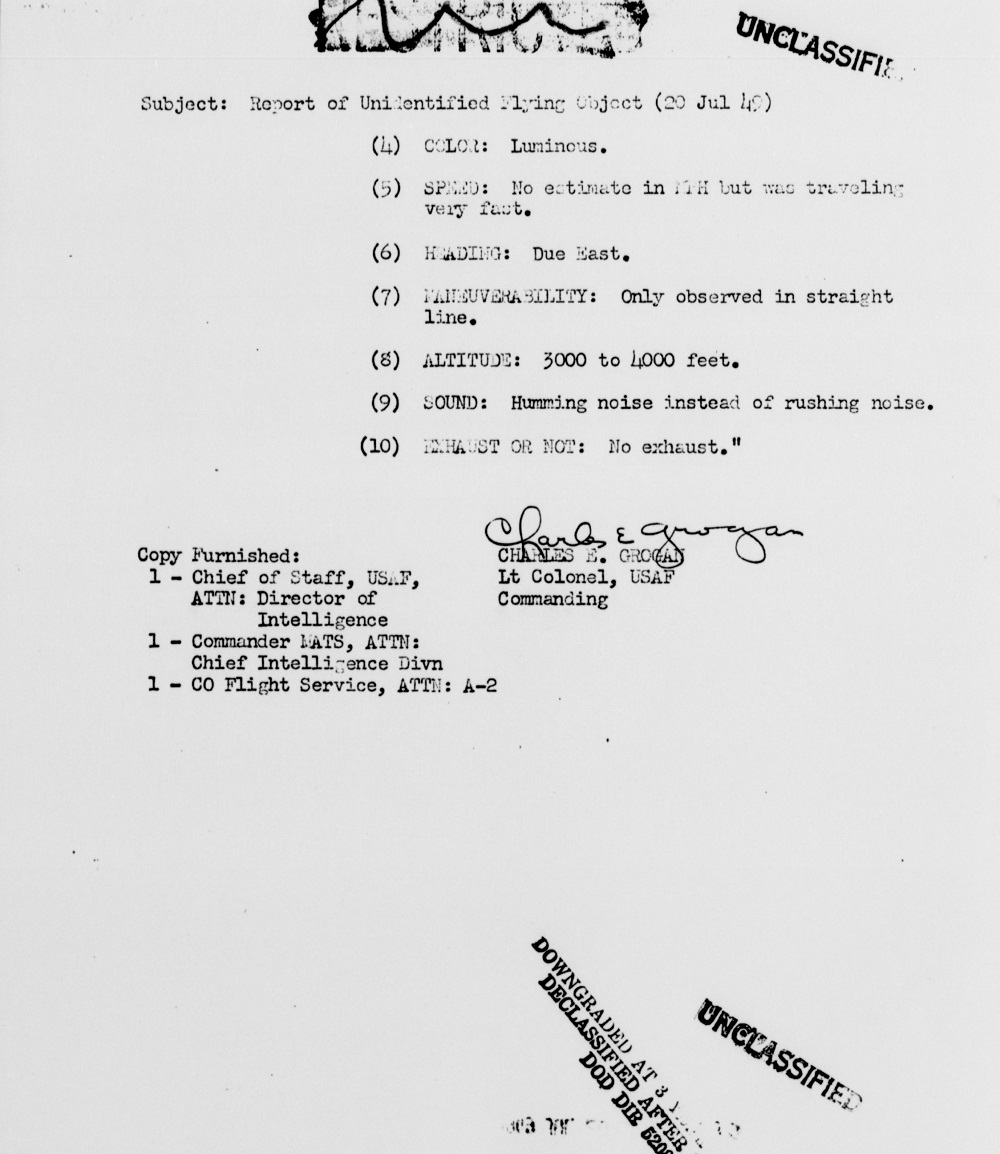
The July 24, 1960 meteor occurred during the early morning hours, and at first was reported to Lockbourne AFB as a possible UFO. The case was actually investigated as a Project Blue Book case, but the description and multiple eyewitness reports across the region supported that this was a meteor.
Unfortunately, much of the original report notes beyond the introductory page have faded to the point where it is difficult or impossible to read them. Still, the forms are provided below in a PDF. Perhaps someone is able to make out more than I could. Full Report
The Winter 2022-2023 Review shows that the season was one of the warmest ever recorded for Columbus, with near consistent above average- and sometimes record-breaking temperatures. Snow, as a consequence, was well below average.
The rankings below are good through the 2022-2023 season.
December-February Only Average High: 45.8 4th Warmest Average Low: 29.4 7th Warmest Mean: 37.6 5th Warmest Precipitation: 7.80″ 62nd Wettest Snowfall: 11.2″ 30th Least Snowy Average Daily Snow Depth: 0.3″ Tied for 4th Lowest Largest Snowstorm: 4.9″ on 12/23/2022 # of 32 or Below Highs: 10 5th Fewest # of 32 or Below Lows: 51 Tied for 4th Fewest # of Measurable Precipitation Days: 40 Tied for 13th Most # of Measurable Snowfall Days: 10 Tied for 6th Fewest Highest Average Daily Wind Speed in MPH: 23.3 on 12/23/2022 Highest Wind Gust in MPH: 54 on 1/19/2023 # of Clear Days: 6 6.67% # of Partly Cloudy Days: 38 42.22% # of Cloudy Days: 46 51.11%
Early winter ended up being the coldest and snowiest part of the season, with every subsequent month getting warmer. There were very few freezing days during the heart of the winter, and despite a somewhat stormy pattern with seemingly endless windy days, there was relatively little precipitation.
The biggest snowstorm was on December 23rd, when a very strong low pressure system and cold front brought heavy snow and very cold temperatures, making for one of the coldest Christmas Eves and Days in many years.
Entire Cold Season: October-April Average High: 53.8 3rd Warmest Average Low: 34.5 Tied for 14th Warmest Mean: 44.1 Tied for 6th Warmest Precipitation: 19.13″ 63rd Driest Snowfall: 14.5″ Tied for 21st Least Snowy Average Snow Depth: 0.1″ Tied for 2nd Lowest Largest Snowstorm: 4.9″ on 12/23/2022 # of 32 or Below Highs: 11 Tied for 2nd Fewest # of 32 or Below Lows: 83 6th Fewest # of Measurable Precipitation Days: 79 Tied for 14th Fewest # of Measurable Snowfall Days: 15 Tied for 6th Fewest Highest Average Daily Wind Speed in MPH: 23.3 on 12/23/2022 Highest Wind Gust in MPH: 59 on 3/3/2023 # of Clear Days: 30 14.15% # of Partly Cloudy Days: 95 44.81% # of Cloudy Days: 87 41.04%
The entire cold season didn’t really live up to its name. All months except October ended up above normal. Now let’s break down those months individually.
Average High By Month October 2022: 65.6 44th Warmest November 2022: 54.6 Tied for 19th Warmest December 2022: 41.8 Tied for 36th Warmest January 2023: 43.8 13th Warmest February 2023: 52.3 1st Warmest March 2023: 52.6 33rd Warmest April 2023: 65.7 20th Warmest
February, 2023 had the warmest average high mean on record, beating the next closest year- 2017- by 0.5 degrees.
Average Low By Month October 2022: 42.7 Tied for 28th Coldest November 2022: 36.0 29th Warmest December 2022: 27.4 Tied for 40th Warmest January 2023: 31.0 6th Warmest February 2023: 30.0 10th Warmest March 2023: 32.1 Tied for 45th Warmest April 2023: 42.0 Tied for 35th Warmest
Mean By Month October 2022: 54.1 Tied for 33rd Coldest November 2022: 45.3 Tied for 18th Warmest December 2022: 34.6 Tied for 37th Warmest January 2023: 37.4 10th Warmest February 2023: 41.1 3rd Warmest March 2023: 42.4 Tied for 40th Warmest April 2023: 53.9 Tied for 23rd Warmest
Precipitation By Month October 2022: 0.60″ 11th Driest November 2022: 2.34″ 58th Driest December 2022: 2.02″ 39th Driest January 2023: 4.16″ 28th Wettest February 2023: 1.62″ Tied for 41st Driest March 2023: 5.22″ 17th Wettest April 2023: 3.17″ Tied for 64th Wettest
Snowfall By Month October 2022: Trace Tied for 2nd Least Snowy November 2022: 0.3″ Tied for 5th Least Snowy December 2022: 5.8″ 38th Snowiest January 2023: 5.4″ Tied for 39th Least Snowy February 2023: Trace 1st Least Snowy March 2023: 1.0″ Tied for 10th Least Snowy April 2023: Trace Tied for 2nd Least Snowy
February’s Trace was the lowest ever recorded for the month.
Average Snow Depth By Month October 2022: 0.0″ November 2022: 0.0″ December 2022: 0.7″ January 2023: 0.1″ February 2023: 0.0″ March 2023: 0.0″ April 2023: 0.0″
Maximum High By Month October 2022: 77 on the 6th, 23rd and 24th November 2022: 77 on the 5th December 2022: 65 on the 30th January 2023: 62 on the 3rd February 2023: 73 on the 23rd March 2023: 75 on the 1st April 2023: 84 on the 20th
Maximum High Records -The 77 on November 5th was a record for the date, beating the old record of 76 set in 1977. – The 65 on December 30th was a record for the date, beating the old record of 63 set in 1964. -The 72 on February 9th was a record for the date, beating the old record of 66 set in 2001. -The 72 on February 15th was a record for the date, beating the old record of 70 set in 1954. -The 73 on February 23rd was a record for the date, beating the old record of 72 set in 2017. -The 75 on March 1st was a record for the date, beating the old record of 65 set in 1972 and 1997.
Minimum High By Month October 2022: 45 on the 18th November 2022: 30 on the 20th December 2022: 14 on the 24th January 2023: 26 on the 31st February 2023: 30 on the 1st March 2023: 33 on the 14th April 2023: 46 on the 2nd and 17th
Maximum Low By Month October 2022: 57 on the 31st November 2022: 62 on the 5th December 2022: 54 on the 30th January 2023: 56 on the 3rd February 2023: 47 on the 15th March 2023: 47 on the 23rd April 2023: 60 on the 5th
Maximum Low Records -The 62 on November 6th was a record for the date, beating the old record of 61 set in 1977. -The 49 on January 2nd tied the record for the date, matching 1997, 2000 and 2005. -The 56 on January 3rd was a record for the date, beating the old record of 55 set in 1997.
Minimum Low By Month October 2022: 32 on the 20th November 2022: 17 on the 20th December 2022: -7 on the 23rd January 2023: 16 on the 15th February 2023: 12 on the 4th March 2023: 18 on the 19th April 2023: 29 on the 25th
Highest Daily Precipitation by Month October 2022: 0.15″ on the 12th and 30th November 2022: 1.14″ on the 11th December 2022: 0.44″ on the 15th January 2023: 0.73″ on the 12th February 2023: 0.73″ on the 27th March 2023: 1.6″ on the 3rd April 2023: 0.91″ on the 5th
Precipitation Records -The 1.14″ on November 11th set a record for the date, beating the old record of 1.03″ set in 1995. -The 1.60″ on March 3rd set a record for the date, beating the old record of 1.31″ set in 2020.
Highest Daily Snowfall By Month October 2022: Trace on the 18th November 2022: 0.2″ on the 12th December 2022: 4.9″ on the 23rd January 2023: 3.0″ on the 22nd February 2023: Trace on the 3rd and 17th March 2023: 0.4″ on the 12th and 13th April 2023: Trace on the 17th
Deepest Snow Depth By Month October 2022: 0.0″ November 2022: Trace on the 13th December 2022: 4″ on the 23rd, 24th, 25th and 27th January 2023: 2″ on the 23rd February 2023: Trace on the 1st March 2023: 1″ on the 14th April 2023: 0.0″
Average Daily Wind Speed by Month in MPH October 2022: 7.9 November 2022: 8.2 December 2022: 8.0 January 2023: 8.4 February 2023: 9.7 March 2023: 10.0 April 2023: 8.1
Highest Wind Gust by Month in MPH October 2022: 38 on the 26th November 2022: 44 on the 27th and 30th December 2022: 46 on the 23rd January 2023: 54 on the 19th February 2023: 49 on the 9th March 2023: 59 on the 3rd April 2023: 50 on the 1st
Clear Days by Month October 2022: 8 25.81% November 2022: 6 20.0% December 2022: 2 6.45% January 2023: 0 0.0% February 2023: 4 14.29% March 2023: 5 16.13% April 2023: 5 16.67%
Partly Cloudy Days by Month October 2022: 17 54.84% November 2022: 13 43.33% December 2022: 10 32.26% January 2023: 13 41.94% February 2023: 15 53.57% March 2023: 15 48.39% April 2023: 12 40.0%
Cloudy Days by Month October 2022: 6 19.35% November 2022: 11 36.67% December 2022: 19 61.29% January 2023: 18 58.06% February 2023: 9 32.14% March 2023: 11 35.48% April 2023: 13 43.33%
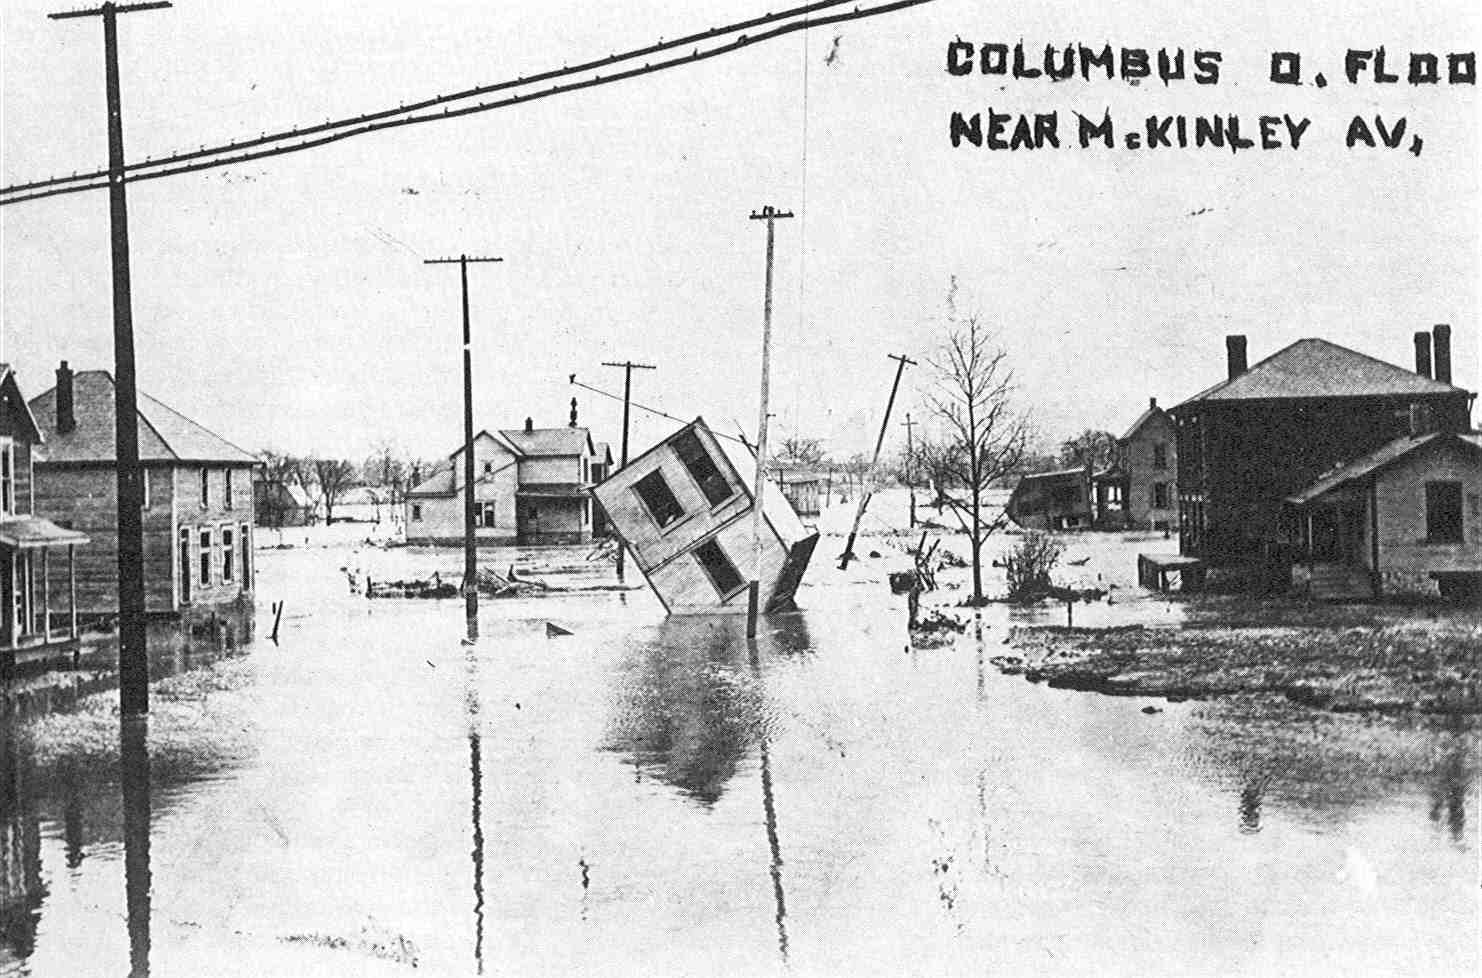
Photo Location: Intersection of McKinley Avenue and North Souder Avenue, looking west. Photo Date: March, 1913 Photo History: The Great Flood of 1913 was the most devastating and deadly flood in Ohio history. 6″-12″ of rain fell between March 23-27, 1913 as two weather systems followed one after the other. Most of the rain fell across the headwaters of major rivers, including the Scioto. The subsequent flood destroyed levees in Columbus and flooded parts of Franklinton- among other areas- with up to 17′ of water with a record crest. The entire riverfront suffered heavy damage with hundreds of buildings damaged or destroyed. 100 people were reportedly killed around the city. Floods like 1913- and later in 1959- eventually led to the federal government limiting new development and investment in Franklinton, which caused it to decline for decades. It wasn’t until 2004 with the completion of the Franklinton floodwall that those limitations were lifted.
The same view today.
Columbus wasn’t the only victim of this great flood. Virtually every major city saw some significant impact, but Dayton arguably got it much worse than any other.
The 2010 President’s Day Snowstorm was the third and largest snowstorm to strike Columbus and Ohio during February, 2010. Models began showing the potential for another snow event in the Ohio Valley several days before. Initially, the track was well south, with only counties along the Ohio River being impacted, as this excerpt from the February 12, 2010 Area Forecast Discussion from Wilmington National Weather Service mentions: MODEL SOLUTIONS CONTINUE TO DIFFER ON SYSTEM COMING IN SUNDAY NIGHT INTO THE BEGINNING OF THE WORK WEEK. THE GEM IS STILL THE FURTHEST SOUTH WITH THE UPCOMING SYSTEM. THE ECMWF HAS TRENDED NORTH WITH THE LATEST RUN AND IS NOW MORE IN LINE WITH THE GFS. THE ECMWF NOW ACTUALLY HAS THE SURFACE LOW SLIGHTLY FURTHER NORTH THAN THE GFS. WENT WITH A GFS AND ECMWF BLEND. IT WILL BE COLD ENOUGH THAT PRECIPITATION WILL ALL BE IN THE FORM OF SNOW. MONDAY WILL SEE THE GREATEST CHANCE FOR SNOW WITH LOW TRACKING ACROSS KENTUCKY. ACCUMULATING SNOWFALL WILL BE POSSIBLE…ESPECIALLY ALONG AND SOUTH OF THE OHIO RIVER.
As the event grew closer, however, model solutions inched northward. On the afternoon of Saturday, February 13th, Wilmington issued the first Winter Storm Watch for parts of Ohio, but the focus continued to be south of Columbus. URGENT – WINTER WEATHER MESSAGE NATIONAL WEATHER SERVICE WILMINGTON OH 222 PM EST SAT FEB 13 2010 …ANOTHER WINTER STORM TO AFFECT THE OHIO VALLEY… .LOW PRESSURE WILL DEVELOP OVER THE LOWER OHIO VALLEY ON SUNDAY…AND WILL TRACK INTO THE CENTRAL APPALACHIANS BY MONDAY EVENING. AS THE LOW MOVES SOUTH OF THE OHIO RIVER SUNDAY NIGHT AND MONDAY…SNOW WILL OVERSPREAD PARTS OF INDIANA…KENTUCKY AND OHIO. THIS SYSTEM HAS THE POTENTIAL TO PRODUCE SEVERAL INCHES OF SNOW ACROSS PARTS OF THE OHIO VALLEY…ESPECIALLY ACROSS AREAS SOUTH OF THE I-70 CORRIDOR. FRANKLIN IN-RIPLEY-DEARBORN-OHIO-SWITZERLAND-CARROLL-GALLATIN-BOONE-KENTON-CAMPBELL-OWEN-GRANT-PENDLETON-BRACKEN-ROBERTSON-MASON-LEWIS-FAYETTE OH-PICKAWAY-FAIRFIELD-BUTLER-WARREN-CLINTON-ROSS-HOCKING-HAMILTON-CLERMONT-BROWN-HIGHLAND-ADAMS-PIKE-SCIOTO- INCLUDING THE CITIES OF…BROOKVILLE…VERSAILLES…LAWRENCEBURG…RISING SUN…VEVAY…CARROLLTON…WARSAW… BURLINGTON…INDEPENDENCE…ALEXANDRIA…OWENTON…WILLIAMSTOWN…FALMOUTH…BROOKSVILLE…MOUNT OLIVET…MAYSVILLE…VANCEBURG…WASHINGTON COURT HOUSE…CIRCLEVILLE…LANCASTER…HAMILTON… LEBANON…WILMINGTON…CHILLICOTHE…LOGAN…CINCINNATI…MILFORD…GEORGETOWN…HILLSBORO…WEST UNION…PIKETON…PORTSMOUTH …WINTER STORM WATCH IN EFFECT FROM SUNDAY EVENING THROUGH LATE MONDAY NIGHT… THE NATIONAL WEATHER SERVICE IN WILMINGTON HAS ISSUED A WINTER STORM WATCH…WHICH IS IN EFFECT FROM SUNDAY EVENING THROUGH LATE MONDAY NIGHT. LIGHT SNOW IS EXPECTED TO DEVELOP SUNDAY EVENING…AS A STORM SYSTEM MOVES INTO THE OHIO VALLEY. SNOW WILL INCREASE IN INTENSITY THROUGH EARLY MONDAY…WITH OCCASIONAL SNOW CONTINUING INTO MONDAY EVENING. BY THE TIME SNOW ENDS EARLY TUESDAY…THE POTENTIAL EXISTS FOR TOTAL SNOWFALL ACCUMULATIONS OF 4 TO 6 INCHES…WITH LOCALLY HIGHER AMOUNTS. THESE FORECAST SNOW AMOUNTS ARE HIGHLY DEPENDENT ON THE EVENTUAL TRACK OF THE UPCOMING STORM SYSTEM. IF THE SYSTEM MOVES FURTHER NORTH OR SOUTH OF THE CURRENT FORECAST TRACK…THEN SNOWFALL AMOUNTS MAY BE LESS.
While Columbus was not included in the initial Watch, its zone forecast did call for accumulating snow by the 13th. OHZ054>056-140930- MADISON-FRANKLIN OH-LICKING- INCLUDING THE CITIES OF…LONDON…COLUMBUS…NEWARK 332 PM EST SAT FEB 13 2010 .TONIGHT…MOSTLY CLOUDY WITH SCATTERED FLURRIES. LOWS 15 TO 20. WEST WINDS 5 TO 10 MPH. .SUNDAY…PARTLY SUNNY. SCATTERED FLURRIES IN THE MORNING. HIGHS IN THE UPPER 20S. SOUTHWEST WINDS 5 TO 10 MPH. .SUNDAY NIGHT…MOSTLY CLOUDY. A CHANCE OF SNOW AFTER MIDNIGHT. LOWS 10 TO 15. WEST WINDS 5 TO 10 MPH…BECOMING NORTHWEST AFTER MIDNIGHT. CHANCE OF SNOW 40 PERCENT. .PRESIDENTS DAY…SNOW. SNOW ACCUMULATION 2 TO 4 INCHES. HIGHS IN THE MID 20S. NORTHEAST WINDS 5 TO 10 MPH…BECOMING NORTHWEST IN THE AFTERNOON. CHANCE OF SNOW 80 PERCENT. .MONDAY NIGHT…CLOUDY. SNOW LIKELY IN THE EVENING…THEN A CHANCE OF SNOW SHOWERS AFTER MIDNIGHT. ADDITIONAL LIGHT SNOW ACCUMULATION POSSIBLE. LOWS 15 TO 20. WEST WINDS 10 TO 15 MPH WITH GUSTS UP TO 25 MPH. CHANCE OF SNOW 70 PERCENT. .TUESDAY…CLOUDY WITH A 50 PERCENT CHANCE OF SNOW SHOWERS. HIGHS IN THE MID 20S. .TUESDAY NIGHT…CLOUDY WITH A 30 PERCENT CHANCE OF SNOW SHOWERS. LOWS AROUND 20.
By the morning of the Valentine’s Day, models had moved far enough north with the low track that the I-70 corridor was in line for much higher totals. At 2:43AM that day, the Winter Storm Watch was expanded into Central Ohio, with predictions of 5″-8″. By late morning, the Watch was upgraded to a Warning, and totals were upped slightly to 6″-9″. OHZ054>056-150930- MADISON-FRANKLIN OH-LICKING- INCLUDING THE CITIES OF…LONDON…COLUMBUS…NEWARK 409 PM EST SUN FEB 14 2010 …WINTER STORM WARNING IN EFFECT FROM 4 AM MONDAY TO 6 AM EST TUESDAY… .TONIGHT…PARTLY CLOUDY THIS EVENING…THEN MOSTLY CLOUDY WITH A SLIGHT CHANCE OF SNOW AFTER MIDNIGHT. MOSTLY CLOUDY WITH A CHANCE OF SNOW LATE. LOWS 15 TO 20. SOUTHWEST WINDS 5 TO 10 MPH… BECOMING SOUTHEAST AFTER MIDNIGHT. CHANCE OF SNOW 40 PERCENT. .PRESIDENTS DAY…SNOW. SNOW MAY BE HEAVY AT TIMES IN THE AFTERNOON. SNOW ACCUMULATION OF 4 TO 6 INCHES. HIGHS IN THE UPPER 20S. NORTHEAST WINDS 5 TO 10 MPH…BECOMING NORTH IN THE AFTERNOON. CHANCE OF SNOW 100 PERCENT. .MONDAY NIGHT…SNOW…MAINLY IN THE EVENING. TOTAL SNOW ACCUMULATION OF 6 TO 9 INCHES. LOWS AROUND 20. WEST WINDS 10 TO 15 MPH WITH GUSTS UP TO 25 MPH. CHANCE OF SNOW 90 PERCENT. .TUESDAY…CLOUDY. SNOW SHOWERS LIKELY…MAINLY IN THE AFTERNOON. ADDITIONAL LIGHT SNOW ACCUMULATION POSSIBLE. HIGHS IN THE MID 20S. WEST WINDS 15 TO 20 MPH WITH GUSTS UP TO 30 MPH. CHANCE OF SNOW 60 PERCENT. .TUESDAY NIGHT…CLOUDY WITH A 40 PERCENT CHANCE OF SNOW SHOWERS.LOWS IN THE LOWER 20S. WEST WINDS 10 TO 15 MPH WITH GUSTS UP TO 25 MPH.
Snow began in the area by 8:30AM on the 15th and was heavy through mid-afternoon. The bulk of the snow moved out of the area by Midnight, with only occasional wraparound snow showers continuing into the 16th.
The storm generally exceeded forecast snow totals across the region. Columbus received a record 9.7″ for the 15th, with a total storm total of 10.4″, making it one of the very rare storms to produce double-digit snowfall totals for the city. Since 1950, Columbus has had just 6 such events- the Great Thanksgiving Blizzard of 1950, April 3-4, 1987, February 14-17, 2003, March, 2008, President’s Day 2010 and February 4-5, 2014. Double-digit snowfalls have historically occurred roughly once every 12 years. It has been 9 years since the last one, but there have been decades between some of them.
Snowfall totals across Franklin County were 7″-11″, with the highest totals in the southwest. Most of the I-70 corridor south had at least 6″. Snow depths in Columbus reached record highs, with the airport having a post-storm depth of 14″, the highest February depth since at least 1939.
This was the peak event for the month, but not the end of February, 2010’s historically snowy run. A 4th, but far smaller snow event would occur towards the end of the month, bringing a general 3″-5″ across most areas. This would contribute to making the month the all-time snowiest on record for many areas. Columbus’ 30.1″ of snow for the month was the highest on record, and is the 2nd snowiest of any month to ever occur, falling just behind January, 1978’s 34.4″. Cincinnati, Dayton and other cities would also record either their top snowiest or 2nd snowiest February as well. Additionally, Winter 2009-2010 went into the record books at the 5th snowiest of all time. A truly memorable run!
If you are interested in seeing stats from other winters, records of all types can be found on the Winter Season Records page.