I talked about housing permits before- almost a decade ago now- and thought it would be a good time to update and expand the information. The following graphs detail Columbus area housing permits as they pertain to new residential units being permitted for construction.
Up first, the below graph shows all permitted units by type for the entire metro area since 1995.
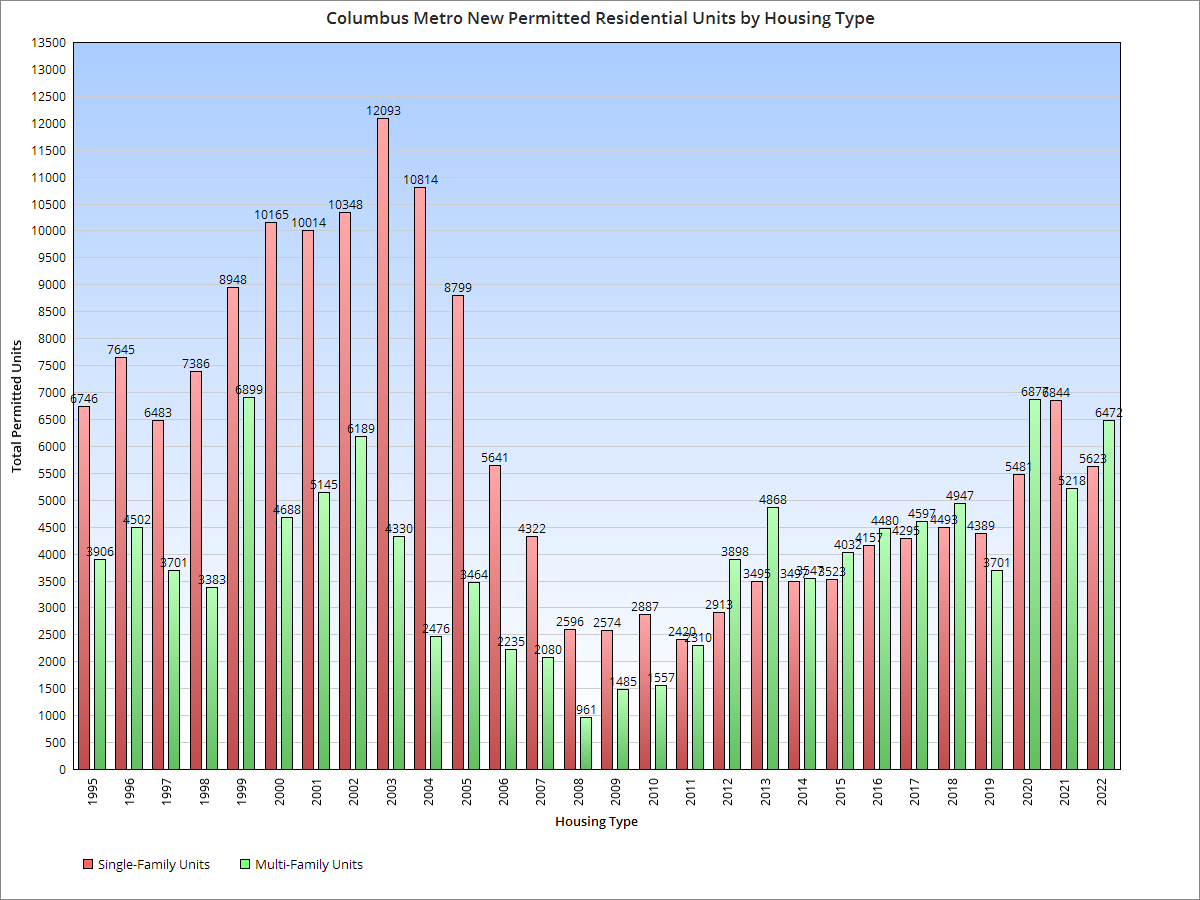
What most stands out about the graph is how single-family construction dominated until the late 2000s. When the Great Recession hit, it completely changed that dynamic. Since then, multi-family units have mostly been on top in most years, perhaps because more money could be made with them with less financial risk.
Here is the permitted housing type as a % of total permitted units.
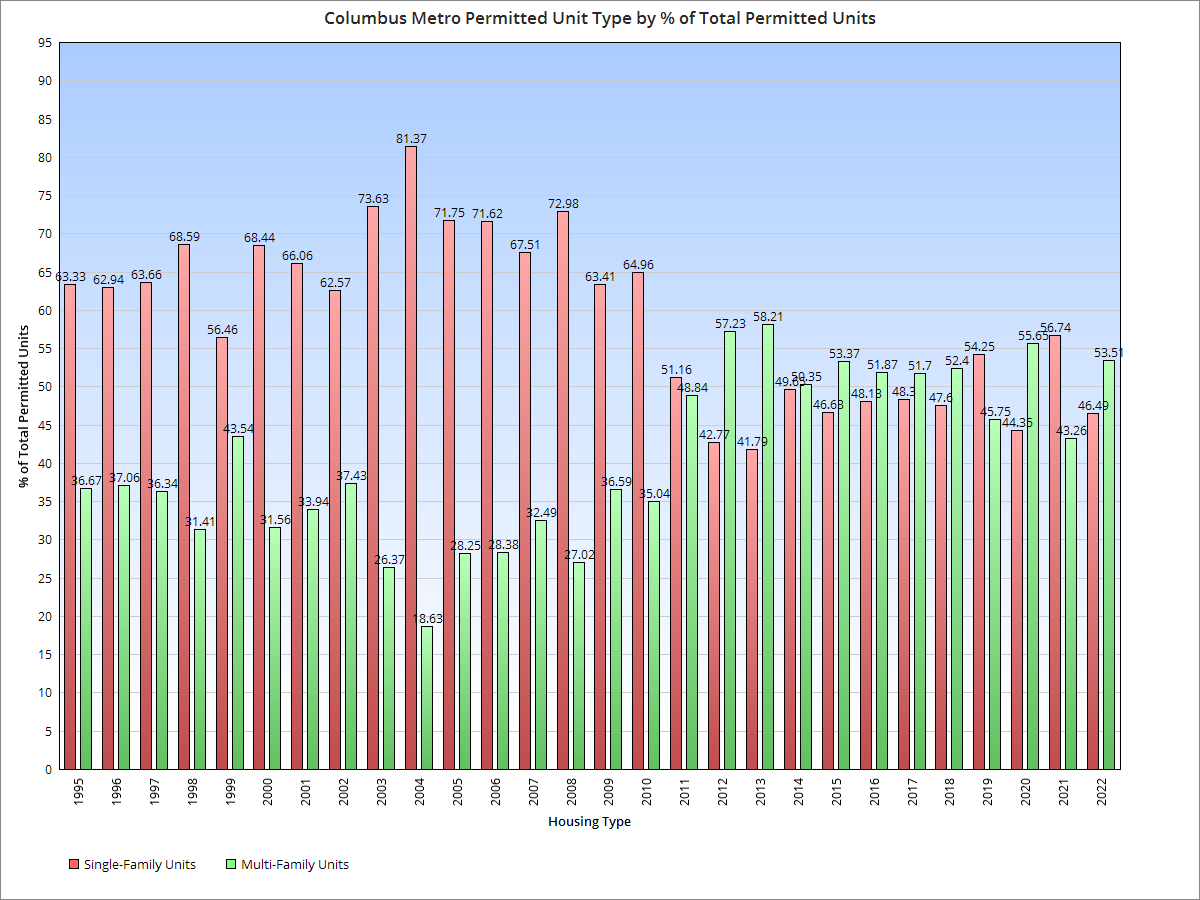
Between 1995-2010 the average breakdown was 67.46% Single-Family and 32.54% Multi-Family. Since 2010, the breakdown has been 48.16% Single-Family and 51.84% Multi-Family, representing a full 38.6-point margin change towards Multi-Family.
But what about what is actually getting permitted within just the city of Columbus, rather than the entire metro? City-exclusive data is available going back to 1980.
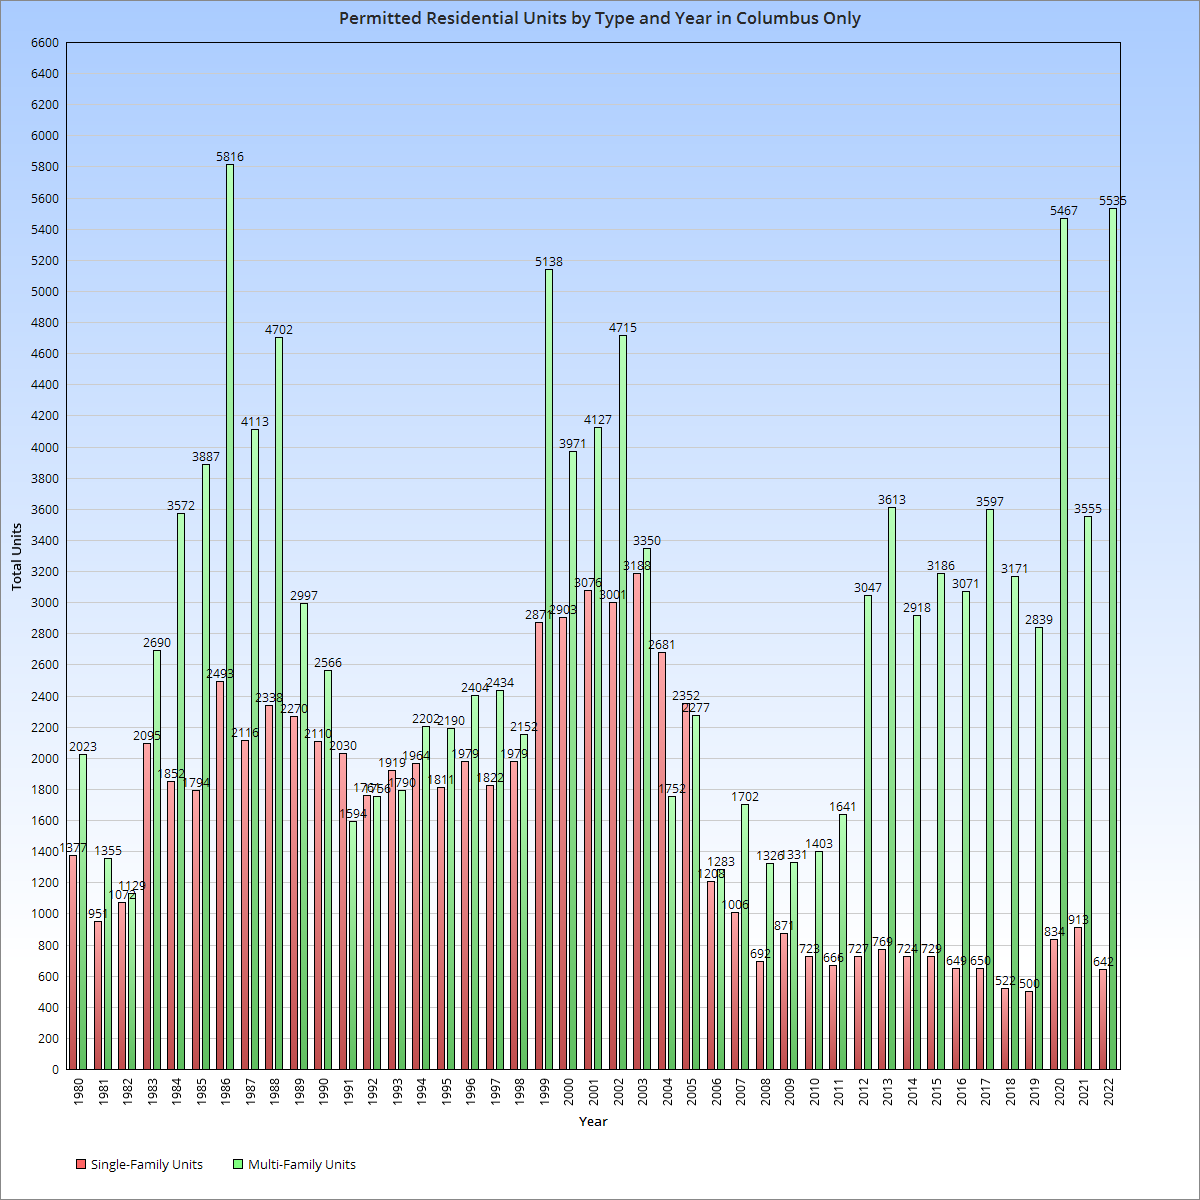
The city experienced the same shift as the overall metro, but much more drastically.
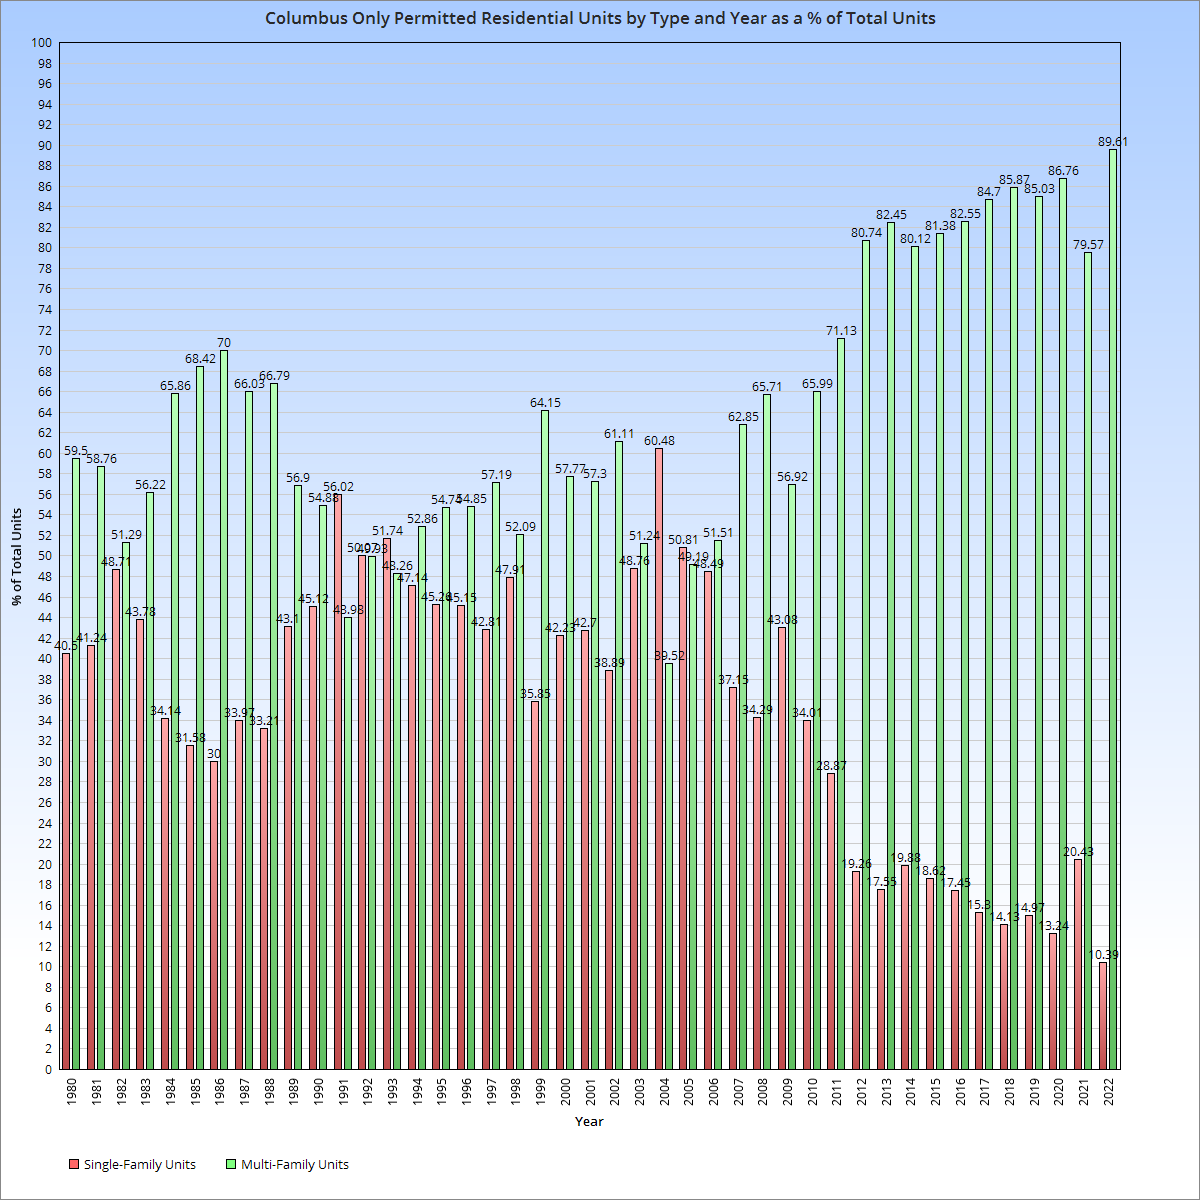
The % of total units by type for the city shows that single-family housing has been steadily becoming a smaller part of new construction permits since around 2003.
Finally, let’s break down multi-family permits by total number of buildings per unit count for the city only.
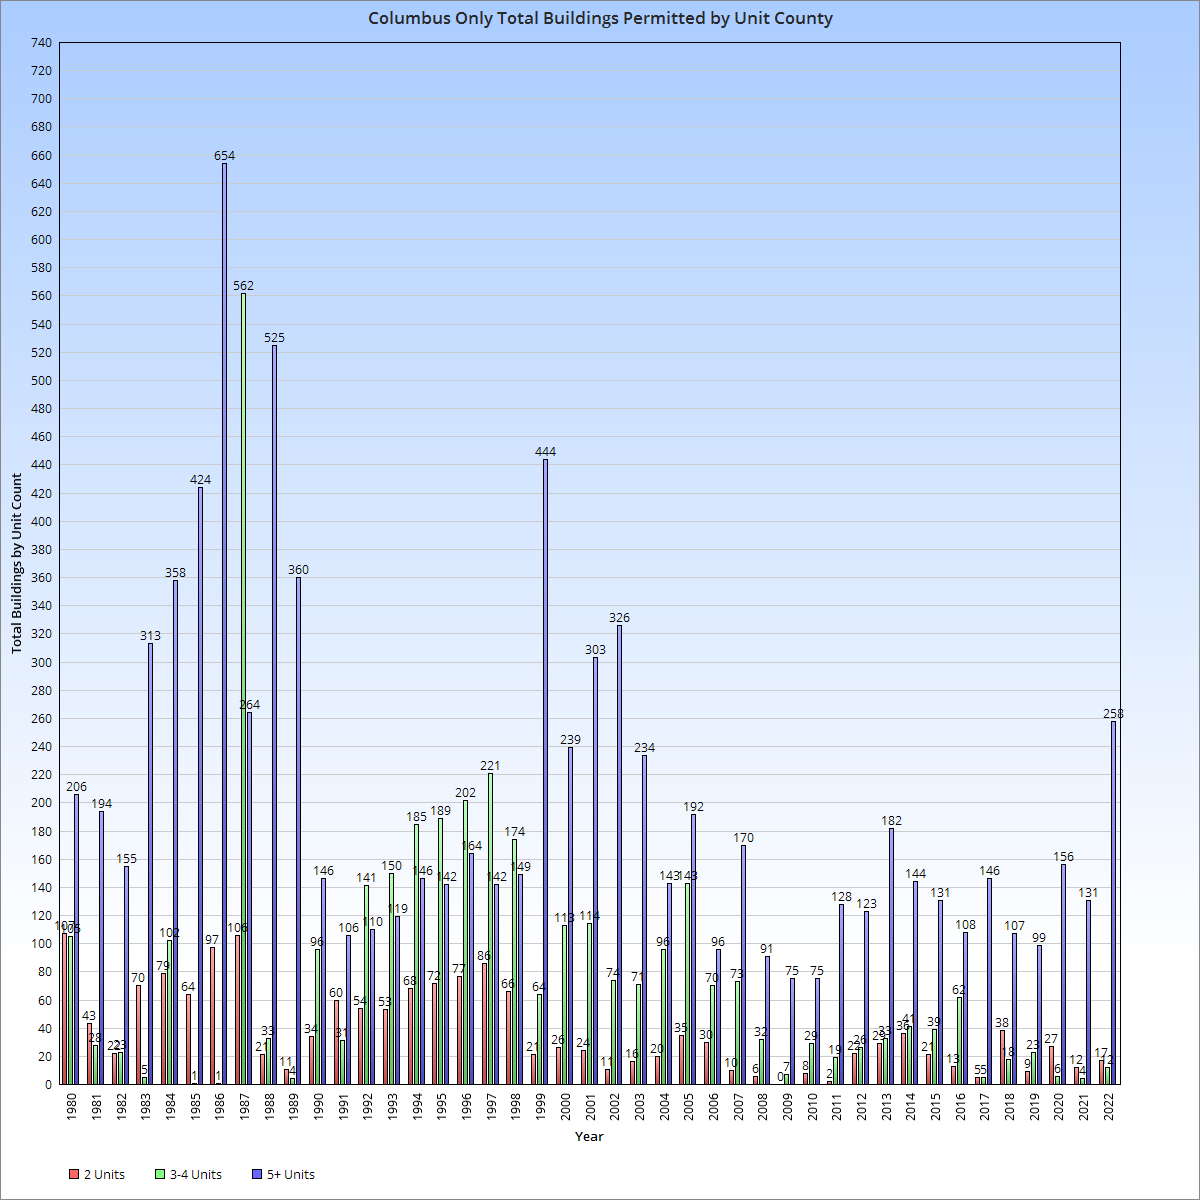
Except for during the 1990s, 5+-unit buildings have been dominant, but it seems that fewer overall buildings are being built despite total units being high, suggesting that project size has increased over the years.