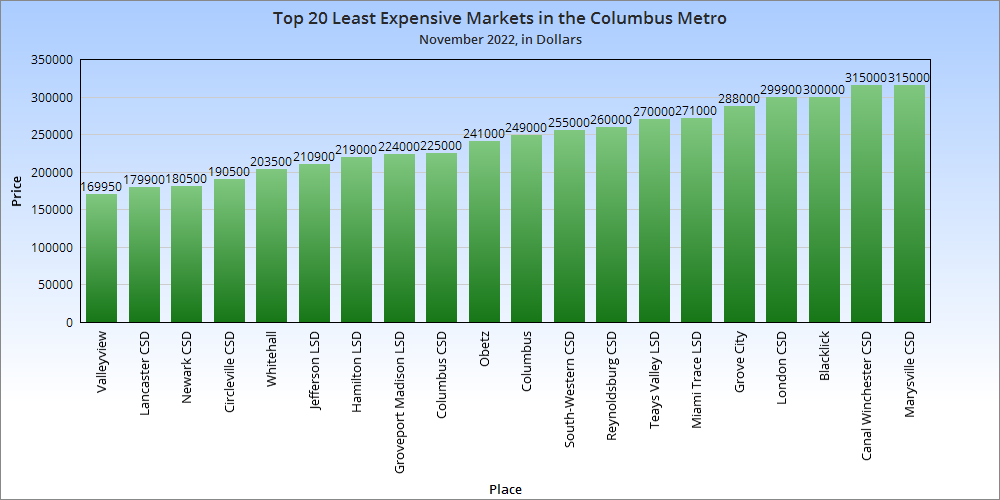
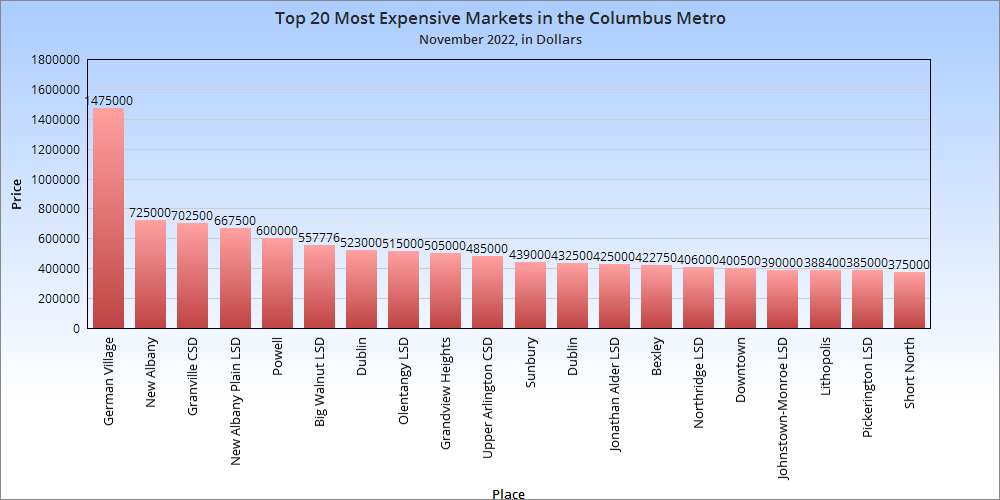
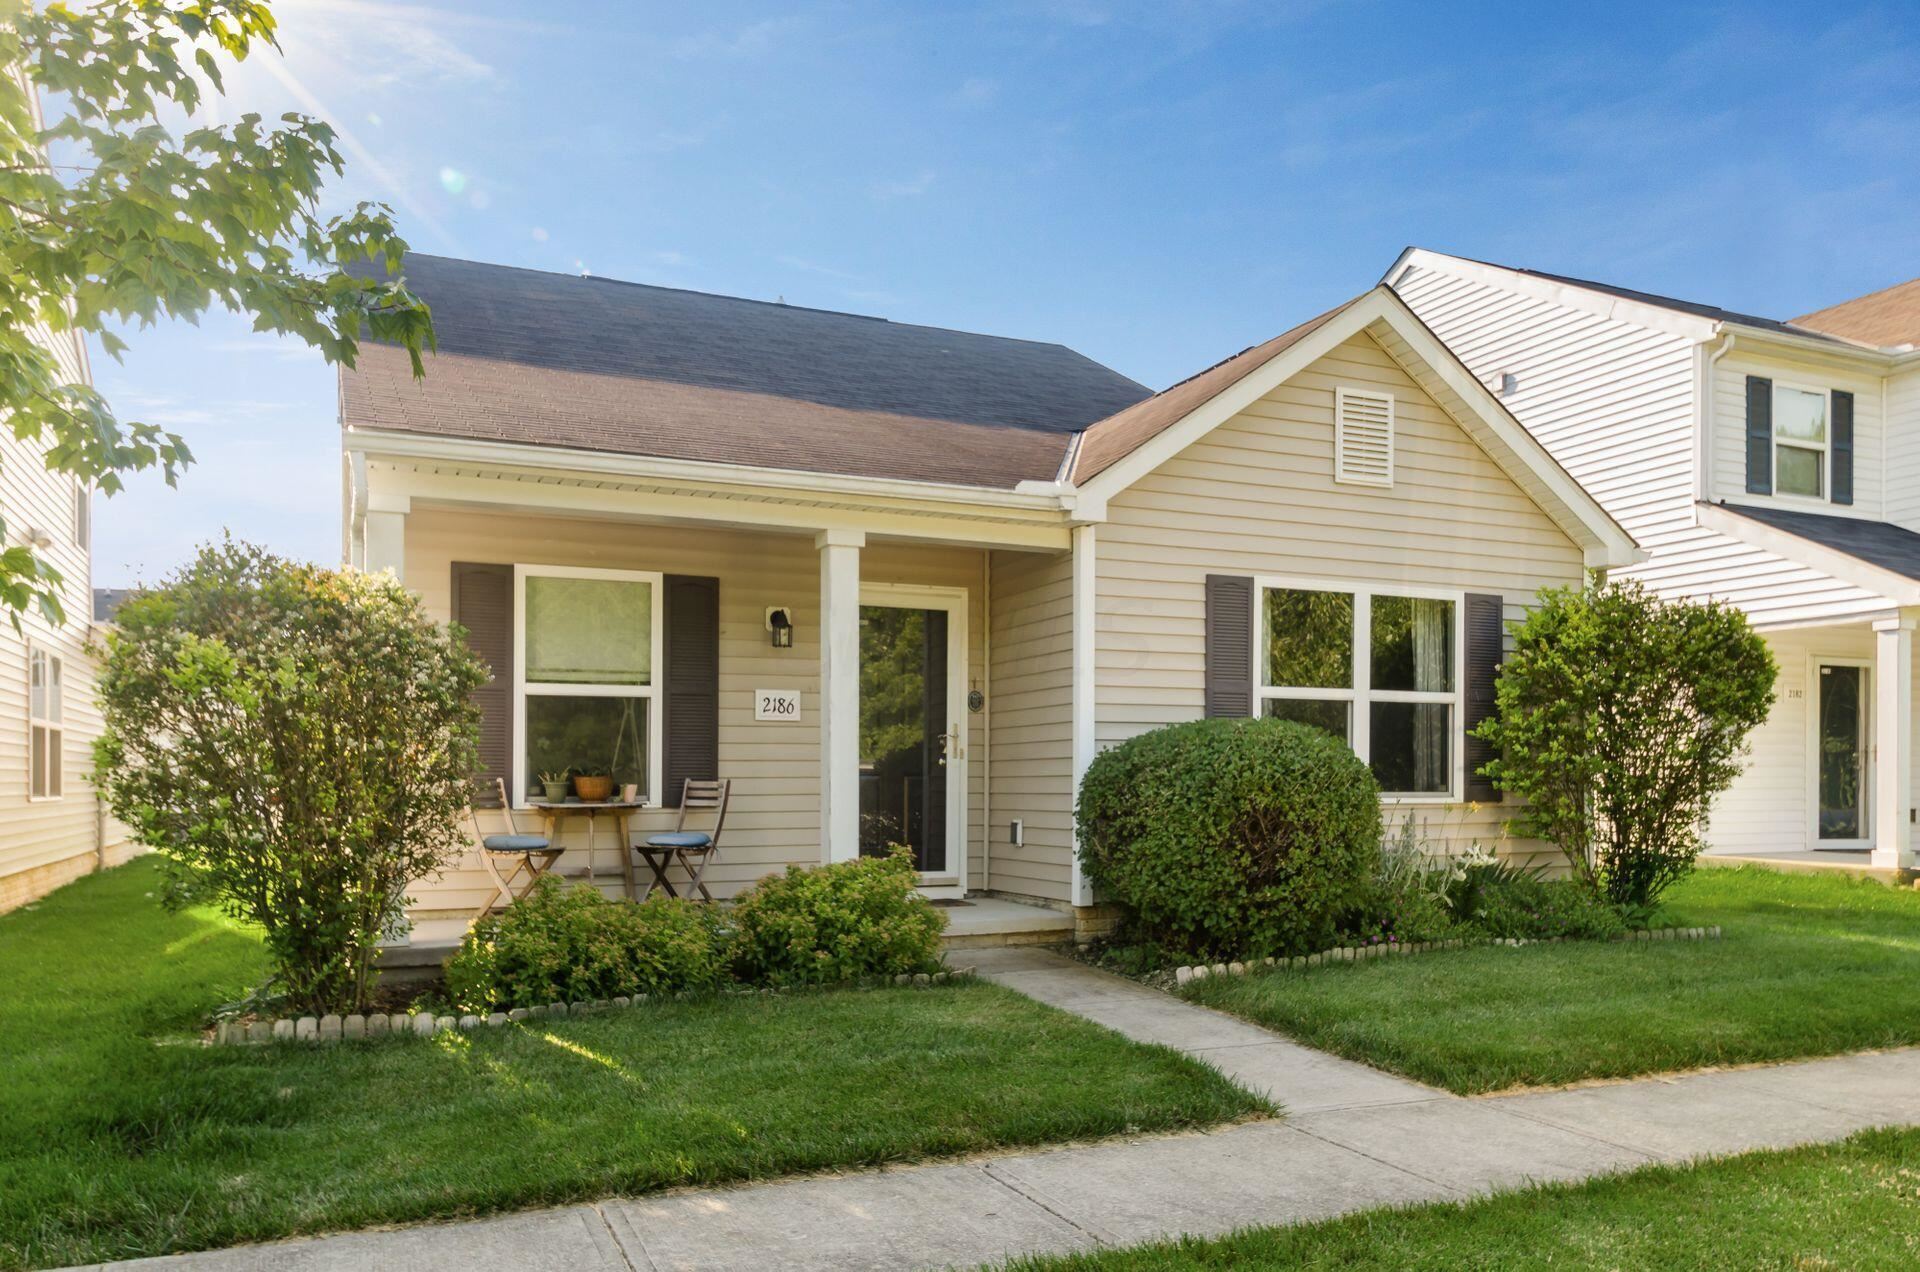
The Housing Market Update November 2022 data from Columbus Realtors showed home sales were down nearly 30% from a year ago, and new listings decreased nearly as much. However, prices remained on their trajectory upwards across the metro area.
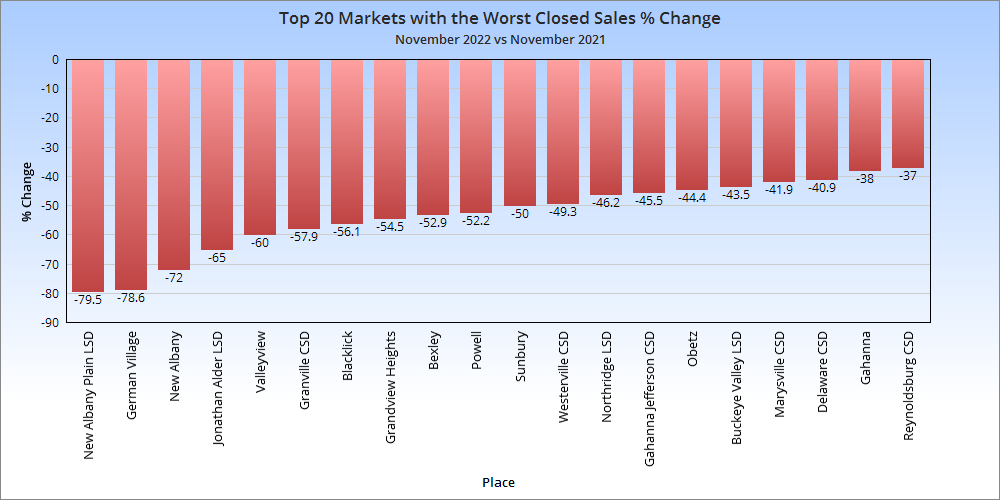
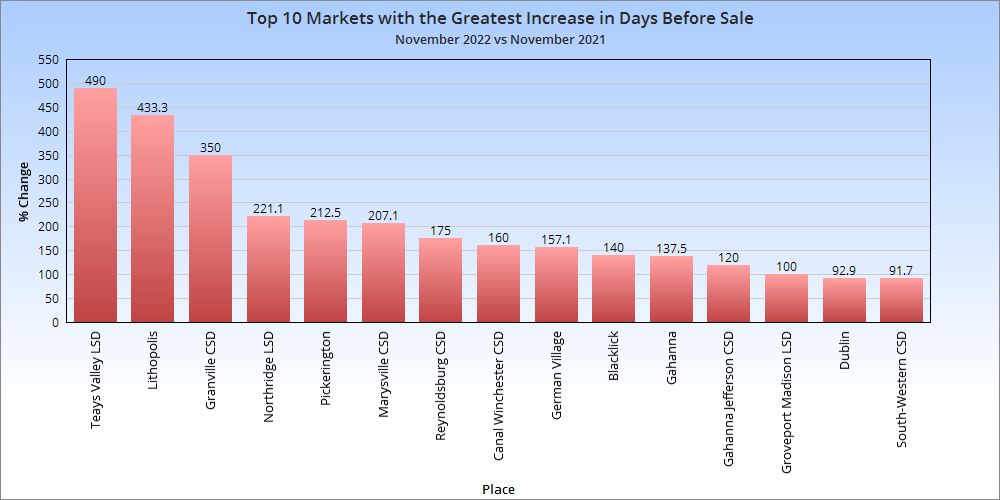
Note: LSD= Local School District, CSD= City School District. In both cases, school district boundaries differ from city boundaries.
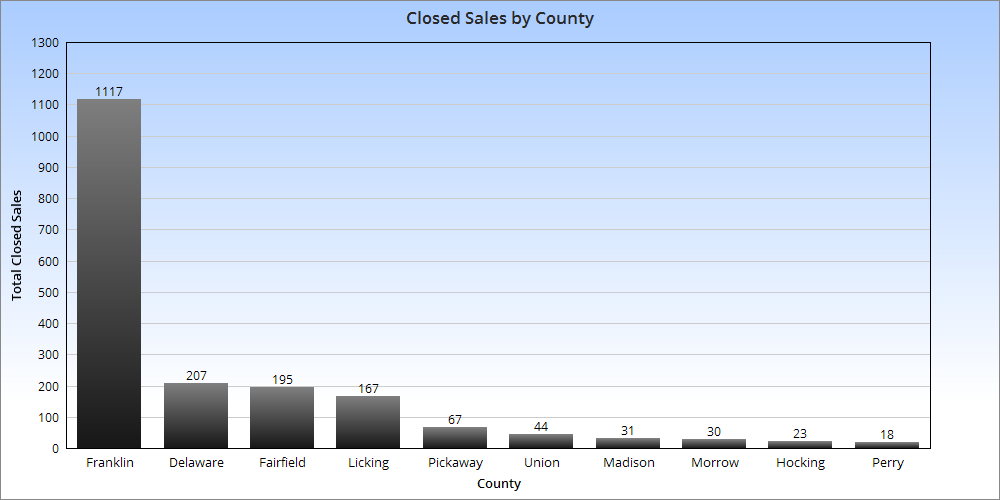
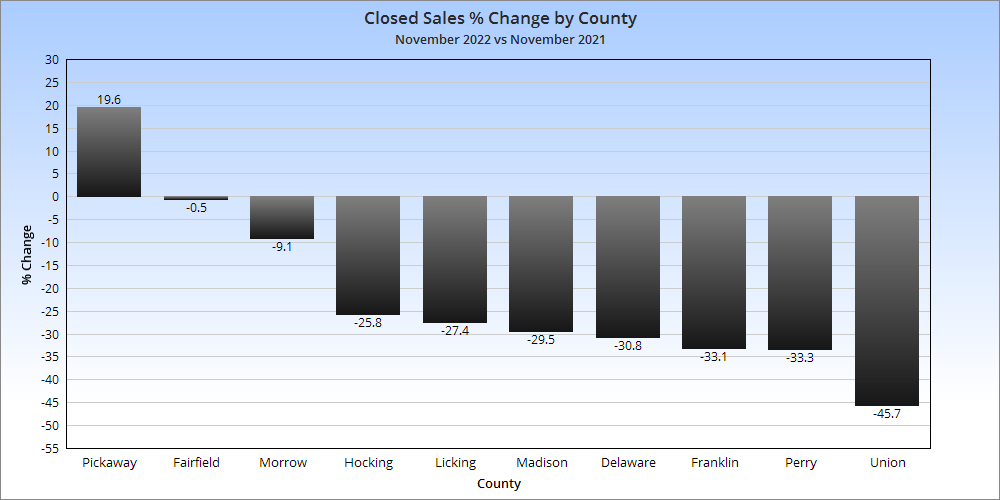
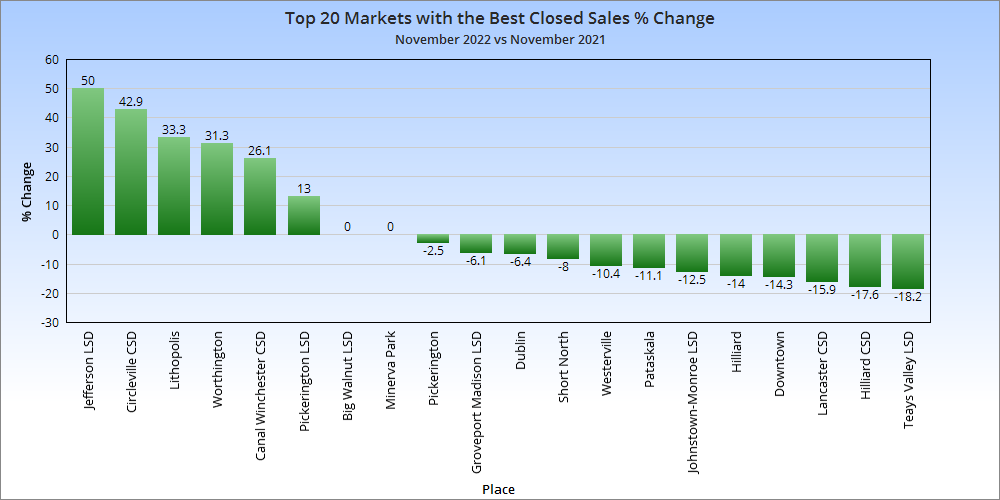
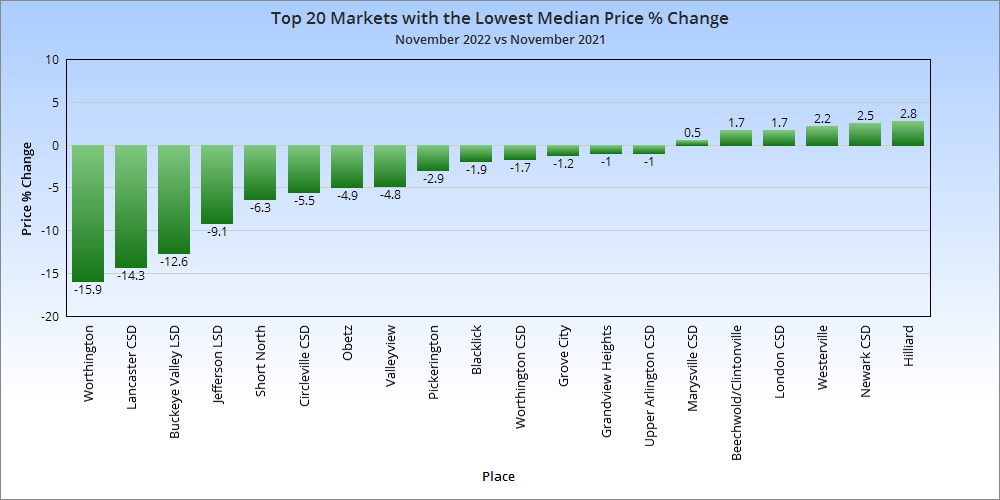
Closed sales are those sales that were completed during the month. 9 of the 10 metro counties saw declines, with 8 of them being fairly significant. Few markets were up year-over-year. The worst-performing were mostly among the metro’s most expensive areas, but there were a few standouts otherwise.
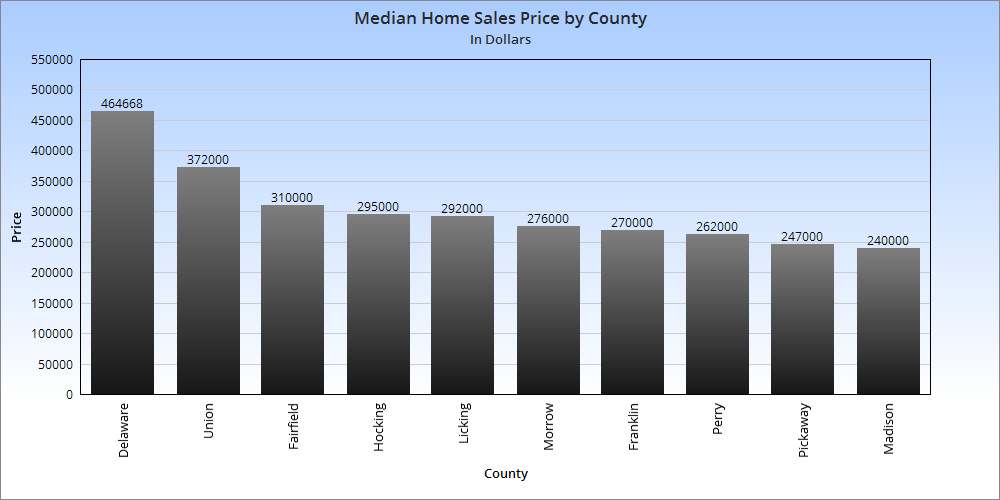
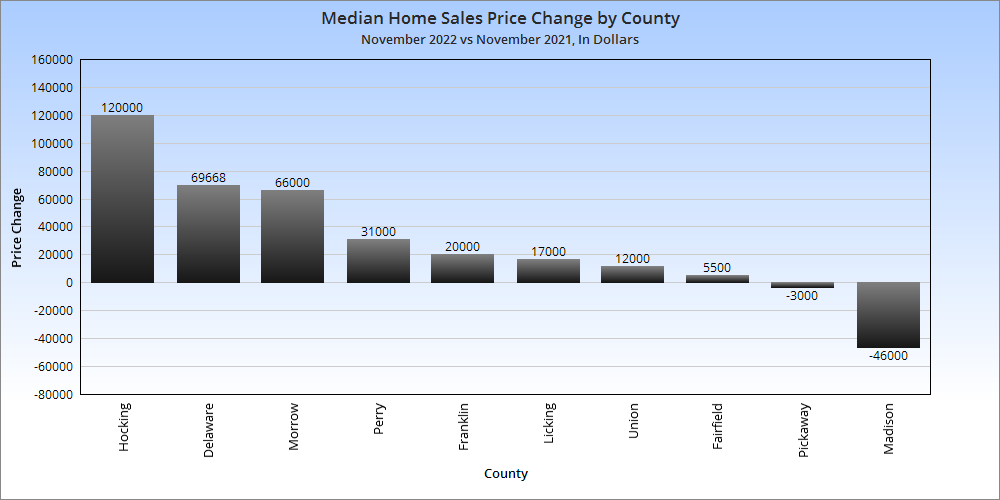
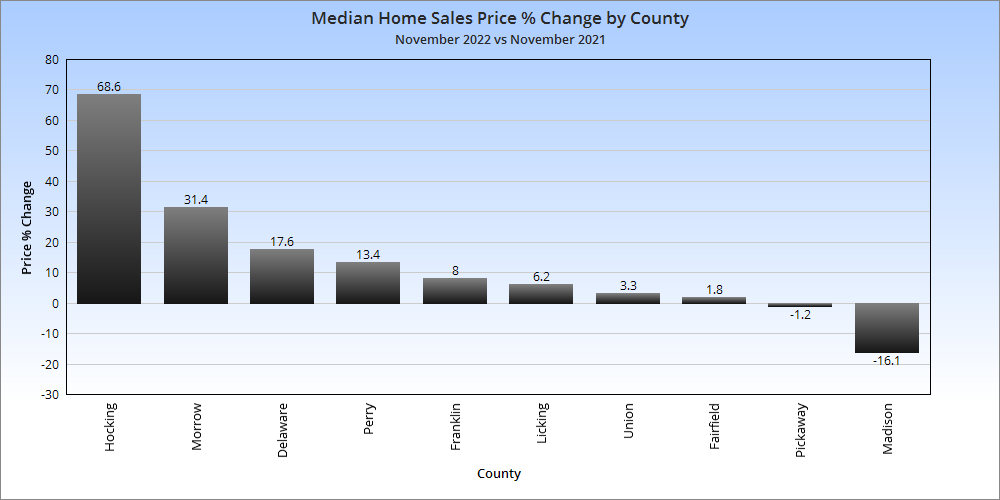
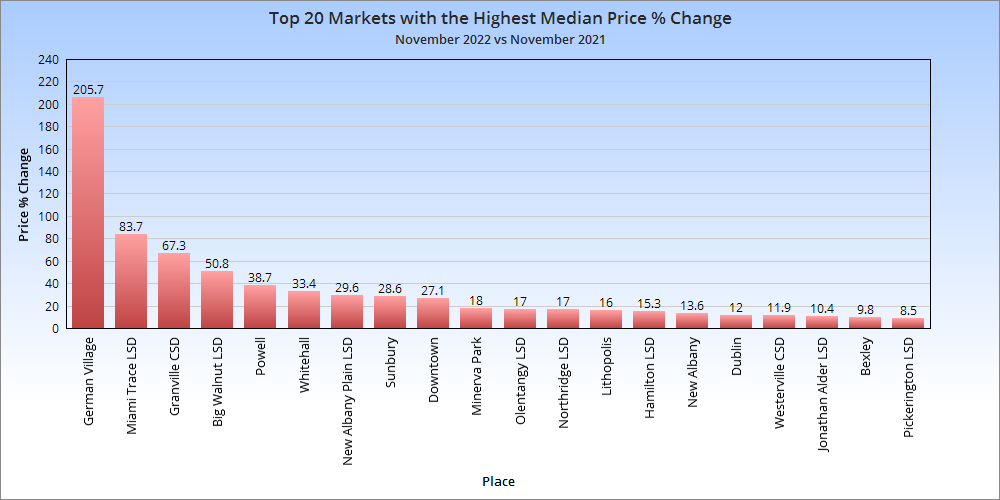
No real surprises except that the greatest increases were in the far southeast metro counties, but that could be because of working with a small supply. Overall Market Median Sales Price in November 2022: $302,867 Based on the 10 Columbus Metro Area counties, the metro price saw a more than $29,000 increase over November, 2021. Overall Market Median Sales Price % Change in November, 2022 versus November, 2021: +10.1% Despite the relative collapse in home sales, prices continued to rise by more than 10% year-over-year.
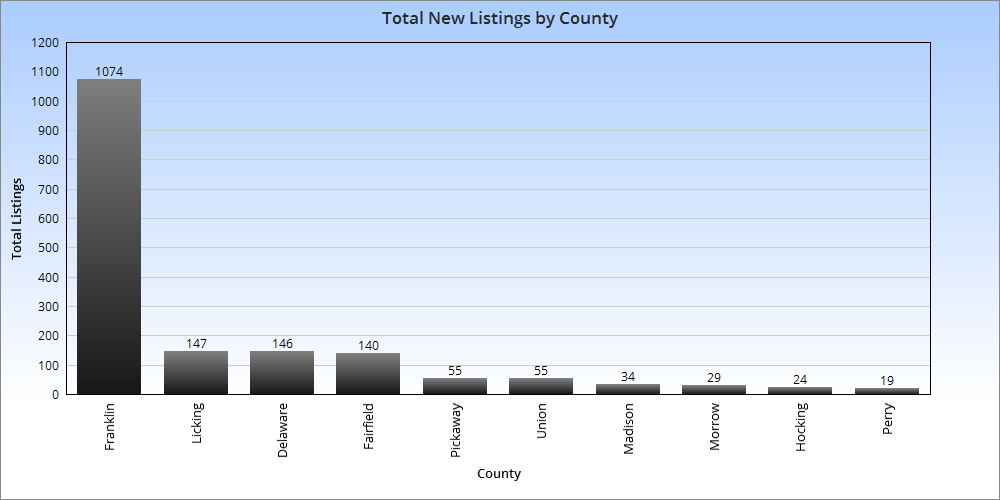
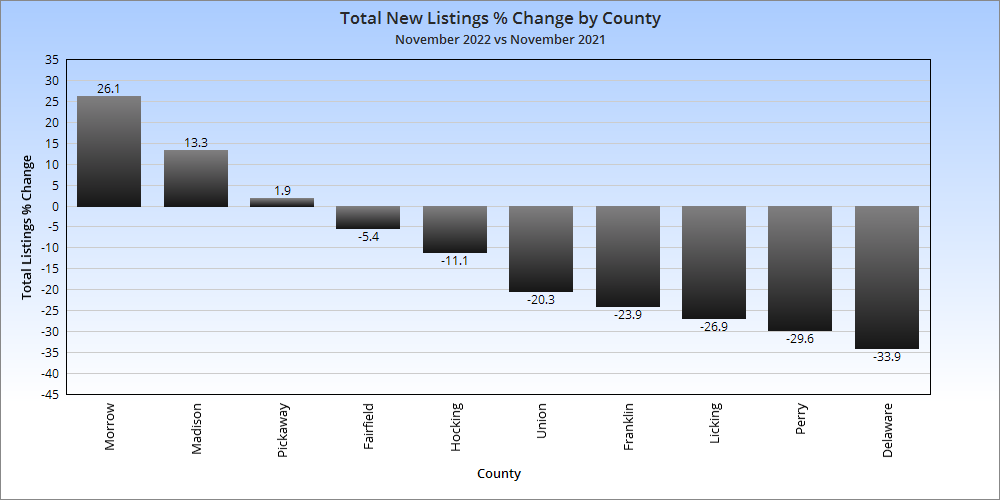
Most counties saw new listing totals drop year-over-year. This may have helped keep prices going up as demand hasn’t evaporated. Total Metro New Listings in November, 2022: 1,723 Total Metro New Listings Change from November, 2021 to November, 2022: -489
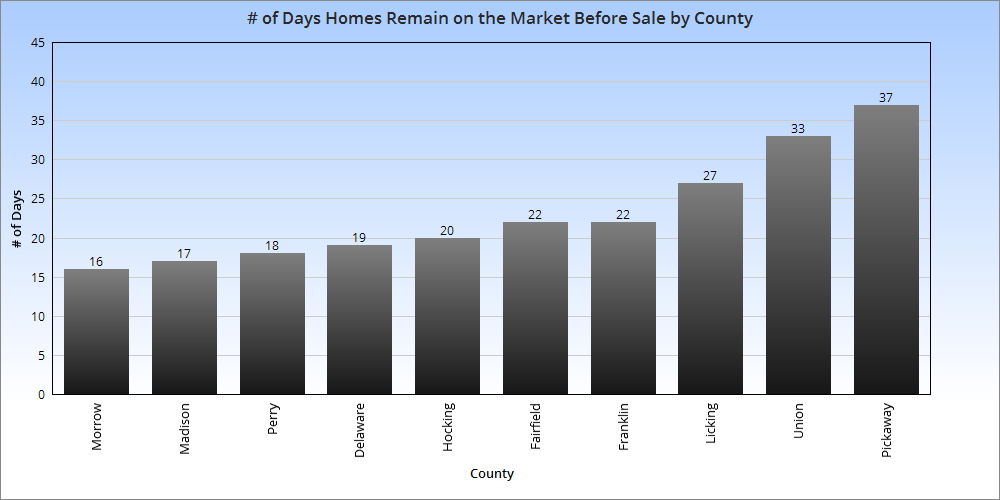
Average # of Days Homes Remain on the Market Before Sale for the Metro Overall in November, 2022: 23.1 # of Days Homes Remain on the Market Before Sale for the Metro November, 2021 vs. November, 2022: +10.5 Homes sold more slowly around the Columbus metro, but only by a few days. The rate of sale is still historically fast.
Intel’s big project northeast of New Albany is now well-known. People are both excited and cynical about all the potential impacts that will come with it. But what is not discussed nearly as much- and is arguably just as important long-term- is what happens to all the land around it. Rumors are already flying about developers scrambling to snatch up as much land as they can for housing, and that is no doubt true. The land is largely a blank slate, so what happens to it from this point is entirely up to the cities, towns and townships that the land sits within. Without a coordinated effort and plan, the area will almost certainly become a nightmarish cluster**** of low-density sprawl and endless traffic, which would be to the detriment of all.
So what can be done? How we should develop around Intel is not really the open question some might think. The answer, it seems, is pretty obvious once you get into the details of what types of development provide the most economic and social benefits.
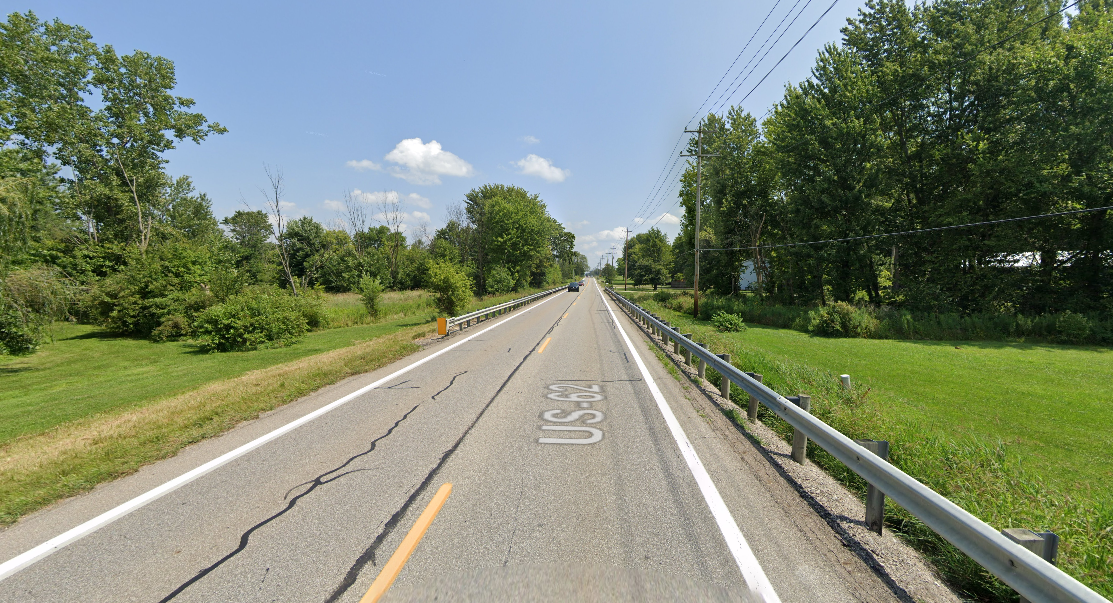
The Area Today The main Intel site is bounded by Green Chapel Road, Mink Street, Miller Road and Clover Valley Road, encompassing about 1,000 acres, but a larger expansion area is about 3x that size, as shown by the map below. This area is largely rural and almost entirely made up of farms. There is very little organized development between New Albany and Johnstown, which this site sits between. 2-lane Rt. 62, otherwise known as Johnstown-Utica Road, is the main connection between the two and runs just north of the Intel site.
How Rt. 62 looks today.
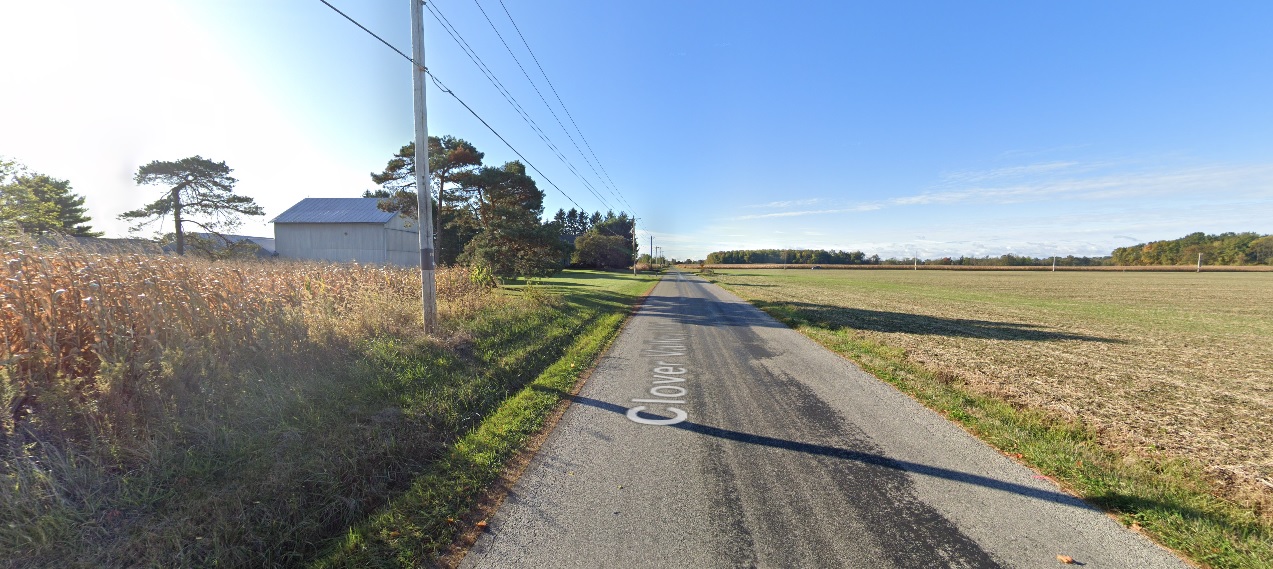
Clover Valley Road adjacent to the Intel site.
Planned/Ongoing Infrastructure Changes 2022-2023 -Jug Street between Beech Road and Clover Valley Road is being widened to 3 lanes. -Jug Street between Clover Valley Road and Mink Street will be widened, but still be 2 lanes. -Green Chapel Road between Rt. 62 and Clover Valley Road will be widened to 3 lanes. -Green Chapel Road between Clover Valley Road and Mink Street will be widened to 5 lanes. -Mink Street between 161 and Green Chapel Road will be widened to 5 lanes. 2024-2025 -Harrison Road between Clover Valley Road and Mink Street will be widened to 3 lanes and will be extended between Clover Valley Road and Jug Street. -Clover Valley Road will be widened to 3 lanes between Jug Street and Green Chapel Road. -Beech Road between Innovation Corridor Way and Jug Street will be widened to 5 lanes. -Beech Road between Jug Street and Rt. 62 will be widened to 3 lanes. -Miller Road between Beech Road and Clover Valley Road will be widened to 3 lanes.
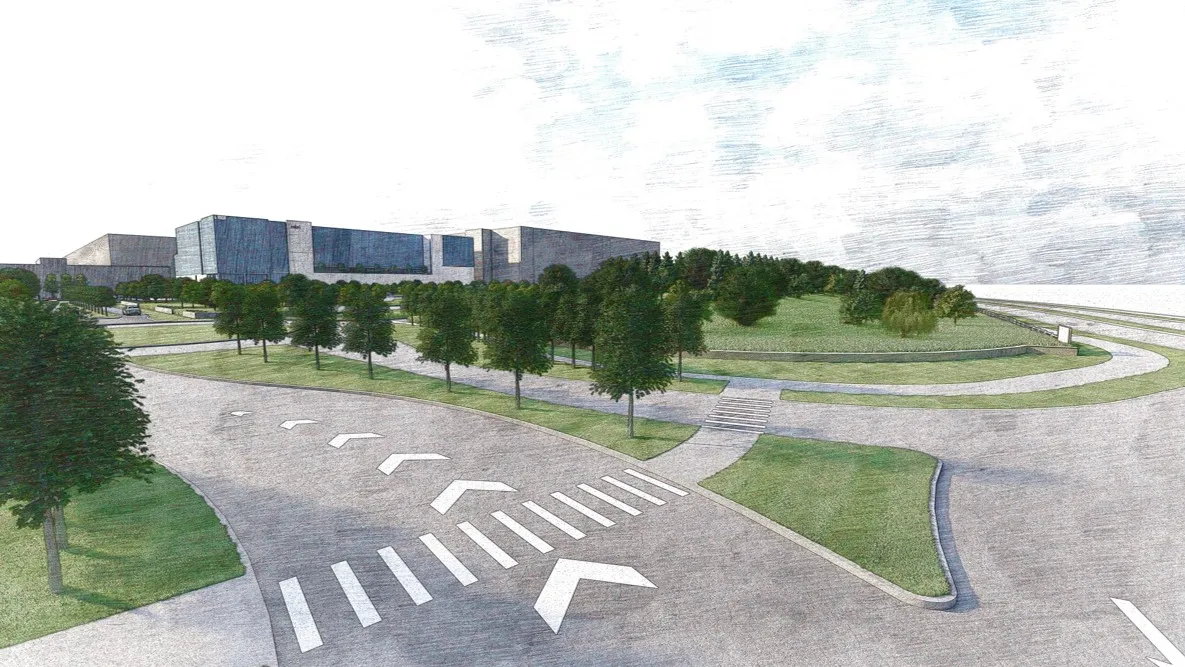
Beyond these road changes, little of anything else is planned. Where Intel has made a presence in other communities in other states, unregulated sprawl seemed to be what mainly happened, but that doesn’t have to happen here. Here is a general outline of what could be.
Map Highlights -Rt. 62 becomes a mixed-use commercial, retail, restaurant and residential corridor along a tree-line boulevard capable of handling either bike or transit lanes (or both). Several other roads around the area also become boulevards. A “town center” of sorts could be created at the 4-way intersection in red, with mixed-use corridors in all 4 directions. South of 62, medium to high-density residential on a street grid would be the best use, while north of 62 would be more of a mixed-density residential development on a street grid. In both cases, the residential areas would be dotted with parks and playgrounds, corner shops, cafes and other amenities. The Intel site and surrounding area itself is already basically spoken for, with several areas of planned expansion, while further to the south, New Albany’s business park could see gradual expansion as well.
Now, none of this is more than a thought experiment. There is likely to be heavy NIMBY opposition by locals to any major development, let alone what would be considered a more urban and dense style. However, development is going to happen with or without local approval. The demand will be incredible and far too strong for it to be killed off entirely. All that opposition is likely to accomplish is to create all of the problems they think they’re trying to prevent. There are reasons to go with density and grids over not. Here are just a few of the advantages of a street-grid-based higher density plan:
1. Higher land values. Gridded street layouts tend to haver higher land values than sprawl. 2. Taxes. Gridded streets allow for the creation of higher densities, and as mentioned, higher land values. Cities and towns therefore get a much greater tax return than they would with sprawl. 3. Lower traffic. Gridded streets allow more connectivity between one street and another, and therefore provide more routes to choose from when attempting to avoid traffic. This allows for more traffic dispersal across the board. 4. Lower infrastructure costs. Higher densities allow infrastructure costs to be divided among a greater population, creating a lower general financial burden for residents, as well as local and state entities. 5. More adaptability. It is much easier and cheaper to rebuild along gridded streets than it is the winding streets in the average sprawled neighborhood. The infrastructure doesn’t need to be rebuilt to change development patterns. So low-density housing can be built on a grid initially and then gradually replaced with higher density residential or mixed-use depending on demand. 6. Better transit access. It is very difficult to build transit systems within a sprawled area. Winding roads prevent higher travel speeds for transit, making them inefficient and slow. These systems are also rarely, if ever, built during the initial creation of sprawled neighborhoods. Sprawl is not very adaptable to adding them later if the population density becomes significant enough in the future to support them. 7. Safer for pedestrians. Because gridded streets do such a better job at traffic dispersal, they can be narrower than say, your typical American stroad. As such, narrower streets tend to slow down traffic, lowering the risk of harm to pedestrians and bikers.
So the benefits are pretty clear, but will anyone see them? Johnstown’s government is currently a hot mess, New Albany- which at least has a bit of a track record in planning- doesn’t own any of the land, and neither have hinted whatsoever that they’d even be interested in coming up with a plan. Few, if any, of the developers buying up property have any sort of track record outside of sprawl. Enormous changes are coming for this area, and for Central Ohio as a whole. It’s going to take forward-thinking leadership to step up- and soon- before it’s too late.
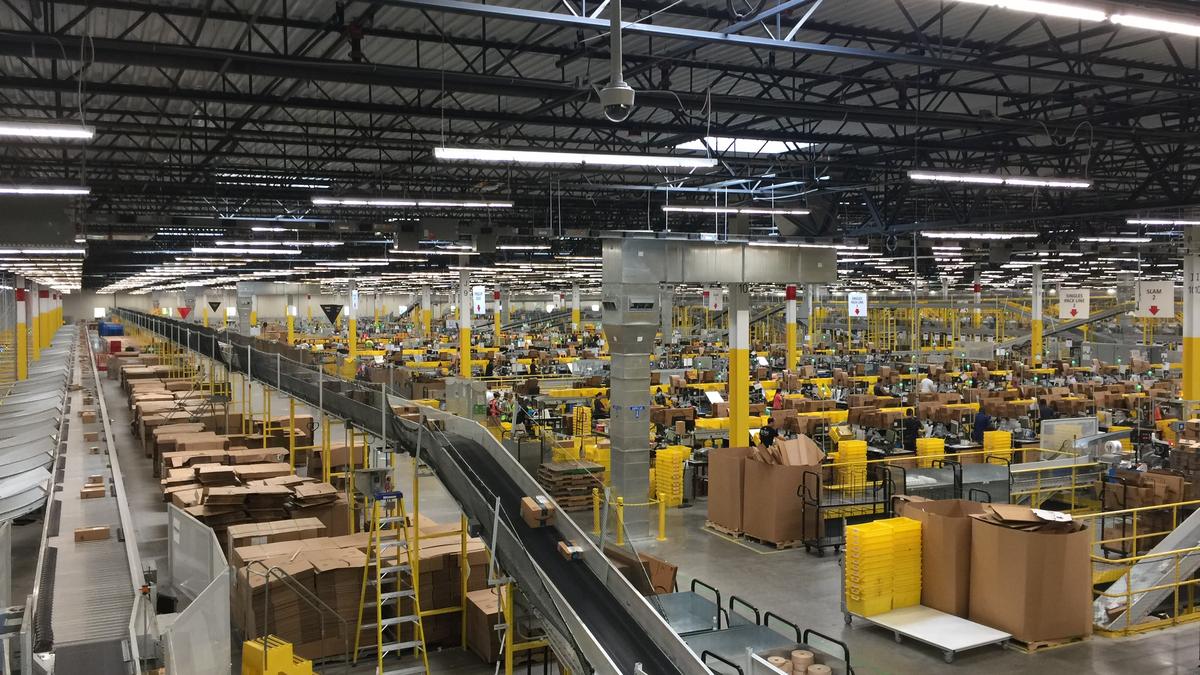
For the Columbus economy July 2022 report, we find several local industries in record high territory, but with a metro labor force that is barely growing. The data comes from the Bureau of Labor Statistics.
Overall Metro Area July 2022 and Change from July 2021 Labor Force: 1,136,345 +1,050 Employed: 1,093,966 +13,074 Unemployed: 42,379 -12,024 Unemployment Rate: 3.7% -1.1 Total Non-Farm Jobs: 1,126,200 +16,400 Numbers continued the trend of improvement year-over-year, but labor force growth remained relatively slow.
Overall Metro Area July 2022 and Change from February 2020 (Pre-Pandemic) Labor Force: 1,136,345 +15,541 Employed: 1,093,966 +17,126 Unemployed: 42,379 -1,585 Unemployment Rate: 3.7% -0.2 Total Non-Farm Jobs: 1,126,200 +14,800 The overall metro area remained better in July than the last month prior to the pandemic.
Now let’s view the results by industry.
Mining/Logging/Construction 7/2020———–7/2021———-7/2022 45,200————46,800———48,200 These industries remain near their all-time highs for total metro jobs. Mining/Logging/Construction Jobs as a % of Total Metro Jobs 7/2020————7/2021———7/2022 4.3——————4.2————–4.3
Manufacturing 7/2020———–7/2021———-7/2022 70,100———–72,700———-72,900 Manufacturing has largely recovered from pandemic losses, but remains well below historic highs achieved decades ago. Manufacturing Jobs as a % of Total Metro Jobs 7/2020————7/2021———-7/2022 6.7——————6.6—————6.5
Trade/Transportation/Utilities 7/2020———–7/2021———-7/2022 215,000———-225,400———240,200 These industries are at historic highs. Trade/Transportation/Utilities Jobs as a % of Total Metro Jobs 7/2020————7/2021———7/2022 20.4—————–20.3———–21.3
Information 7/2020———–7/2021———-7/2022 15,300———–16,000———-17,000 While nowhere near previous highs of the late 1990s-early 2000s “Dot.com” boom, this industry has been steadily growing since it hit a pandemic bottom in late 2020, and has returned to levels last seen in 2019. Information Jobs as a % of Total Metro Jobs 7/2020————7/2021———-7/2022 1.5——————1.4—————1.5
Financial Activities 7/2020———–7/2021———-7/2022 85,200———–85,900———-85,600 Financial jobs initially recovered from the pandemic recession, but then in late 2021 through part of 2022 plummeted to their lowest levels in 6 years. However, since May, they have been shooting back up and are once again close to historic highs. Financial Activities Jobs as a % of Total Metro Jobs 7/2020————7/2021———-7/2022 8.1——————7.7—————7.6
Professional and Business Services 7/2020———–7/2021———-7/2022 172,800———-183,800———181,200 These industries have been hovering around their highs since about 2015, so it seems like these jobs have not been changing much in recent years. Professional and Business Services Jobs as a % of Total Metro Jobs 7/2020———–7/2021———-7/2022 16.4—————-16.6————–16.1
Education and Health Services 7/2020———–7/2021———-7/2022 152,100———-159,800———161,800 While these industries have not fully recovered to pre-pandemic levels, they are relatively close to doing so. Education and Health Services Jobs as a % of Total Metro Jobs 7/2020———–7/2021———-7/2022 14.4—————-14.4————-14.4
Leisure and Hospitality 7/2020———–7/2021———-7/2022 90,600———–105,600————108,000 This industry should be near historic highs by the holiday season, despite being hit the hardest during the recent recession. Leisure and Hospitality Jobs as a % of Total Metro Jobs 7/2020————7/2021————7/2022 8.6——————9.5——————9.6
Other Services 7/2020———–7/2021———-7/2022 37,400———–41,100———-41,900 This industry is near historic highs. Other Services Jobs as a % of Total Metro Jobs 7/2020———–7/2021———-7/2022 3.5—————–3.7—————-3.7
Government 7/2020———–7/2021———-7/2022 170,100———-172,700———169,400 Government jobs have been in a slow decline since the pandemic recession. Government Jobs as a % of Total Metro Jobs 7/2020———–7/2021———-7/2022 16.1—————15.6————–15.0
For the Columbus economy May 2022 report, we will look for any signs that the local economy is being negatively affected by ongoing inflation and higher energy prices.
Overall Metro Area May 2022 and Change from May 2021 Labor Force: 1,132,871 +24,699 Employed: 1,100,438 +43,723 Unemployed: 32,433 -19,024 Unemployment Rate: 2.9% -1.7 Total Non-Farm Jobs: 1,123,200 +28,300
The 2.9% May unemployment rate for the Columbus metro remains one of the lowest in more than 30 years, and all metrics were better than they were a year ago.
Overall Metro Area May 2022 and Change from February 2020 (Pre-Pandemic) Labor Force: 1,132,871 +12,067 Employed: 1,100,438 +23,598 Unemployed: 32,433 -11,531 Unemployment Rate: 2.9% -1.0 Total Non-Farm Jobs: 1,123,200 +11,800 The metro area has surpassed pre-pandemic data across the board.
Now let’s view the results by industry.
Mining/Logging/Construction 5/2020———–5/2021———-5/2022 43,200————45,700———47,500 This industry has fully recovered from the pandemic and continues to set new highs.
Manufacturing 5/2020———–5/2021———-5/2022 66,700———–71,900———-72,300 Although manufacturing has largely recovered from pandemic lows, it remains *well* below anytime before 2000.
Trade/Transportation/Utilities 5/2020———–5/2021———-5/2022 205,400———-221,000———238,000 This industry is at 30 year highs.
Information 5/2020———–5/2021———-5/2022 15,500———–15,600———-16,600 The industry has been in somewhat of a decline overall since the Dot.com boom of the late 1990s. It recovered most pandemic losses, but seems unlikely to do much better in the long run.
Financial Activities 5/2020———–5/2021———-5/2022 83,900———–84,500———-83,700 Financial activities jobs have declined slightly since recovering its pandemic losses.
Professional and Business Services 5/2020———–5/2021———-5/2022 166,500———-179,600———178,200 As with the financial activities industry, this industry initially recovered from the pandemic, but has stagnated a bit since then.
Education and Health Services 5/2020———–5/2021———-5/2022 145,600———-159,700———158,800 These industries have been somewhat stagnant as well since around October, 2020.
Leisure and Hospitality 5/2020———–5/2021———-5/2022 69,000———-97,200———-107,600 This industry was arguably hit the hardest of any during the pandemic crash, but have recovered fairly strongly since then. However, because the fall was so great, it has not completely come back to date.
Other Services 5/2020———–5/2021———-5/2022 32,800———–39,800———-41,500 This industry is on track for full recovery by late summer.
Government 5/2020———–5/2021———-5/2022 177,500———-179,900———179,000 Government jobs remain below where they were pre-pandemic, and have shown little movement either way.
Overall, the metro has recovered from the pandemic and most metrics are generally positive, but not all industries are doing equally well. There remains no sign of any impending downturn.
The Bureau of Labor Statistics, the source of this data, is useful for local employment data for any metro area in the United States.
In this latest edition of the Housing Market Update May 2022, we see that home prices continue to reach record levels in the metro area, and houses are selling faster than ever. With rising mortgage interest rates, will the region eventually see a slowdown?
Note: LSD= Local School District, CSD= City School District. In both cases, school district boundaries differ from city boundaries.
Top 15 Most Expensive Locations By Median Sales Price in May 2022 1. New Albany: $789,900 2. New Albany Plain LSD: $650,000 3. Big Walnut LSD: $572,127 4. Powell: $565,000 5. Upper Arlington CSD: $558,000 6. Dublin: $555,000 7. Grandview Heights: $545,000 8. Granville CSD: $530,000 9. Dublin CSD: $515,000 10. Olentangy LSD: $505,000 11. Buckeye Valley LSD: $495,000 12. Worthington: $481,000 13. German Village: $475,000 14. Bexley: $470,000 15. Pickerington: $444,000 16. Canal Winchester CSD: $430,000 Several suburbs now have median prices at or above half a million dollars, with several others not too far behind.
Top 15 Least Expensive Locations by Median Sales Price in May 2022 1. Lancaster CSD: $175,000 2. Miami Trace LSD: $180,000 3. Newark CSD: $184,000 4. Circleville CSD: $187,500 5. Whitehall CSD: $205,000 6. Jefferson LSD: $220,000 7. London CSD: $227,450 8. Groveport Madison LSD: $243,000 9. Hamilton LSD: $256,700 10. Obetz: $256,700 11. Columbus CSD: $257,500 12. Columbus: $277,750 13. Reynoldsburg CSD: $280,500 14. Minerva Park: $291,500 15. South Western CSD: $295,450 On the opposite side of things, even some of the cheapest markets are approaching the $300K mark. Columbus itself remains *relatively* affordable in comparison to the market overall.
Overall Market Median Sales Price in May: $303,460 Based on the 10 Columbus Metro Area counties.
Top 15 Locations with the Highest Median Sales Price % Growth Between May 2021 and May 2022 1. Canal Winchester CSD: +65.4% 2. Big Walnut LSD: +50.4% 3. Whitehall: +48.6% 4. Northridge LSD: +42.6% 5. Groveport Madison LSD: +39.0% 6. Grandview Heights: +38.3% 7. Granville CSD: +31.7% 8. Gahanna: +27.6% 9. Teays Valley LSD: +26.4% 10. Pataskala: +26.3% 11. Pickerington: +25.1% 12. Downtown: +24.3% 13. Johnstown-Monroe LSD: +23.5% 14. Powell: +22.8% 15. Sunbury: +22.5%
Top 15 Locations with the Lowest Median Sales Price % Growth Between May 2021 and May 2022 1. German Village: -24.6% 2. Miami Trace LSD: -19.3% 3. Obetz: -14.0% 4. Bexley: -5.5% 5. Delaware CSD: -4.7% 6. New Albany: -2.5% 7. Minerva Park: -2.2% 8. Lancaster CSD: -0.6% 9. Newark CSD: -0.1% 10. Jonathan Alder LSD: 0.0% 11. Short North: 0.5% 12. London CSD: +1.1% 13. Westerville: +2.4% 14. Circleville CSD: +3.0% 15. Beechwold/Clintonville: +3.5% So far, the “Intel Effect” has yet to kick in in places like Newark and some Northeast Side communities. Only Johnstown is seeing a significant price increase. This may have to do with some of these places already being overvalued, especially New Albany.
Overall Market Median Sales Price % Change May 2022 vs. May 2021:+14.5% Based on 53 metro market locations.
Top 10 Locations with the Most New Listings in May 2022 1. Columbus: 1,337 2. Columbus CSD: 898 3. Olentangy LSD: 214 4. South Western CSD: 210 5. Hilliard CSD: 162 6. Dublin CSD: 146 7. Westerville CSD: 139 8. Worthington CSD: 94 9. Dublin: 90 10. Lancaster CSD: 88
Top 10 Locations with the Fewest New Listings in May 2022 1. Valleyview: 0 2. Lithopolis: 2 3. Minerva Park: 5 4. Obetz: 6 5. Jefferson LSD: 12 6. Northridge LSD: 14 7. Johnstown-Monroe LSD: 15 8. Miami Trace LSD: 18 9. Sunbury: 20 10. Granville CSD: 20 11. German Village: 21
Total New Listings in the Columbus Metro in May 2022:+3,362 Overall Metro New Listings % Change May 2022 vs May 2021:-3.1% New listings fell in May year-over-year even though the late spring is often a time when more homes go onto the market. Franklin County had one of the largest declines in inventory, dropping about 6.9%.
Top 10 Fastest-Selling Locations by # of Days Homes Remain on the Market Before Sale in May 2022 1. Grandview Heights: 3 2. Canal Winchester CSD: 4 3. Hilliard: 4 4. Miami Trace LSD: 4 5. Minerva Park: 4 6. Westerville: 4 7. Westerville CSD: 4 8. German Village: 5 9. Hilliard CSD: 5 10. Marsyville CSD: 5 11. Powell: 5 12. Reynoldsburg CSD: 5 13. Sunbury: 5 14. Worthington: 5 15. Worthington CSD: 5 16. Bexley: 6 17. Dublin: 6 18. Groveport Madison LSD: 6 19. Jefferson LSD: 6 20. Pickerington: 6 21. Hamilton LSD: 7 22. Lancaster CSD: 7 23. Newark CSD: 7 24. Pickerington LSD: 7 25. Upper Arlington CSD: 7 26. Whitehall: 7 27. Beechwold/Clintonville: 8 28. Gahanna: 8 29. Delaware CSD: 9 30. South Western CSD: 9 31. Blacklick: 10 32. Columbus: 10 33. Johnstown-Monroe LSD: 10 34. Gahanna Jefferson LSD: 12 35. Dublin CSD: 13 36. Grove City: 13
The “Top 10” became the Top 36 just given that most of the local markets are selling so similarly quickly. There is relatively little spread between the fastest and slowest-selling markets, with some obvious exceptions.
Top 10 Slowest-Selling Locations by # of Days Homes Remain on the Market Before Sale in May 2022 1. Northridge LSD: 84 2. Downtown: 75 3. New Albany: 29 4. Buckeye Valley LSD: 28 5. Granville CSD: 27 6. Teays Valley LSD: 27 7. London CSD: 26 8. Short North: 25 9. Jonathan Alder LSD: 22 10. Big Walnut LSD: 20 11. New Albany LSD: 19 12. Obetz: 19 13. Pataskala: 19
Top 10 Locations with the Greatest % Decline of # of Days on the Market Before Sale May 2022 vs. May 2021 1. Bexley: -76.0% 2. Jefferson LSD: -73.9% 3. Lancaster CSD: -72.0% 4. Dublin: -68.4% 5. Johnstown-Monroe LSD: -64.3% 6. Grandview Heights: -62.5% 7. Reynoldsburg CSD: -58.3% 8. Short North: -51.0% 9. Hamilton LSD: -50.0% 10. Hilliard: -50.0% 11. Westerville: -50.0% 12. Hilliard CSD: -44.4%
Top 10 Locations with the Lowest % Decline of # of Days on the Market Before Sale May 2022 vs. May 2021 1. Northridge LSD: +1,300.0% 2. Jonathan Alder LSD: +633.3% 3. Valleyview: +400.0% 4. London CSD: +188.9% 5. New Albany: +141.7% 6. New Albany LSD: +111.1% 7. Downtown: +92.3% 8. Granville CSD: +80.0% 9. Circleville CSD: +77.8% 10. Teays Valley LSD: +68.8%
% Change for the # of Days Homes Remain on the Market Before Sale Across the Metro Overall: 15.6 Overall Metro Days on Market % Change May 2022 vs May 2021: -1.3%
Columbus Realtors offers monthly housing reports and other data back several years.