The Impact of Immigration on the Housing Market
For this link, you can zoom to county level and see the housing impact of immigration. Basically, the more immigration, the greater the impact.

The Impact of Immigration on the Housing Market
For this link, you can zoom to county level and see the housing impact of immigration. Basically, the more immigration, the greater the impact.
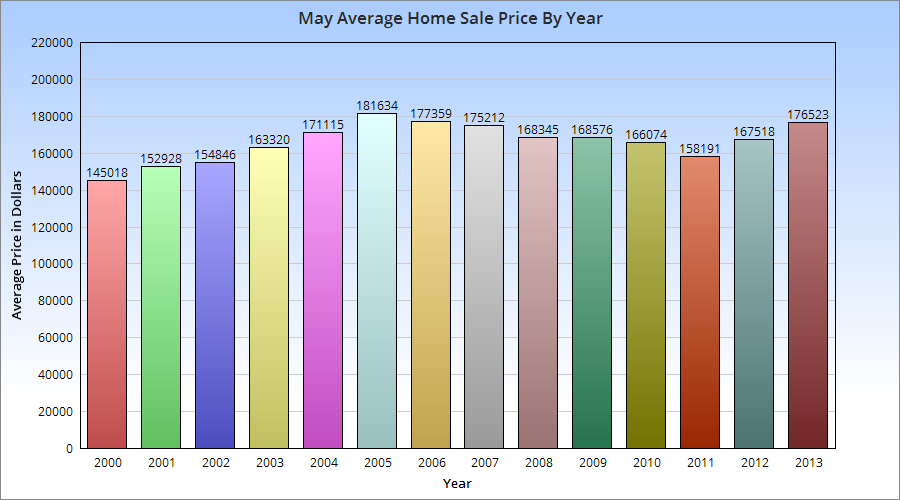
May home sales set a record for the month.
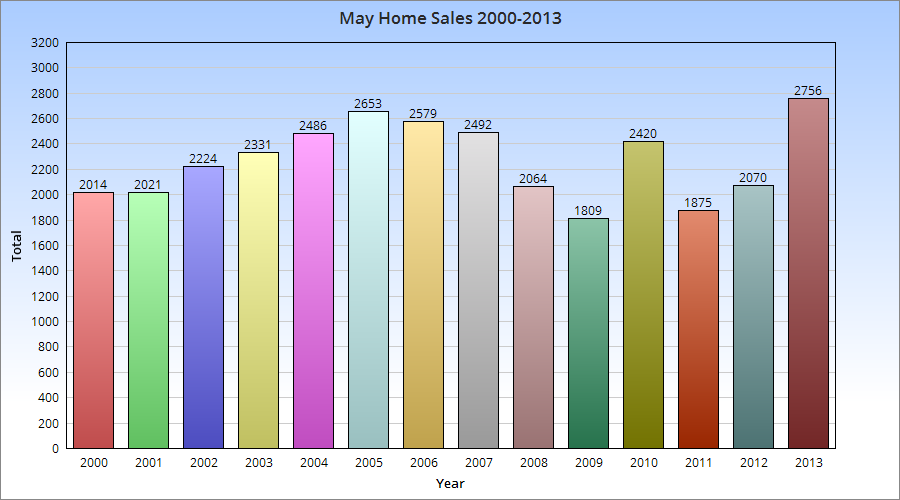
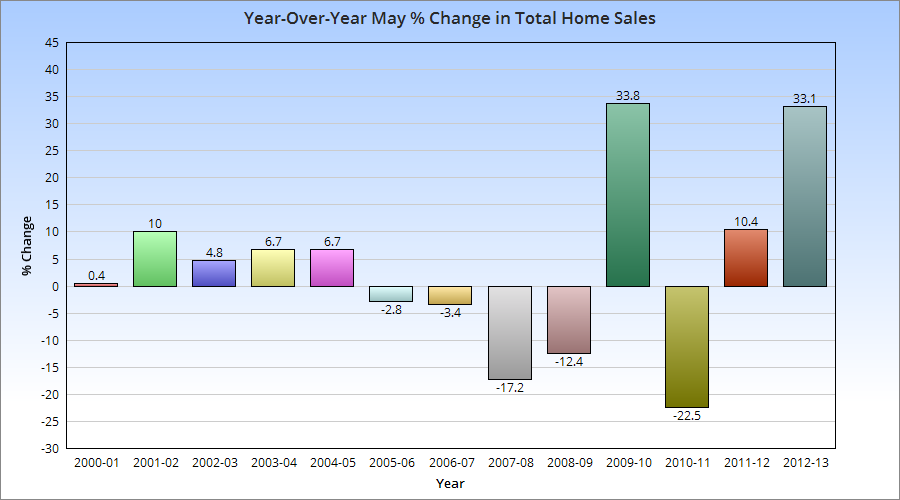
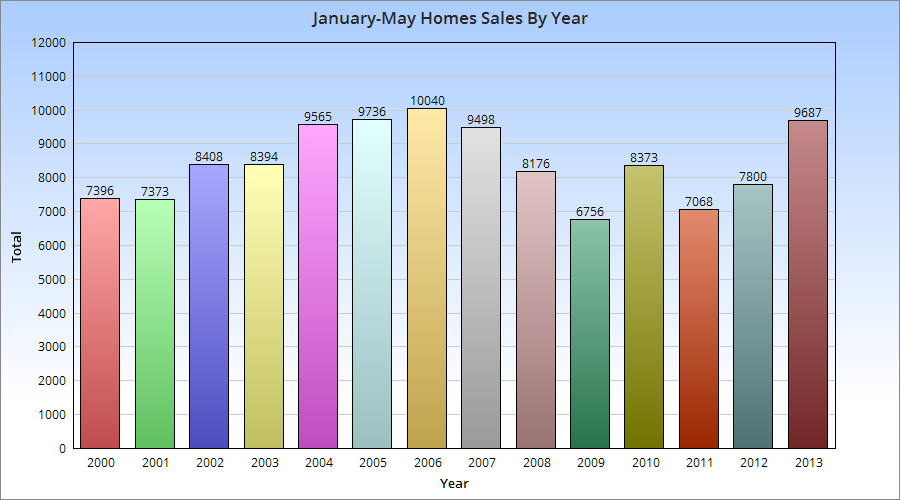
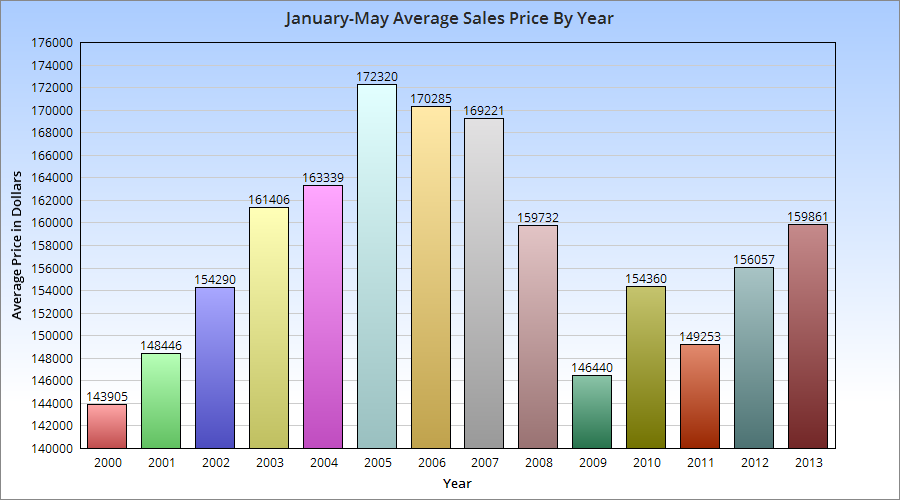
Through May, total sales are also way up, and were the 2nd highest for the 2000-2013 period.
The average May home sales price was the highest since 2006.
The average January-May sales price was also up.
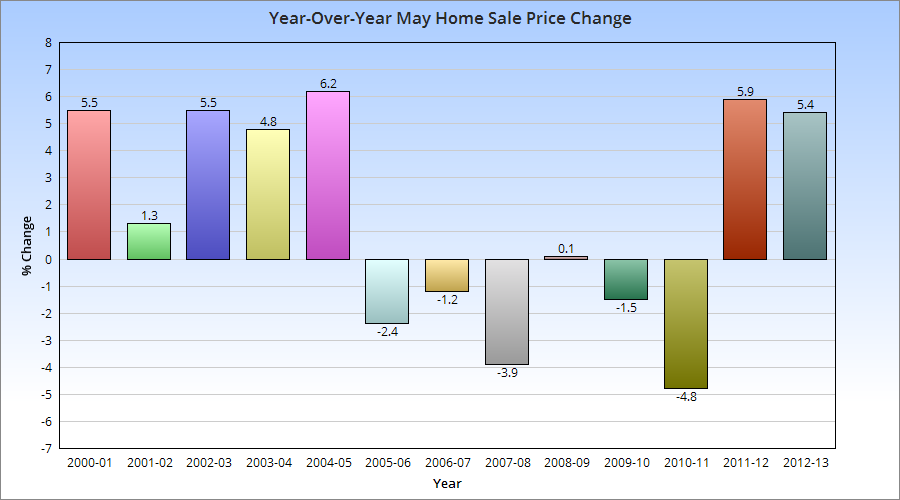
To me, all this shows is that after the Recession’s downturn, housing in the Columbus area is seeing a strong recovery. In some cases, the recovery is already surpassing the market that existed pre-Recession.

Just a few May project updates. These represent only a small fraction of what’s going on in terms of local development.
Downtown
1. Neighborhood Launch’s expansion with a pair of new 5-story buildings containing 260 apartments continues. Located on E. Long Street, the buildings’ foundation work has been mostly completed and elevator shafts and the first steel frames are now going up, which means construction should really get going now. The timetable for these to be complete is late fall or winter.
2. Over at Columbus Commons, the Highpoint 300-unit residential project continues and at least one of the buildings is now reaching towards its 6th and final floor.
3. The Liberty Place 200+ unit residential expansion in the Brewery District is getting closer to being done with the external work, as brick and finishes are going on.
4. The mess that is the reconstruction of 670/71 also continues, but we’re still a year or so away from that being done… before the next phase begins closer to the 70/71 section.
5. Work continues on the restoration of the LeVeque Tower, but more details have emerged. Up to 70 residential units will be created in the tower section, along with lower floors having a new boutique hotel and office space. The lobby will be restored to its original 2-story look, and the entrance outside will get new marble, planters and lighting. The terra cotta exterior of the building will take up to 5 more years to complete, as 80 years of grime and damage have to be fixed. The other improvements should be done late this year or early next year.
6. Columbia Gas’ new HQ building in the Arena District has reached it’s maximum 6-story height with steel, but no exterior work is done yet.
7. The Flats II 120-unit residential building next door to that project is seeing exterior work being done and should be done later this summer or early fall. Reports have been coming out showing this and other residential projects nearby have extremely high rental interest already.
8. 600 Goodale, the 5-story 174-unit residential building is seeing exterior work now and should be done by the end of summer or fall.
Short North
1. Aston Place, a new residential project on Hubbard Avenue, is moving along and the elevator shaft is just about done, so steel should be going up soon.
2. The Hubbard project continues to the east. The 5-story, 68-unit residential building is all framed out and exterior work is beginning. The adjoining parking garage is complete and the 4 concealing townhomes should begin construction soon.
3. The Out of the Closet development at 5th and High is well underway, now completely framed out.
Downtown, more than any other neighborhood, has seen major changes over the years. This edition of Before and After Downtown looks at just a few locations around the neighborhood that have seen massive transformation over the years. Some of these photos come from the Historic Building Database.
Before: The Central German School at 400 S. 4th Street in 1916
After: 2017
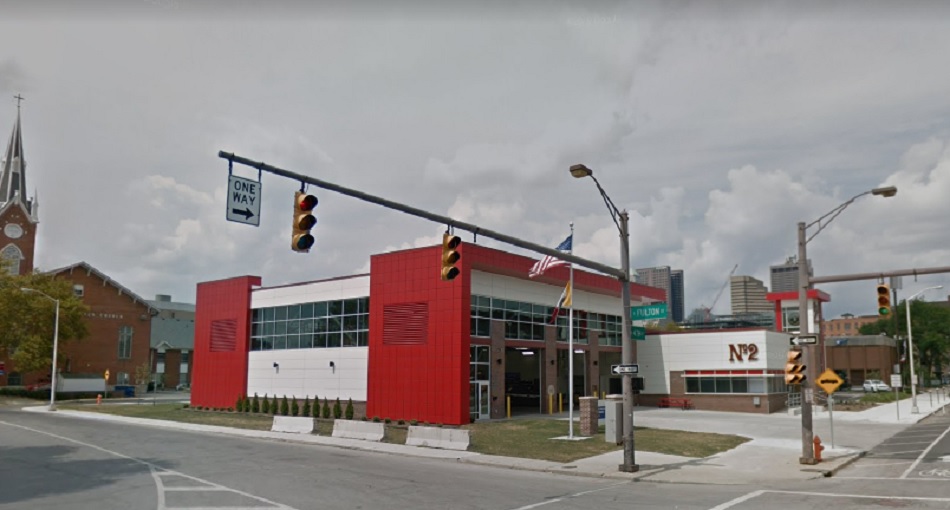
The school was originally opened in December, 1863. In 1920, the school began an expansion and opened as an institution for physically challenged children in March, 1922. The building met its demise in December, 1967 to clear the right of way for I-70/I-71. The highway split the northern sections of German Village off from the rest of the neighborhood. Eventually, almost every historic building left to the north of the highway was demolished. One of the few still remaining is the nearby Trinity Lutheran Church at the corner of S. 3rd and E. Fulton Street, which was dedicated on December 20, 1857.
Before: Southern Theater in 1905
After: 2018
The Southern Theater came about out of the ashes of it’s predecessors. Fires had destroyed 5 separate Columbus theaters between 1889 and 1893, and with the sudden absence of major city theaters, the concept of the Southern Theater was born. The theater opened on September 21, 1896 and has changed very little over the years. Today, it is one of the oldest surviving theaters in Ohio. Very few other buildings can be seen in the old photo, but the 1895 building next door on High and Noble also survives.
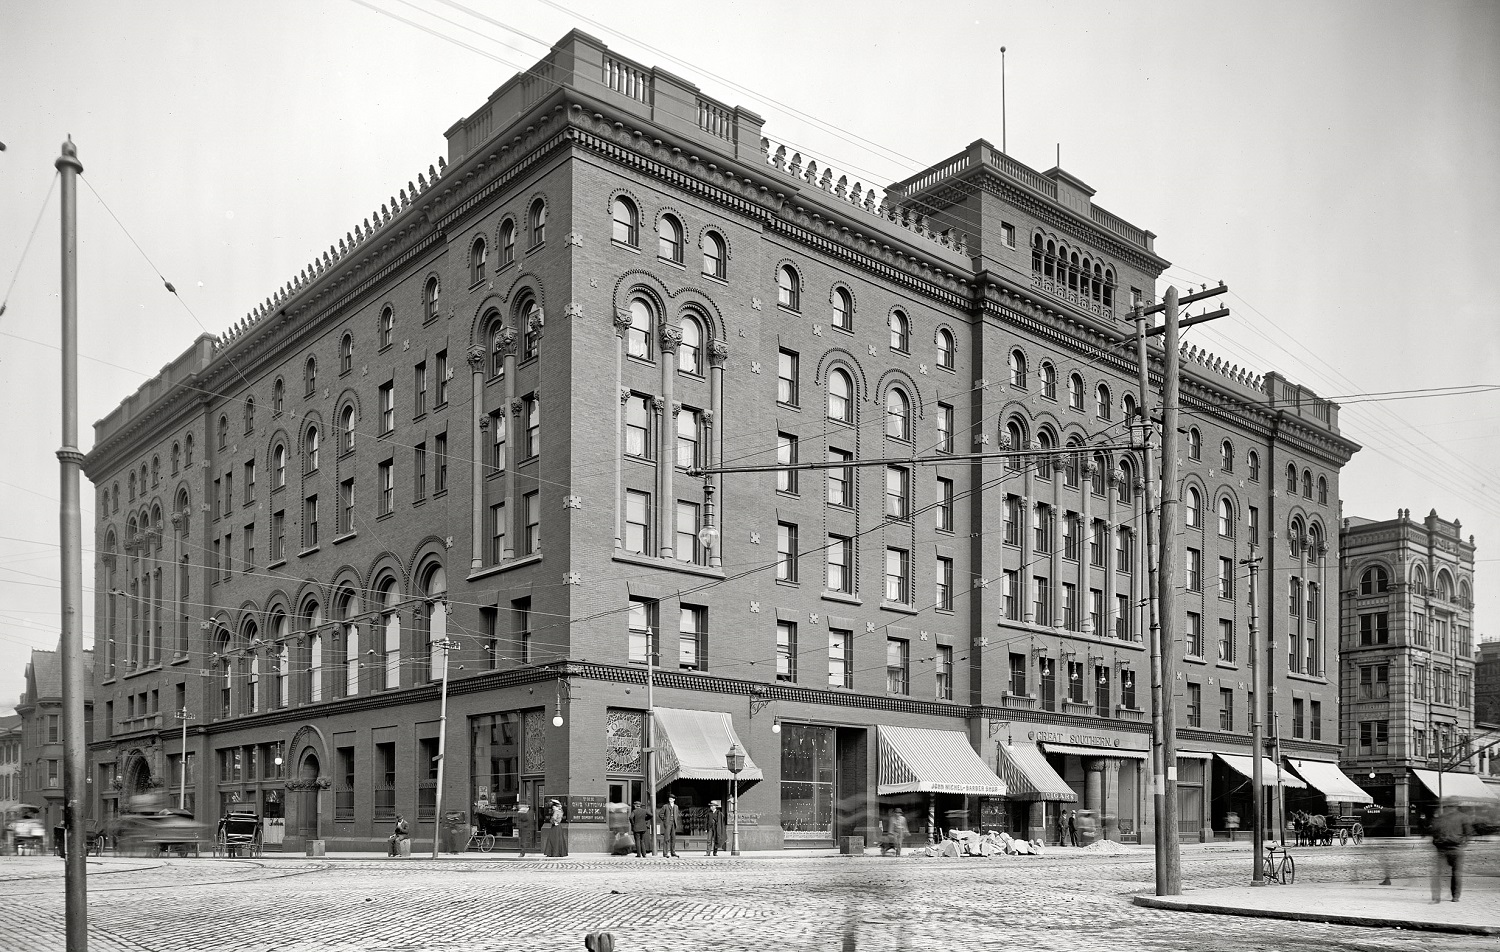
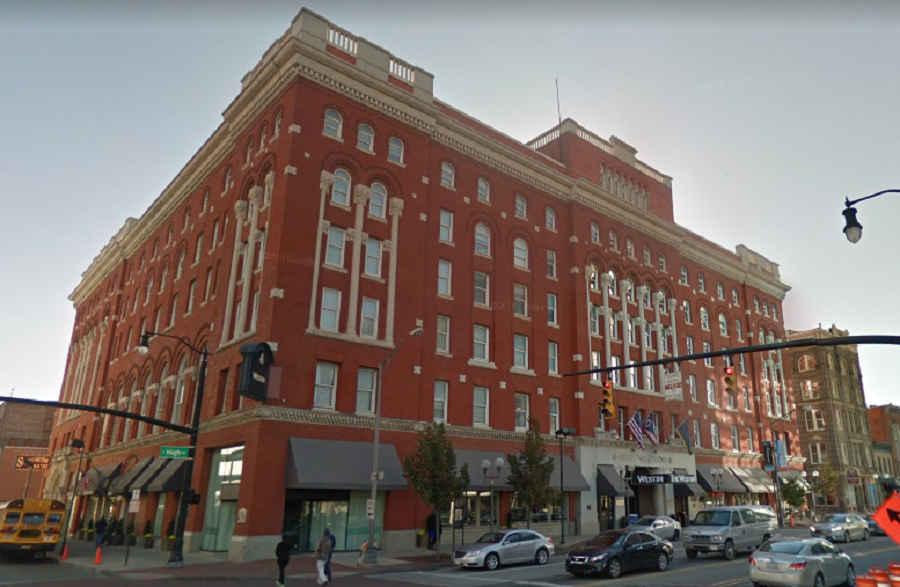
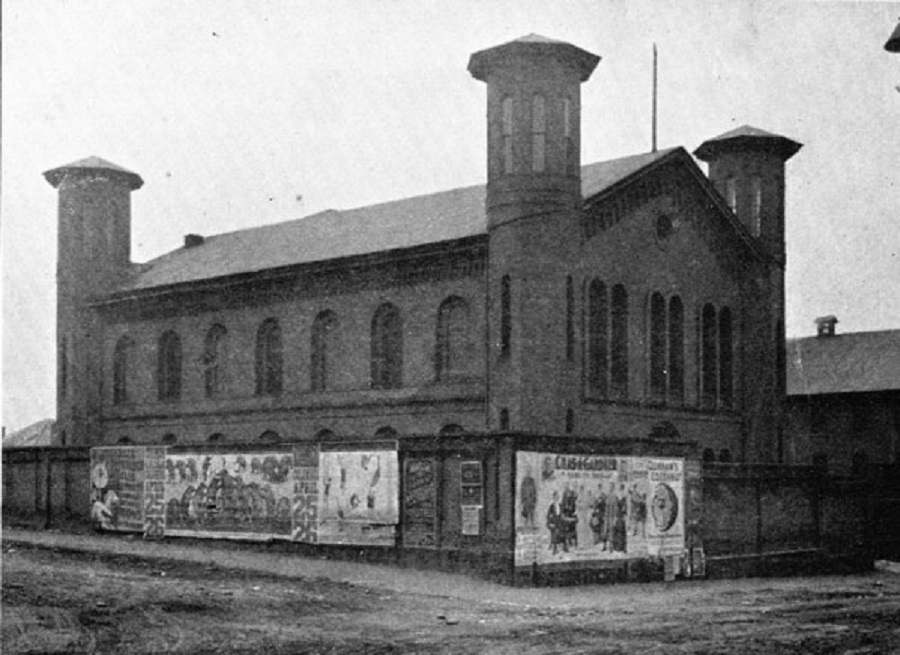
Before: The Columbus Auditorium at 570 N. Front Street in 1901
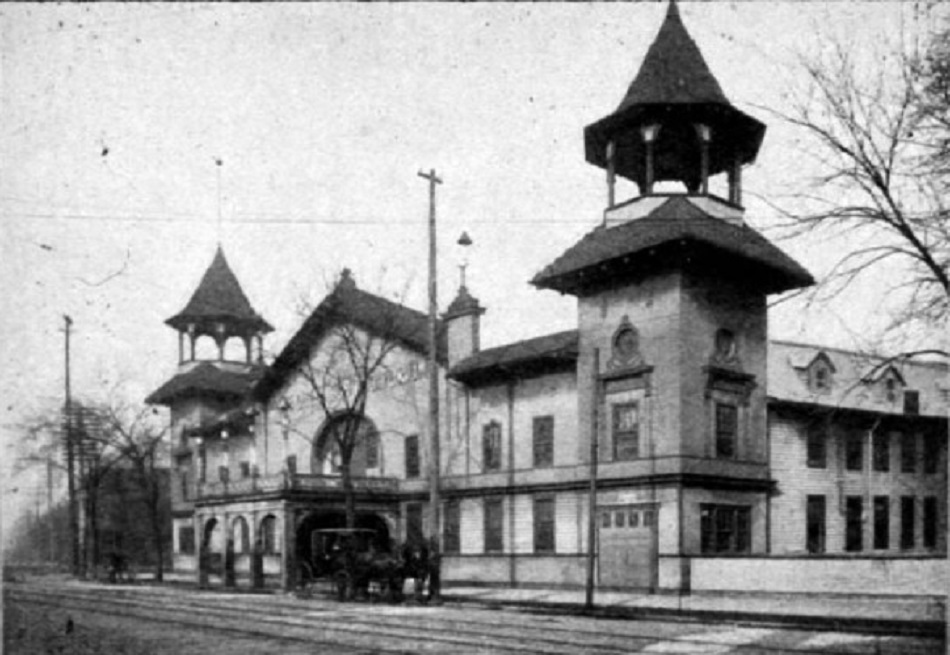
After: 2018
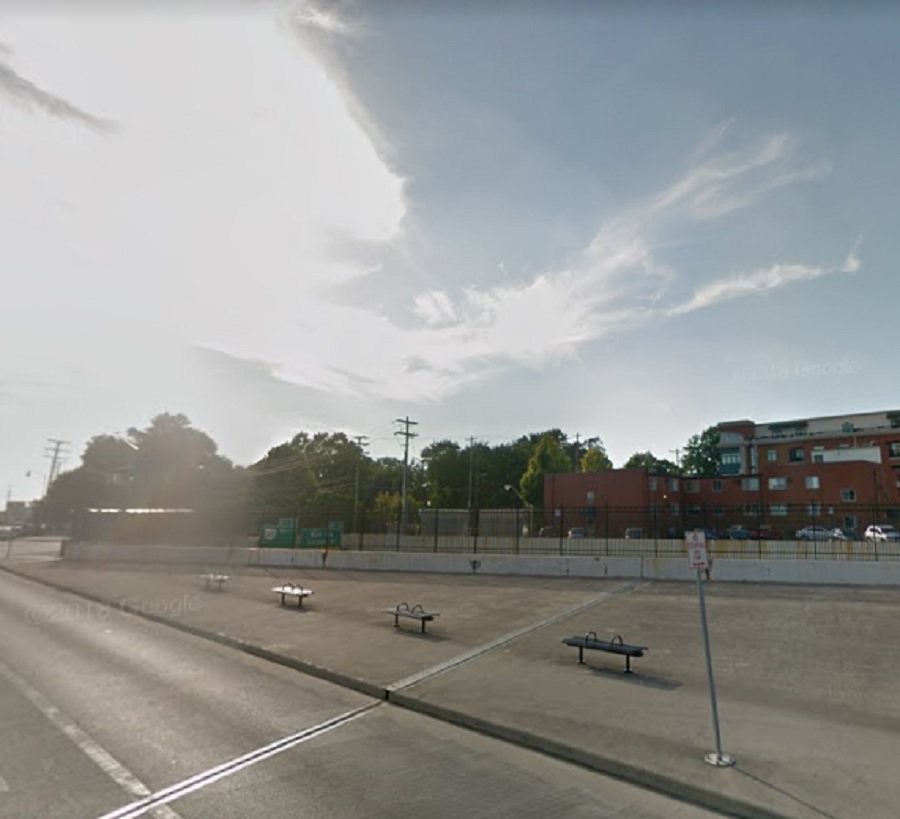
Opened on March 17, 1885, the Park Roller Skating Rink was a large, beautiful building across from where Nationwide Arena sits today. Originally for amusement, the rink only lasted a bit over a decade before being bought and remodeled to become the Columbus Auditorium in 1897. It’s large expanse of flat roof doomed the building however. After more than 15″ of snow fell on the city from February 16-18, 1910, the roof simply could not handle the load, and collapsed on the 18th. The building was deemed a total loss and was torn down not long after.
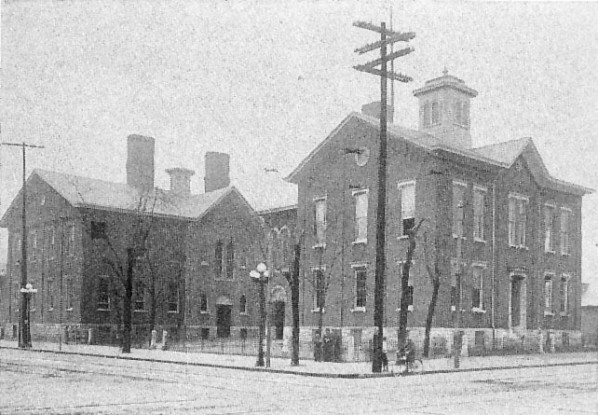
Before: The Ohio State Arsenal building at 139 W. Main Street in 1898
After: 2017
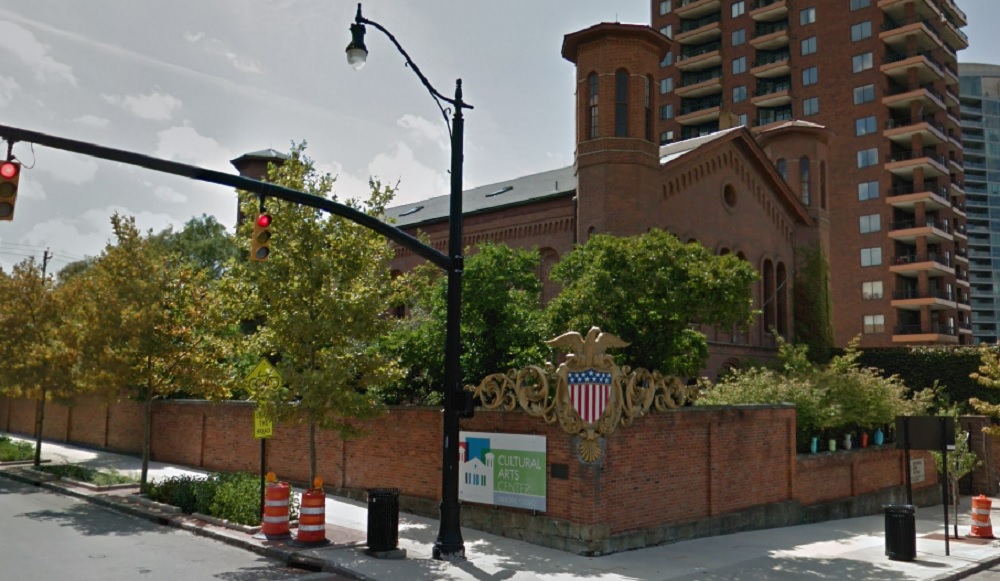
The Ohio State Arsenal building at 139 W. Main Street, seems to have a bit of disagreement as to when it was actually built (1861 vs. 1863), but regardless, it was a Civil War era arsenal that was used for this purpose for well over 100 years. It was put on the National Register of Historic Places in 1974, and became a cultural arts center in 1978, which it remains so to this day.
I posted the 2012 city estimates from the US Census yesterday. Within them may be an interesting trend that has long-term implications for Columbus and other cities, so today we’re going to go over 2012 urban population trends, and see how they compare.
A lot of the talk in the news in recent years has been how urban core cities are seeing a comeback of sorts. I’ve made mention of it several times, myself, with hard data located on the Demographics and Population part of this site. However, there is some disagreement between urban proponents and suburban proponents about what’s really going on, and that disagreement seems to focus mostly around if the city is growing faster than the suburbs, and if so, if that trend can be sustained.
Looking over the estimates, I noticed something that may support the urban back-to-the-city argument, at least in Columbus. What I noticed was that those villages/towns/cities that were growing tended to be clustered closer to the urban core of the metro than those that were losing population.
I first gathered the data on the Columbus metro area’s 99 incorporated places, ranging in population from 36 on up to Columbus’ 809,798. I then measured the distance between Columbus’ Downtown center and the center of all 99 places. I then broke them up into increments of about 5 miles each. Here is some of what I found.
Average Total Population Growth by Place 2010-2012 by Distance from Columbus’ Center
0-4.9 Miles: 3,962.8
5-9.9 Miles: 438.4
10-14.9 Miles: 342.8
15-19.9 Miles: 26.5
20-24.9 Miles: 148.9
25+ Miles: 10.5
What this says, is that for the most part, the closer a place is to the center, the more total average growth it’s had since 2010. While the 0-4.9 mile distance is somewhat skewed because it includes Columbus’ growth, there is also a significant drop-off beyond 15 miles from the center.
Next, I looked at all the places that saw either 0 population change or a loss during the 2010-2012 period. Again, it was separated by the distance from Columbus’ center.
0-4.9 Miles: 0 of 6, or 0.0%
5-9.9 Miles: 0 of 12, or 0.0%
10-14.9 Miles: 1 of 12, or 8.3%
15-19.9 Miles: 2 of 8, or 25.0%
20-24.9 Miles: 2 of 10, or 20.0%
25+ Miles: 21 of 51, or 41.2%
What this shows is that the further the distance away from the center, in general, the more places there were that were stagnant or lost population since 2010.
Finally, I looked at the top 15 total population increases of all places from 2010-2012, as well as their distance from Columbus’ center.
1. Columbus (obviously): +22,765- 0 Miles
2. Hilliard: +2,129- 9.9 Miles
3. Grove City: +1,257- 7.4 Miles
4. Delaware: +1,172- 23.6 Miles
5. Dublin: +1,155- 11.3 Miles
6. Westerville: +953- 12.0 Miles
7. New Albany: +783- 13.0 Miles
8. Gahanna: +580- 7.5 Miles
9. Powell: +460- 14.2 Miles
10. Reynoldsburg: +454- 9.9 Miles
11. Upper Arlington: +432- 4.1 Miles
12. Pickerington: +401- 14.1 Miles
13. Grandview Heights: +374- 2.6 Miles
14. Whitehall: +341- 6.0 Miles
15. Canal Winchester: +292- 12.7 Miles
12 of the 15 are within Franklin County. Another 2 (Pickerington and Powell) are near the Franklin County border. Only Delaware is beyond 15 miles from Columbus’ center.
So do these numbers show a real trend? Maybe. Some of the questions are: Do 2 years of data support a real trend or just a blip? Is this really an urban movement or a rural decline… or both? Is this a new/recent trend or have the numbers been changing? Those questions and others need to be answered before making a definitive statement, but if nothing else, they are a positive indication that Columbus and it’s immediate surroundings remain the metro’s (and Ohio’s) strongest population draw.