Columbus Housing Trends


I posted a graph recently showing housing permits for Franklin County to show how construction was trending. Today, I found more long-term data for both the city and county that continue to show some interesting Columbus housing trends. All data comes from the Building Permits Survey.

First, let’s look at just the city of Columbus.
Columbus housing trends total housing units
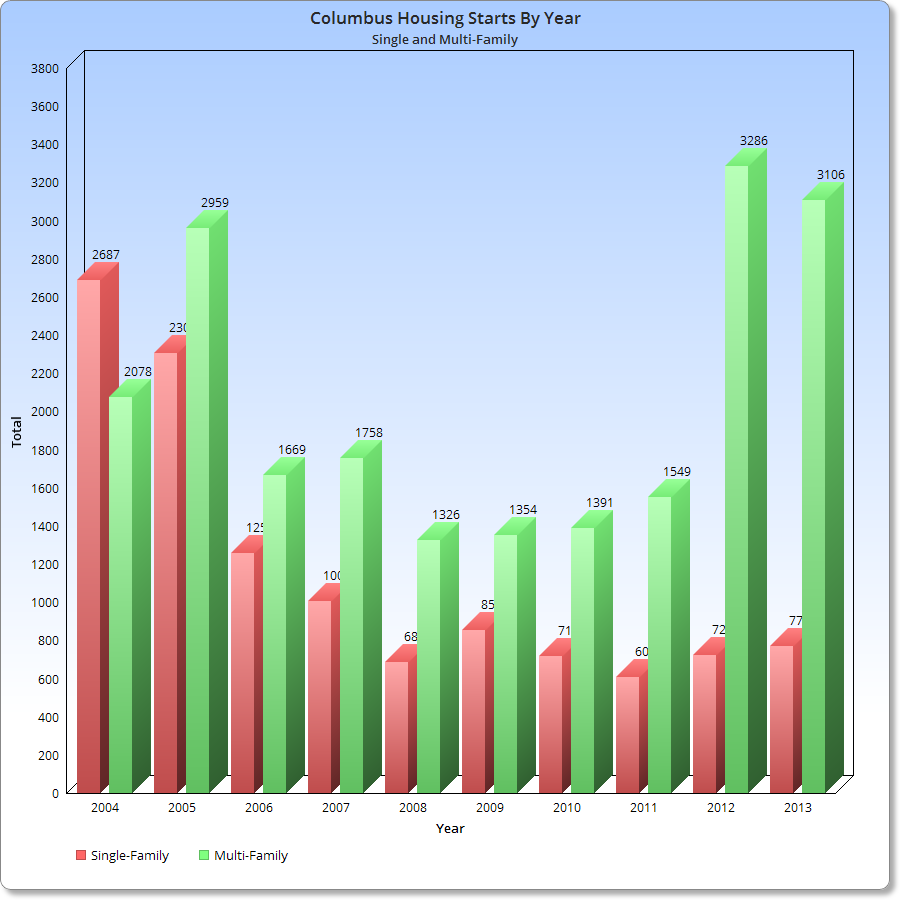
The chart above goes back through the mid-1990s. The first thing to notice is the housing boom from 1999-2002. Both single-family and multi-family construction was booming. The very good economic conditions, or seemingly good ones, during the 1999-2000 period is probably most responsible for this. What’s most interesting is that the boom seemed to last through at least part of the mild recession experienced in 2001-2002. After that, housing of both types started to decline through the late 2000s. This shows that construction in the city began to decline as early as 2002-2003, before the peak of the general housing boom in the mid-2000s.

Another interesting fact is at the end of the period. Multi-family units have recovered and are back in boom territory. This boom, however, is much different than the one that occurred more than a decade ago, as shown by the below chart.
Columbus housing trends housing unit type
During the 1999-2002 housing boom, multi-family housing averaged 59.3% of all the units constructed. In the current boom, which began in 2012, multi-family housing has averaged 82.1% of all the units constructed. The average difference between the types 1999-2002 was just 18.6 points. In the current boom, the difference is an amazing 64.2 points! In that regard, there really is no comparison between the housing boom a decade ago and the current one. Multi-family construction is in MUCH higher relative demand now than it was at any time in the last 17-18 years, including during the last housing boom.

But what does this tell us about where the housing is actually being constructed? Well, for that, we have to look at the entirety of Franklin County. Is the county also seeing a similar multi-family boom, or has single-family construction recovered there more than in the city?
Columbus housing trends Franklin County units
This chart, in some aspects, is the opposite of the one for the city. While in the city, multi-family units consistently outnumbered single-family, the opposite is true for the county as a whole. This is likely because the county takes into account all the suburban areas, most of which are dominated by single-family housing. In only a few instances did multi-family housing units outnumber single-family before 2010. After 2010, it’s clear that the multi-family boom is hitting the rest of the county and not just Columbus itself. This may actually represent an even greater shift in housing construction.

Here’s the % of total chart for the county.
Columbus housing trends Franklin County housing type
So it’s also clear that the county is seeing most of its construction in recent years be multi-family units.

But this still doesn’t tell us if most of Franklin County’s housing construction is occurring in the city or in the suburbs. The easiest way to tell is to take the city totals and find out the % of total to the overall county.
Columbus housing trends Columbus percent of Franklin County units
Not much can be taken from this chart, however. Columbus encompasses the largest part of Franklin County by far, so it has always included most of the county’s construction. Perhaps a better way to look at it would be to measure the city’s total against the overall metro share, but that’s for another day.


Residential Construction Trends of Columbus in One Graph


We’ve been hearing a lot the last few years about how residential construction has largely turned toward the rental variety, and no more so than in the urban areas. I have tried to document the level of activity in the city in my development page, but it doesn’t quite show what’s going on in the city overall. I did a little research and found some surprising realities that fully support the rental boom. The residential construction trends of Columbus have changed significantly in recent years.

Here is a graph of annual housing construction permits from 2004-2013 broken down by multi-family and single-family types.

The chart above is based on the # of units, not the number of overall projects.

So what do the numbers say? Well, it raises some interesting questions. First, was the amount of single-family home construction on the decline before 2004 given the downward trend from that year through 2005? And was multi-family construction on the rise during the same period? Did the recession merely interrupt a trend that began more than a decade ago and resurfaced strongly in recent years? It’s hard to say for sure as I don’t have information before 2004, but regardless, it is clear that multi-family construction is the preferred residential preference right now by builders. Single-family home construction, however, has remained steady and well below its previous peak of the last decade.

This continued low level of single-family construction has likely contributed to the fact that area sales in that market have been down for several months now due to a lack of inventory. Prices, however, have risen.


Housing Market Update February 2014


housing market update February 2014 Columbus, Ohio

Unfortunately, I have been unable to update this site for about a month, but I am back now and have quite a bit to add. First, I have the numbers for the local Housing Market Update February 2014. Due to changes in the way the numbers were gotten, January’s were not available. I still do them for 21 major areas of Franklin County, however, and here they are. As always, the data is from Columbus Realtors.

Top 10 February 2014 Sales Totals
1. Columbus: 535
2. Grove City: 39
3. Westerville: 36
4. Upper Arlington: 33
5. Dublin: 31
6. Hilliard: 30
7. Reynoldsburg: 29
8. Clintonville: 28
9. Gahanna: 23
10. Downtown: 14

Top 10 February 2014 Sales Increases over February 2013
1. Obetz: +200.0%
2. Westerville: +38.5%
3. Grove City: +14.7%
4. German Village: +10.0%
5. Hilliard: +7.1%
6. Gahanna: +0.0%
7. New Albany: +0.0%
8. Upper Arlington: +0.0%
9. Whitehall: +0.0%
10. Downtown: -6.7%

Top 10 Year-to-Date Sales Through February 2014
1. Columbus: 1,076
2. Dublin: 72
3. Grove City: 65
4. Clintonville: 62
5. Reynoldsburg: 59
6. Westerville: 59
7. Upper Arlington: 55
8. Hilliard: 54
9. Gahanna: 40
10. Canal Winchester: 29

Top 10 Year-to-Date Increases Through February 2014 Over 2013
1. Obetz: +300.0%
2. Pataskala: +20.8%
3. Worthington: +8.0%
4. German Village: +6.7%
5. Reynoldsburg: +3.5%
6. Grove City: +3.2%
7. Westerville: -1.7%
8. Hilliard: -1.8%
9. Clintonville: -6.1%
10. Columbus: -6.8%

Average Sales February 2014
Urban: 60.1
Suburban: 22.9
Urban without Columbus: 12.6

Average % Change February 2014 vs. February 2013
Urban: -1.1%
Suburban: -7.1%
Urban without Columbus: -0.2%

Average YTD Sales Through February 2014
Urban: 120
Suburban: 45.1
Urban without Columbus: 24.4

Average YTD % Change YTD Through February 2014
Urban: +11.8%
Suburban: -9.4%
Urban without Columbus: +13.7%

Top 10 Average Sales Price February 2014
1. New Albany: $641,524
2. Bexley: $460,307
3. Upper Arlington: $378,852
4. Dublin: $334,967
5. Grandview: $318,667
6. Downtown: $302,720
7. German Village: $232,014
8. Worthington: $227,422
9. Westerville: $209,149
10. Hilliard: $199,724

Top 10 Average Sales Price % Change February 2014 vs. February 2013
1. Grandview: +68.6%
2. Pataskala: +47.1%
3. Upper Arlington: +46.5%
4. Bexley: +46.1%
5. Pickerington: +28.6%
6. Westerville: +25.9%
7. Obetz: +25.0%
8. Reynoldsburg: +19.9%
9. Canal Winchester: +17.6%
10. Hilliard: +13.1%

Top 10 Average Sales Prices YTD Through February 2014
1. New Albany: $515,036
2. Bexley: $418,680
3. Upper Arlington: $343,026
4. Dublin: $326,231
5. Downtown: $314,042
6. German Village: $309,343
7. Grandview: $251,136
8. Worthington: $231,133
9. Westerville: $205,636
10. Hilliard: $200,965

Top 10 Average YTD Sales Price % Change Through February 2014 vs. 2013
1. Pataskala: +36.2%
2. Whitehall: +35.5%
3. Bexley: +31.7%
4. Grandview: +26.1%
5. German Village: +22.2%
6. Downtown: +20.0%
7. Pickerington: +18.3%
8. Westerville: +15.8%
9. Canal Winchester: +15.2%
10. Reynoldsburg: +15.1%

Average Sales Price February 2014
Urban: $228,596
Suburban: $235,812
Urban without Columbus: $239,422

Average Sales Price Change February 2014 vs. February 2013
Urban: +15.9%
Suburban: +17.1%
Urban without Columbus: +16.9%

Average Sales Price YTD
Urban: $222,639
Suburban: $220,917
Urban without Columbus: $232,886

Average Sales Price % Change YTD
Urban: +13.0%
Suburban: +13.3%
Urban without Columbus: +13.0%

Top 10 Fastest Selling Markets February 2014 (Based on Average # of Days for Listings to Sell)
1. Grandview: 39
2. Clintonville: 57
3. Obetz: 62
4. Worthington: 70
5. Pataskala: 74
6. Hilliard: 78
7. Upper Arlington: 83
8. Westerville: 88
9. Pickerington: 89
10. Columbus: 91

Top 10 Fastest Selling Markets YTD
1. Worthington: 50
2. Grandview: 58
3. Pickerington: 60
4. Clintonville: 64
5. Obetz: 64
6. Hilliard: 66
7. Whitehall: 66
8. Upper Arlington: 73
9. Gahanna: 85
10. Westerville: 87

Average # of Days Before Sale, February 2014
Urban: 86.2
Suburban: 104.4
Urban without Columbus: 85.7

Average # of Days Before Sale YTD
Urban: 81.1
Suburban: 89.1
Urban without Columbus: 80.4

Top 10 Lowest Market Housing Supplies (Based on # of Months to Sell all Listings)
1. Worthington: 1.0
2. Hilliard: 1.6
3. Upper Arlington: 1.7
4. Westerville: 1.7
5. Clintonville: 1.8
6. Gahanna: 1.9
7. German Village: 1.9
8. Grandview: 2.0
9. Obetz: 2.2
10. Bexley and Dublin: 2.4

A healthy housing supply is considered to be around 5 months. Anything less than 3 months is considered very low.

Average # of Months to Sell All Listings, February 2014
Urban: 2.3
Suburban: 2.9
Urban without Columbus: 2.3

Average % Change of Single-Family Home Sales February 2014 vs. February 2013
Urban: +15.0%
Suburban: -7.7%
Urban without Columbus: +17.0%

Average % Change of Single-Family Home Sales YTD vs. YTD 2013
Urban: +3.0%
Suburban: -10.3%
Urban without Columbus: +4.0%

Average % Change of Condo Sales February 2014 vs. February 2013
Urban: -21.0%
Suburban: +7.0%
Urban without Columbus: -21.8%

Average % Change of Condo Sales YTD vs. YTD 2013
Urban: +20.6%
Suburban: +23.7%
Urban without Columbus: +23.0%


Exurbia in the Columbus Metro


Exurbia in the Columbus metro

I hear all the time how Columbus is extremely suburban (low density) in its development. But where does it actually rank with its peers? One metric is looking at exurbia, the far outer suburban areas that are largely made up of sprawl. How does exurbia in the Columbus metro compare to other places?

I looked at metros of similar size to Columbus (1.5-2.5 million).

Metro Population Living in Exurbia, 2000
1. Nashville, TN: 23.1%
2. Austin, TX: 21.8%
3. Charlotte, NC: 16.7%
4. Orlando, FL: 14.7%
5. San Antonio, TX: 12.6%
6. Indianapolis, IN: 10.5%
7. Kansas City, KS: 9.0%
8. Cincinnati: 6.7%
9. Virginia Beach: 6.0%
10. Portland, OR: 5.8%
11. Columbus: 4.9%
12. Sacramento, CA: 4.1%
13. Las Vegas, NV: 3.1%
14. Providence, RI: 2.9%
15. Milwaukee, WI: 2.8%
16. San Jose, CA: 1.1%
17. Cleveland: 1.0%
18. Pittsburgh, PA: 0.8%

Metro Population Living in Exurbia, 2010
1. Austin, TX: 32.3%
2. Nashville, TN: 27.9%
3. Charlotte, NC: 22.7%
4. Orlando, FL: 21.7%
5. San Antonio, TX: 20.3%
6. Indianapolis: 15.8%
7. Kansas City, KS: 14.4%
8. Las Vegas, NV: 10.6%
9. Cincinnati: 8.8%
10. Columbus: 7.7%
11. Sacramento, CA: 7.7%
12. Virginia Beach, VA: 7.4%
13. Portland, OR: 6.7%
14. Milwaukee, WI: 3.3%
15. Providence, RI: 3.2%
16. Cleveland: 1.7%
17. Pittsburgh, PA: 1.1%
18. San Jose, CA: 1.1%

Metro Population Living in Exurbia Total % Change 2000-2010
1. Las Vegas, NV: +389.9%
2. Sacramento, CA: +123.5%
3. Austin, TX: +103.8%
4. San Antonio, TX: +101.6%
5. Orlando, FL: +92.0%
6. Charlotte, NC: +82.5%
7. Columbus: +78.4%
8. Kansas City, KS: +75.6%
9. Indianapolis, IN: +72.9%
10. Cleveland: +58.3%
11. Nashville, TN: +46.4%
12. Cincinnati: +38.7%
13. Portland, OR: +33.5%
14. Virginia Beach, VA: +31.2%
15. Pittsburgh, PA: +28.0%
16. Milwaukee, WI: +20.8%
17. Providence, RI: +10.3%
18. San Jose, CA: +9.0%

So what these numbers show is that Columbus is actually in the bottom half of exurban population vs. its 17 peers, but is in the top half of growth in that population. As can be imagined, a large part of this growth came before the recession.

Metro Exurban Population Growth 2000-2007
1. Las Vegas, NV: +285.2%
2. Sacramento, CA: +104.2%
3. Orlando, FL: +78.3%
4. Austin, TX: +74.2%
5. Columbus: +62.0%
6. Charlotte, NC: +58.4%
7. San Antonio, TX: +56.2%
8. Kansas City, KS: +55.4%
9. Indianapolis, IN: +46.4%
10. Nashville, TN: +30.6%
11. Portland, OR: +29.1%
12. Cleveland: +27.0%
13. Cincinnati: +26.2%
14. Virginia Beach, VA: +25.7%
15. Pittsburgh, PA: +16.5%
16. Milwaukee, WI: +13.3%
17. Providence, RI: +10.9%
18. San Jose, CA: +5.9%

Metro Exurban Population Growth 2007-2010
1. San Antonio, TX: +29.1%
2. Las Vegas, NV: +27.2%
3. Cleveland: +24.7%
4. Indianapolis, IN: +18.0%
5. Austin, TX: +17.0%
6. Charlotte, NC: +15.3%
7. Kansas City, KS: +13.7%
8. Nashville, TN: +12.1%
9. Columbus: +10.1%
10. Cincinnati: +9.9%
11. Pittsburgh, PA: +9.8%
12. Sacramento, CA: +9.5%
13. Orlando, FL: +7.7%
14. Milwaukee, WI: +6.7%
15. Virginia Beach, VA: +4.3%
16. Portland, OR: +3.3%
17. San Jose, CA: +2.9%
18. Providence, RI: -0.6%

Average Annual Rate Change Between 2000-2007 and 2007-2010
1. Cleveland: +117.1%
2. Pittsburgh, PA: +45.5%
3. San Antonio, TX: +34.8%
4. San Jose, CA: +25.0%
5. Milwaukee, WI: +22.2%
6. Indianapolis, IN: +1.8%
7. Nashville, TN: +0.0%
8. Cincinnati: -5.9%
9. Charlotte, NC: -29.4%
10. Kansas City, KS: -32.3%
11. Austin, TX: -34.1%
12. Columbus: -53.5%
13. Virginia Beach, VA: -57.6%
14. Las Vegas, NV: -60.8%
15. Portland, OR: -70.3%
16. Orlando, FL: -70.9%
17. Sacramento, CA: -71.0%
18. Providence, RI: -113.3%

So there you have it. Columbus is definitely not anywhere near the sprawl king it’s often made out to be, even within its own peer group. Outside of it, there are dozens of metros with far more.


Housing Market Update December 2013


housing market update December 2013 Columbus, Ohio

December ended a 2-month decline in home sales for the area, with overall sales up 2.5% according to the Housing Market Update December 2013 data from Columbus Realtors.

Here are the stats for the 21 major areas of Franklin County that I look at housing stats for.

Top 10 December 2013 Sales Totals
1. Columbus: 657
2. Westerville: 47
3. Dublin: 45
4. Clintonville: 42
5. Upper Arlington: 41
6. Grove City: 39
7. Reynoldsburg: 38
8. Gahanna: 31
9. Hilliard: 22
10. Pickerington: 18

Top 10 December 2013 Sales Increases over December 2012
1. Minerva Park: +200.0%
2. Obetz: +200.0%
3. Reynoldsburg: +72.7%
4. Clintonville: +55.6%
5. Gahanna: +55.0%
6. Pataskala: +27.3%
7. Dublin: +15.4%
8. German Village: +10.0%
9. Worthington: +6.3%
10. Columbus: +3.8%

Top 10 Year-to-Date Sales Through December 2013
1. Columbus: 10,267
2. Dublin: 797
3. Upper Arlington: 719
4. Clintonville: 701
5. Westerville: 630
6. Grove City: 609
7. Hilliard: 556
8. Gahanna: 526
9. Reynoldsburg: 505
10. Pickerington: 312

Top 10 Year-to-Date Increases Through December 2013 Over 2012
1. Minerva Park: +51.9%
2. Gahanna: +31.8%
3. Pataskala: +31.0%
4. Reynoldsburg: +30.8%
5. Whitehall: +27.3%
6. Clintonville: +26.3%
7. Hilliard: +23.6%
8. Whitehall: +23.4%
9. Westerville: +21.9%
10. Bexley: +21.5%

Average Sales December 2013
Urban: 74.5
Suburban: 28.2
Urban without Columbus: 14.7

Average % Change December 2013 vs. December 2012
Urban: +40.5%
Suburban: +6.4%
Urban without Columbus: +44.2%

Average YTD Sales Through December 2013
Urban: 1,177.1
Suburban: 466.5
Urban without Columbus: 268.1

Average YTD % Change YTD Through December 2013
Urban: +15.7%
Suburban: +19.4%
Urban without Columbus: +15.3%

Top 10 Average Sales Price December 2013
1. New Albany: $563,187
2. Upper Arlington: $377,943
3. Bexley: $376,592
4. Dublin: $351,279
5. Downtown: $314,583
6. German Village: $303,136
7. German Village: $271,656
8. Hilliard: $249,811
9. Worthington: $232,741
10. Clintonville: $223,250

Top 10 Average Sales Price % Change December 2013 Over December 2012
1. Whitehall: +37.3%
2. New Albany: +32.8%
3. Pataskala: +29.6%
4. Reynoldsburg: +26.3%
5. Upper Arlington: +25.8%
6. Clintonville: +25.3%
7. Bexley: +23.7%
8. Hilliard: +21.9%
9. Gahanna: +19.6%
10. Dublin: +13.1%

Top 10 Average Sales Prices YTD Through December 2013
1. New Albany: $542,634
2. Upper Arlington: $365,143
3. Bexley: $352,214
4. Dublin: $336,048
5. German Village: $298,199
6. Downtown: $287,976
7. Worthington: $248,857
8. Grandview Heights: $223,185
9. Hilliard: $217,078
10. Gahanna: $199,546

Top 10 Average YTD Sales Price % Change Through December 2013 vs. 2012
1. Whitehall: +18.9%
2. Downtown: +14.0%
3. Minerva Park: +14.0%
4. Upper Arlington: +13.8%
5. Gahanna: +12.1%
6. New Albany: +9.8%
7. Reynoldsburg: +9.6%
8. Obetz: +9.0%
9. Worthington: +7.5%
10. Bexley: +5.8%

Average Sales Price December 2013
Urban: $218,764
Suburban: $233,048
Urban without Columbus: $227,832

Average Sales Price Change December 2012 vs. December 2012
Urban: -1.6%
Suburban: +15.5%
Urban without Columbus: -2.9%

Average Sales Price YTD
Urban: $217,056
Suburban: $224,060
Urban without Columbus: $226,017

Average Sales Price % Change YTD
Urban: +5.6%
Suburban: +5.6%
Urban without Columbus: +5.7%

Top 10 Fastest Selling Markets December 2013 (Based on Average # of Days for Listings to Sell)
1. Bexley: 26
2. Obetz: 42
3. New Albany: 47
4. Hilliard: 50
5. Clintonville: 51
6. Pataskala: 57
7. Gahanna: 58
8. Upper Arlington: 58
9. Reynoldsburg: 61
10. Grove City: 63

Top 10 Fastest Selling Markets YTD
1. Worthington: 42
2. Upper Arlington: 46
3. Grandview Height: 49
4. Clintonville: 50
5. Westerville: 53
6. Hilliard: 54
7. Bexley: 57
8. Gahanna: 59
9. Dublin: 63
10. Grove City: 64

Average # of Days Before Sale, December 2013
Urban: 73.4
Suburban: 63.9
Urban without Columbus: 73.8

Average # of Days Before Sale YTD
Urban: 61.3
Suburban: 62.9
Urban without Columbus: 60.9

Top 10 Lowest Market Housing Supplies (Based on # of Months to Sell all Listings)
1. Worthington: 1.2
2. Bexley: 1.8
3. Clintonville: 1.9
4. Hilliard: 1.9
5. Upper Arlington: 1.9
6. Grandview Heights: 2.1
7. Westerville: 2.1
8. Gahanna: 2.2
9. Minerva Park: 2.2
10. German Village: 2.3

A healthy housing supply is considered to be around 5 months. Anything less than 3 months is considered very low. All of the 21 areas I looked at were below 5 months, indicating a county-wide shortage. This shortage has only deepened over the last year, with December having the lowest number of available homes in nearly 15 years.

Average # of Months to Sell All Listings, December 2013
Urban: 2.7
Suburban: 3.2
Urban without Columbus: 2.6

Average % Change of Single-Family Home Sales December 2013 vs. December 2012
Urban: +28.5%
Suburban: +14.3%
Urban without Columbus: +30.8%

Average % Change of Single-Family Home Sales YTD vs. YTD 2012
Urban: +9.8%
Suburban: +19.0%
Urban without Columbus: +8.8%

Average % Change of Condo Sales December 2013 vs. December 2012
Urban: +20.5%
Suburban: -4.2%
Urban without Columbus: +20.5%

Average % Change of Condo Sales YTD vs. YTD 2012
Urban: +29.0%
Suburban: +23.5%
Urban without Columbus: +29.9%