Columbus Crime Plummets 2010-2014


The FBI recently released full 2014 crime statistics for its Uniform Crime Reporting program, and the results show how Columbus crime plummets between 2010 and 2014.

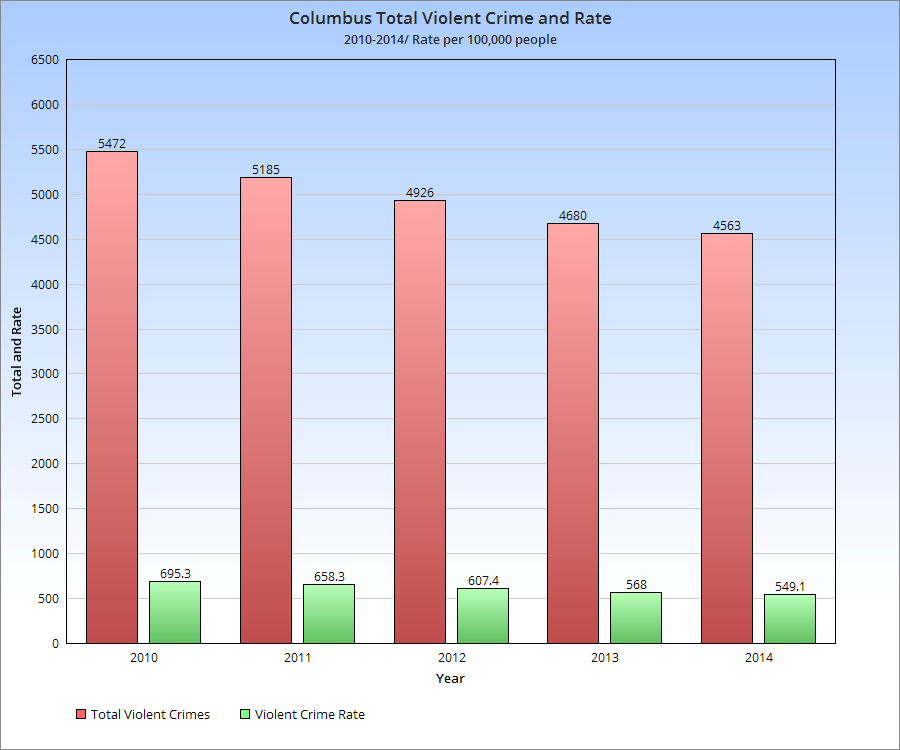
Let’s take a look at some of the numbers. First up, violent crimes.

Total violent crimes between 2010 and 2014 fell 16.6%, with any single person’s chances in 100k of being a victim of violent crime falling 21%. This is a pretty significant drop in just 4 years.

Here’s an individual violent crime breakdown:
-Murders were down 15.2%
-Rape was up 28.6%. The definition has changed in this time, which may explain some of that increase.
-Robbery was down 37.7%
-Aggravated Assault was up 14.6%.

So some good and bad. The good news for assault is that it’s well under where it was just 10 years ago, and almost 50% down from its historic peak in the early 1990s. It may have just been a bit worse year in 2014 for this, as all crime totals go through spikes even during a general decline. The bad news is that rape is historically high, but because the definitions have changed for it recently, it’s hard to make a fair comparison to previous years. If the current definition was in place years ago, it’s certainly possible it would now show a decline. Or, as with assault, rape totals could’ve seen a temporary spike above the trend line. Future years will tell the tale.

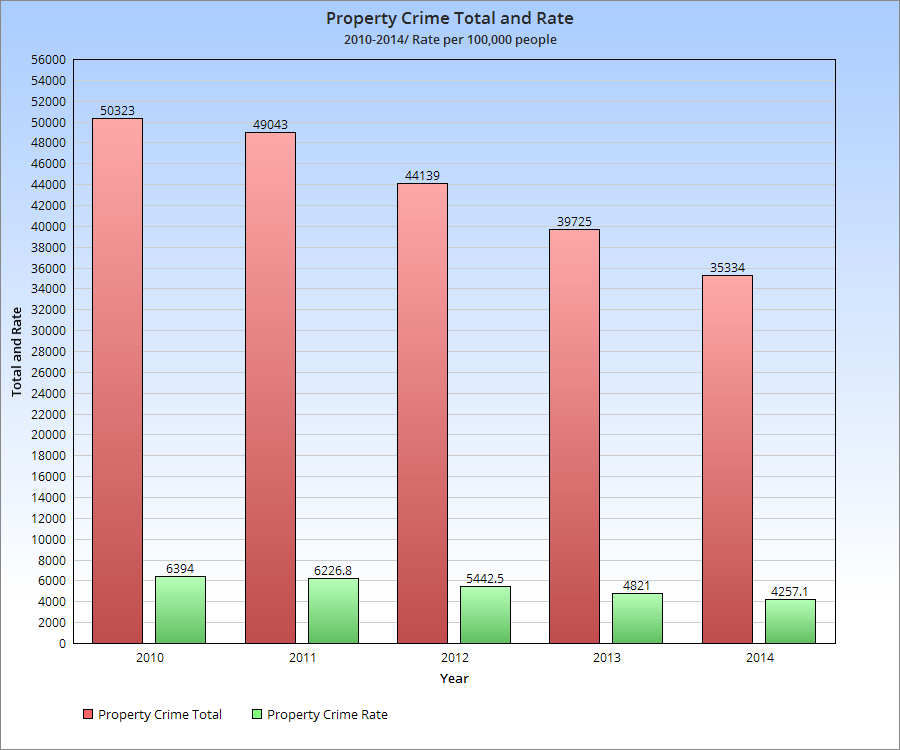
Now for property crime, something that’s always been somewhat high in Columbus, possibly due to the young population age and large number of college students.

Property crime in the city has dropped 29.8% 2010-2014, even more significant than the decrease in violent crime.

Here’s the breakdown:
-Burglary dropped 40.6%.
-Larceny Theft dropped 24.5%.
-Motor Vehicle Theft dropped 29.3%.

All down in the period.

So what about 2015 and beyond? Well, indications are that crime is up for 2015 vs. last year, though there are differing theories as to why. Crime being up seems to be widespread in cities around the nation, and some of it has been attributed to a newfound national popularity in heroin. Until we see 2015’s number sometime next year, we won’t know exactly the impact. For now, we can celebrate that the city has indeed become safer.

For more on 2014’s numbers, and to check out other cities, go here: https://www.fbi.gov/about-us/cjis/ucr/


Midwest Cities Historic Population and Density


Midwest cities historic population and density

I’ve compared Columbus to peer cities nationally in terms of density and population, but I’ve never made a Midwest cities historic population and density comparison overall. For the following, I used the top 15 largest Midwest cities as of 2014.

Red indicates a fallen ranking while blue indicates a rise. Black is no change.

Historic Population Rankings
1840

1. Cincinnati: 46,338
2. St. Louis: 16,469
3. Detroit: 9,102
4. Cleveland: 6,071
5. Columbus: 6,048
6. Chicago: 4,470
7. Indianapolis: 2,695
8. Milwaukee: 1,700
9. Toledo: 1,222
10. Kansas City: Not incorporated.
11. Lincoln: Not incorporated.
12. Minneapolis: Not incorporated.
13. Omaha: Not incorporated.
14. St. Paul: Not incorporated.
15. Wichita: Not incorporated.

1850
1. Cincinnati: 115,435
2. St. Louis: 77,860
3. Chicago: 29,963
4. Detroit: 21,019
5. Milwaukee: 20,061
6. Columbus: 17,882
7. Cleveland: 17,034
8. Indianapolis: 8,091
9. Toledo: 3,829
10. St. Paul: 1,112
11. Kansas City: Not incorporated.
12. Lincoln: Not incorporated.
13. Minneapolis: Not incorporated.
14. Omaha: Not incorporated.
15. Wichita: Not incorporated.

1860
1. Cincinnati: 161,044
2. St. Louis: 160,773
3. Chicago: 112,172
4. Detroit: 45,619
5. Milwaukee: 45,246
6. Cleveland: 43,417
7. Indianapolis: 18,611
8. Columbus: 18,554
9. Toledo: 13,768
10. St. Paul: 10,401
11. Minneapolis: 5,809
12. Kansas City: 4,418
13. Omaha: 1,883
14. Lincoln: Not incorporated.
15. Wichita: Not incorporated.

1870
1. St. Louis: 310,864
2. Chicago: 298,977
3. Cincinnati: 216,239
4. Cleveland: 92,829
5. Detroit: 79,577
6. Milwaukee: 71,440
7. Indianapolis: 48,244
8. Kansas City: 32,260
9. Toledo: 31,584
10. Columbus: 31,274
11. St. Paul: 20,030
12. Omaha: 16,083
13. Minneapolis: 13,066
14. Lincoln: 2,441
15. Wichita: 689

1880
1. Chicago: 503,185
2. St. Louis: 350,518
3. Cincinnati: 255,139
4. Cleveland: 160,146
5. Detroit: 116,340
6. Milwaukee: 115,587
7. Indianapolis: 75,056
8. Kansas City: 55,785
9. Columbus: 51,647
10. Toledo: 50,137
11. Minneapolis: 46,887
12. St. Paul: 41,473
13. Omaha: 30,518
14. Lincoln: 13,003
15. Wichita: 4,911

1890
1. Chicago: 1,099,850
2. St. Louis: 451,770
3. Cincinnati: 296,908
4. Cleveland: 261,353
5. Detroit: 205,877
6. Milwaukee: 204,468
7. Minneapolis: 164,738
8. Omaha: 140,452
9. St. Paul: 133,156
10. Kansas City: 132,716
11. Indianapolis: 105,436
12. Columbus: 88,150
13. Toledo: 81,434
14. Lincoln: 55,164
15. Wichita: 23,853

1900
1. Chicago: 1,698,575
2. St. Louis: 575,238
3. Cleveland: 381,768
4. Cincinnati: 325,902
5. Detroit: 285,704
6. Milwaukee: 285,315
7. Minneapolis: 202,718
8. Indianapolis: 169,164
9. Kansas City: 163,752
10. St. Paul: 163,065
11. Toledo: 131,822
12. Columbus: 125,560
13. Omaha: 102,555
14. Lincoln: 40,169
15. Wichita: 24,671

1910
1. Chicago: 2,185,283
2. St. Louis: 687,029
3. Cleveland: 560,663
4. Detroit: 465,766
5. Milwaukee: 373,857
6. Cincinnati: 363,591
7. Minneapolis: 301,408
8. Kansas City: 248,381
9. Indianapolis: 233,650
10. St. Paul: 214,744
11. Columbus: 181,511
12. Toledo: 168,497
13. Omaha: 124,096
14. Wichita: 52,450
15. Lincoln: 43,973

1920
1. Chicago: 2,701,705
2. Detroit: 993,678
3. Cleveland: 796,841
4. St. Louis: 772,897
5. Milwaukee: 457,147
6. Cincinnati: 401,247
7. Minneapolis: 380,582
8. Kansas City: 324,410
9. Indianapolis: 314,194
10. Toledo: 243,164
11. Columbus: 237,031
12. St. Paul: 234,698
13. Omaha: 191,061
14. Wichita: 72,217
15. Lincoln: 54,948

1930
1. Chicago: 3,376,438
2. Detroit: 1,568,662
3. Cleveland: 900,429
4. St. Louis: 821,960
5. Milwaukee: 578,249
6. Minneapolis: 464,356
7. Cincinnati: 451,160
8. Kansas City: 399,746
9. Indianapolis: 364,161
10. Toledo: 290,718
11. Columbus: 290,564
12. St. Paul: 271,606
13. Omaha: 214,006
14. Wichita: 111,110
15. Lincoln: 75,933

1940
1. Chicago: 3,396,808
2. Detroit: 1,623,452
3. Cleveland: 878,336
4. St. Louis: 816,048
5. Milwaukee: 587,472
6. Minneapolis: 492,370
7. Cincinnati: 455,610
8. Kansas City: 400,178
9. Indianapolis: 386,972
10. Columbus: 306,087
11. St. Paul: 287,736
12. Toledo: 282,349
13. Omaha: 223,844
14. Wichita: 114,966
15. Lincoln: 81,984

1950
1. Chicago: 3,620,962
2. Detroit: 1,849,568
3. Cleveland: 914,808
4. St. Louis: 856,796
5. Milwaukee: 637,392
6. Minneapolis: 521,718
7. Cincinnati: 503,998
8. Kansas City: 456,622
9. Indianapolis: 427,173
10. Columbus: 375,901
11. St. Paul: 311,349
12. Toledo: 303,616
13. Omaha: 251,117
14. Wichita: 168,279
15. Lincoln: 98,884

1960
1. Chicago: 3,550,404
2. Detroit: 1,670,144
3. Cleveland: 876,050
4. St. Louis: 750,026
5. Milwaukee: 741,324
6. Cincinnati: 502,550
7. Minneapolis: 482,872
8. Indianapolis: 476,258
9. Kansas City: 475,539
10. Columbus: 471,316
11. Toledo: 318,003
12. St. Paul: 313,411
13. Omaha: 301,598
14. Wichita: 254,698
15. Lincoln: 128,521

1970
1. Chicago: 3,366,957
2. Detroit: 1,514,063
3. Cleveland: 750,903
4. Indianapolis: 744,624
5. Milwaukee: 717,099
6. St. Louis: 622,236
7. Columbus: 539,677
8. Kansas City: 507,087
9. Cincinnati: 452,525
10. Minneapolis: 434,400
11. Toledo: 383,818
12. Omaha: 346,929
13. St. Paul: 309,980
14. Wichita: 276,554
15. Lincoln: 149,518

1980
1. Chicago: 3,005,072
2. Detroit: 1,203,368
3. Indianapolis: 700,807
4. Milwaukee: 636,212
5. Cleveland: 573,822
6. Columbus: 564,871
7. St. Louis: 452,801
8. Kansas City: 448,159
9. Cincinnati: 385,460
10. Minneapolis: 370,951
11. Toledo: 354,635
12. Omaha: 313,939
13. Wichita: 279,272
14. St. Paul: 270,230
15. Lincoln: 171,932

1990
1. Chicago: 2,783,726
2. Detroit: 1,027,974
3. Indianapolis: 731,327
4. Columbus: 632,910
5. Milwaukee: 628,088
6. Cleveland: 505,616
7. Kansas City: 435,146
8. St. Louis: 396,685
9. Minneapolis: 368,383
10. Cincinnati: 364,040
11. Omaha: 335,795
12. Toledo: 332,943
13. Wichita: 304,011
14. St. Paul: 272,235
15. Lincoln: 191,972

2000
1. Chicago: 2,896,016
2. Detroit: 951,270
3. Indianapolis: 781,926
4. Columbus: 711,470
5. Milwaukee: 596,974
6. Cleveland: 478,403
7. Kansas City: 441,545
8. Omaha: 390,007
9. Minneapolis: 382,618
10. St. Louis: 348,189
11. Wichita: 344,284
12. Cincinnati: 331,285
13. Toledo: 313,619
14. St. Paul: 287,151
15. Lincoln: 225,581

2010
1. Chicago: 2,695,598
2. Indianapolis: 829,445
3. Columbus: 787,033
4. Detroit: 713,777
5. Milwaukee: 594,833
6. Kansas City: 459,787
7. Omaha: 408,958
8. Cleveland: 396,815
9. Minneapolis: 382,578
10. Wichita: 382,368
11. St. Louis: 319,294
12. Cincinnati: 296,945
13. Toledo: 287,208
14. St. Paul: 285,068
15. Lincoln: 258,379

2014
1. Chicago: 2,722,389
2. Indianapolis: 848,788
3. Columbus: 835,957
4. Detroit: 680,250
5. Milwaukee: 599,642
6. Kansas City: 470,800
7. Omaha: 446,559
8. Minneapolis: 407,207
9. Cleveland: 389,521
10. Wichita: 388,413
11. St. Louis: 317,419
12. Cincinnati: 298,165
13. St. Paul: 297,640
14. Toledo: 281,031
15. Lincoln: 272,996

2020 Projection based on recent estimates.
1. Chicago: 2,736,032
2. Columbus: 905,875
3. Indianapolis: 873,774
4. Detroit: 646,682
5. Milwaukee: 606,730
6. Kansas City: 494,731
7. Omaha: 460,487
8. Minneapolis: 445,321
9. Wichita: 395,751
10. Cleveland: 380,149
11. St. Louis: 308,348
12. St. Paul: 306,448
13. Cincinnati: 302,288
14. Lincoln: 297,136
15. Toledo: 270,837

Columbus seems poised to take the #2 spot from Indianapolis around or just after 2020. Also, 11 of 15 would’ve seen growth 2010-2020. Cleveland, Toledo, St. Louis and Detroit would be the only cities that still lost.

2014 Density
1. Chicago: 11,634.1
2. Minneapolis: 6,972.7
3. Milwaukee: 6,188.3
4. St. Paul: 5,296.1
5. St. Louis: 4,809.4
6. Detroit: 4,760.3
7. Cleveland: 4,721.5
8. Omaha: 3,755.8
9. Columbus: 3,747.0
10. Cincinnati: 3,745.8
11. Lincoln: 3,620.6
12. Toledo: 3,246.1
13. Wichita: 2,374.2
14. Indianapolis: 2,306.5
15. Kansas City: 1,475.9

2020 Projected density using recent estimates.
1. Chicago: 11,692.4
2. Minneapolis: 7,625.4
3. Milwaukee: 6,261.4
4. St. Paul: 5,452.8
5. St. Louis: 4,671.9
6. Cleveland: 4,607.9
7. Detroit: 4,525.4
8. Columbus: 4,060.4
9. Lincoln: 3,940.8
10. Omaha: 3,872.9
11. Cincinnati: 3,797.6
12. Toledo: 3,220.4
13. Wichita: 2,419.0
14. Indianapolis: 2,374.4
15. Kansas City: 1,550.9

The Census is a great source if you are interested in seeing other cities that are not listed above.


Cool Link Before and After Worldwide


Similar to other posts that show how Columbus has been changing, the link below from the site Urb-I has hundreds of before and after worldwide photos of streetscape changes. Columbus itself is not included, but perhaps that can be changed as the site allows anyone to submit images.

http://www.urb-i.com/#!before-after/ceh8

Worst Winters of All Time


As summer slowly approaches its inevitable end, thoughts of winter have started to creep into our minds. The last two winters seemed particularly harsh, and questions were often asked as to their historic status as well as whether another bad winter was on the way. Ask any older person in Ohio, and the winters between 1976 and 1979 will often come up. But do they really deserve their reputations? To find out, I came up with a ranking system for meteorological winter only- December through February0- to rank the worst winters of all time. Here was the criteria:

Temperature: # of 32 or Below Highs, # of 32 or Below Lows, # of 0 or Below Highs, # of 0 or Below Lows: Each earned the winter a point for each day that featured these conditions.
# of 60 or Above Highs and # of 50 or Above Lows meant a point was removed for each occurrence.

Precipitation: # of Days with Measurable Snowfall, # of 1″+ Snow Days, # of 2.5″+ Snow Days, # of 5″+ Snow Days, # of 10″+ Snow Days as well as # of Measurable Precipitation Days all counted as 1 point for each occurrence.

I then added the temperature and precipitation points together to come up with a ranking for how miserable each winter really was.

Here are the 30 worst winters of all time and their total points.
1. 1976-1977: 240
2. 1977-1978: 238
3. 1969-1970: 230
4. 2002-2003: 228
5. 1978-1979: 226
6. 1880-1881: 225
7. 1917-1918: 223
8. 1935-1936: 220
9. 2013-2014: 219
10. 1892-1893, 1962-1963: 218
11. 1909-1910: 217
12. 1995-1996, 2009-2010: 208
13. 2010-2011: 207
14. 1903-1904: 204
15. 1981-1982: 202
16. 1911-1912, 1963-1964: 197
17. 1886-1887, 1919-1920: 196
18. 1904-1905: 195
19. 1984-1985: 194
20. 1916-1917: 193
21. 1894-1895: 191
22. 1883-1884: 189
23. 2000-2001: 188
24. 1947-1948, 1961-1962: 187
25. 1993-1994: 186
26. 1884-1885, 1939-1940: 185
27. 1983-1984, 1987-1988: 183
28. 1902-1903, 2014-2015: 182
29. 1954-1955: 180
30. 1878-1879, 1882-1883, 1960-1961, 1985-1986, 2003-2004, 2008-2009: 179

Do any of these surprise you? Both 2013-2014 and 2014-2015 are in the top 30 worst, but only 2013-2014 is in the top 10. In fact, other recent winters like 2000-2001, 2002-2003, 2009-2010 and 2010-2011 are all ranked worse than last winter. There have been a surprising number of recent winters in the top 30, however. There have been 8 total since 2000. No other similar time frame has produced as many.

And here are the 30 best winters (if you like warm, snowless, dry winters, that is).
1. 1931-1932: 74
2. 1889-1890: 75
3. 1879-1880: 86
4. 1997-1998: 102
5. 1881-1882, 1943-1944: 111
6. 2001-2002: 112
7. 1996-1997: 115
8. 1948-1949, 1953-1954: 118
9. 1941-1942, 1982-1983: 120
10. 1918-1919: 122
11. 1936-1937: 123
12. 1932-1933, 1991-1992: 124
13. 1930-1931: 125
14. 1905-1906, 1972-1973: 126
15. 1949-1950: 128
16. 1897-1898, 1986-1987: 129
17. 2011-2012: 130
18. 1938-1939: 131
19. 1937-1938: 134
20. 1908-1909, 1920-1921, 2005-2006: 135
21. 1924-1925: 137
22. 1896-1897: 138
23. 1927-1928, 1929-1930, 1940-1941, 1990-1991: 139
24. 1952-1953: 140
25. 1921-1922, 1945-1946, 1998-1999: 141
26. 1988-1989: 143
27. 1891-1892: 144
28. 1946-1947, 1971-1972: 145
29. 1912-1913, 1934-1935: 147
30. 1923-1924, 1992-1993: 148

Look how many of the warmest/least snowy occur between 1920 and 1945. Historically, this period had the fewest number of cold and/or snowy winters on record of any such 25-year period.

And what about winter 2015-2016? Well, that remains to be seen. However, the developing strong El Nino suggests a warmer than average winter. However, factors such as its position (west or east-based) as well as the PDO could throw some wrenches into that standard El Nino forecast. Either way, it will likely not be a top 30 worst.

Summer of Rain 2015

Summer of rain

This summer has been wet… very wet. Rain has fallen on far more days than not, and cloud cover has hung thick and heavy in what are historically much sunnier months. To top it all off, temperatures have been somewhat below normal.

How wet has the Summer of Rain 2015 been up through today? Meteorological summer runs June 1st-August 31st, and today makes the midpoint of that period, so I thought it would be a good time to check in and answer that question.

Here are the top 10 wettest summers through yesterday.
1. 1958: 12.54″
2. 2008: 11.68″
3. 1990: 10.93″
4. 2015: 10.66″
5. 1949: 10.40″
6. 1973: 10.23″
7. 1917: 10.06″
8. 1928: 10.02″
9. 1937: 9.75″
10. 1969: 9.38″

So 2015 is running the 4th wettest. It looks to be dry the next few days before more thunderstorms and rain return, so 2015′s position may end up rising.

What are the wettest full summers of all time? A few of the above years went on to be in the top 10, but not all.
1. 1958: 22.02″
2. 1979: 20.92″
3. 1995: 19.85″
4. 2003: 19.39″
5. 1969: 19.09″
6. 1915: 18.92″
7. 1992: 18.44″
8. 1973: 17.81″
9. 1989: 17.45″
10. 1949: 16.54″

Summer 2015 needs about 6″ more to reach into the top 10 wettest summers, which at the current pace is more than possible.