Depending on the source, the first official Columbus Gay Pride event was held in either June 1981 or June 1982. Going through newspaper and other records, it does seem like the first official Pride Parade in Columbus occurred on June 26, 1982. There were smaller demonstrations prior to 1982, but nothing officially recognized. In the 1970s, before events became more commonplace, small marches would take place through Downtown. Some participants of those early events would wear bags over their heads so that they would not be recognized. Very few protections, if any, existed for the LGBT community then, so a public outing could be very detrimental to someone’s life. In 1982, Columbus City Council passed a resolution recognizing Gay Pride Week 13 years after the Stonewall Riots, and allowed the parade to take place. The City had been somewhat of an early adoptee of LGBT equality when, in 1974, it passed an ordinance expanding housing and other public accommodation protections based on sexual orientation.
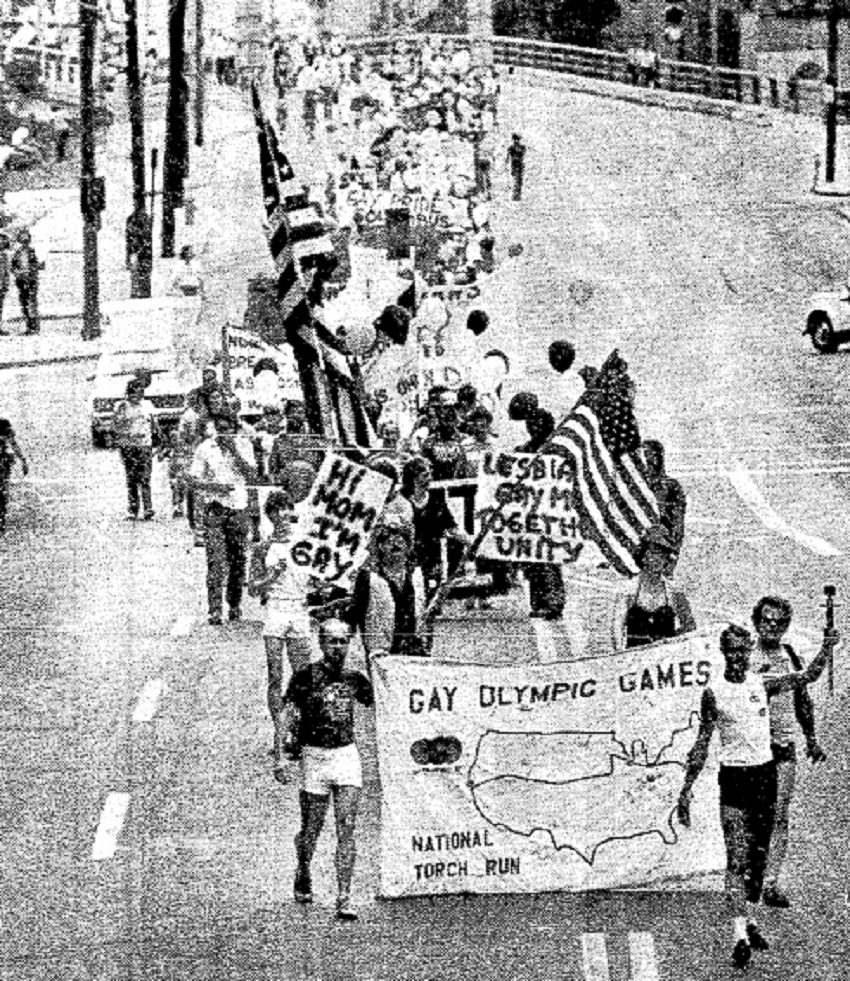
The 1982 parade.
Between 500-1000 people showed up to Columbus’ first Pride. The group took a route from Goodale Park, down Front Street and eventually to Capitol Square for a rally. The first parade was somewhat low key compared to today’s enormous party atmosphere. Participants carried signs, sang songs and waved American flags. The now iconic rainbow flag had only existed since 1978 and was not yet in widespread use. The parade faced surprisingly few hecklers along the route for a time in which support for LGBT equality was very much a minority position within the greater population. Some local churches organized small protest groups that shouted at the crowd to repent, but were booed down by the parade- a scene that unfortunately continues to the present day.
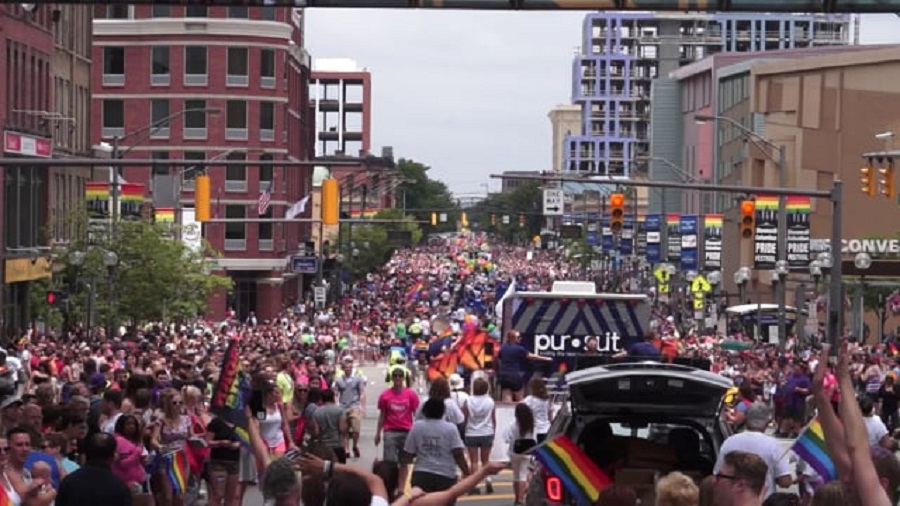
These brave participants helped pave the way for what is now one the largest such events in the nation and possibly the world. From less than 1000 marchers and spectators, the still-growing event now attracts in excess of half a million. Based on global statistics, this would put Columbus’ Pride in the top 25 largest in the world and around 8th in the United States.
In Franklin County, the immigrant- or foreign-born- population has been growing rapidly for the last few decades. Latin American immigration was dominant for many years, but has recently taken secondary position to even faster Asian growth. But where does the immigrant population live, exactly? Where they end up in the county is perhaps not where common belief would always suggest. The interactive map below breaks down not only the main continent of origin for immigrants by census tract, but also gives the top 5 specific origin nations. While at first glance, the continents seem heavily grouped together, a deeper look at nations of origin indicate that immigrant populations are much more diverse and spread out much more evenly than it appears.
It’s hard to imagine Columbus without its flagship university. While today Ohio State is one of the nation’s largest universities and a powerful influence in and out of Columbus in many ways, it got its start as just a humble agricultural college in 1870. Let’s go back to a time and look at these Ohio State campus aerials from 1919, and compare them to the same views today.
Before
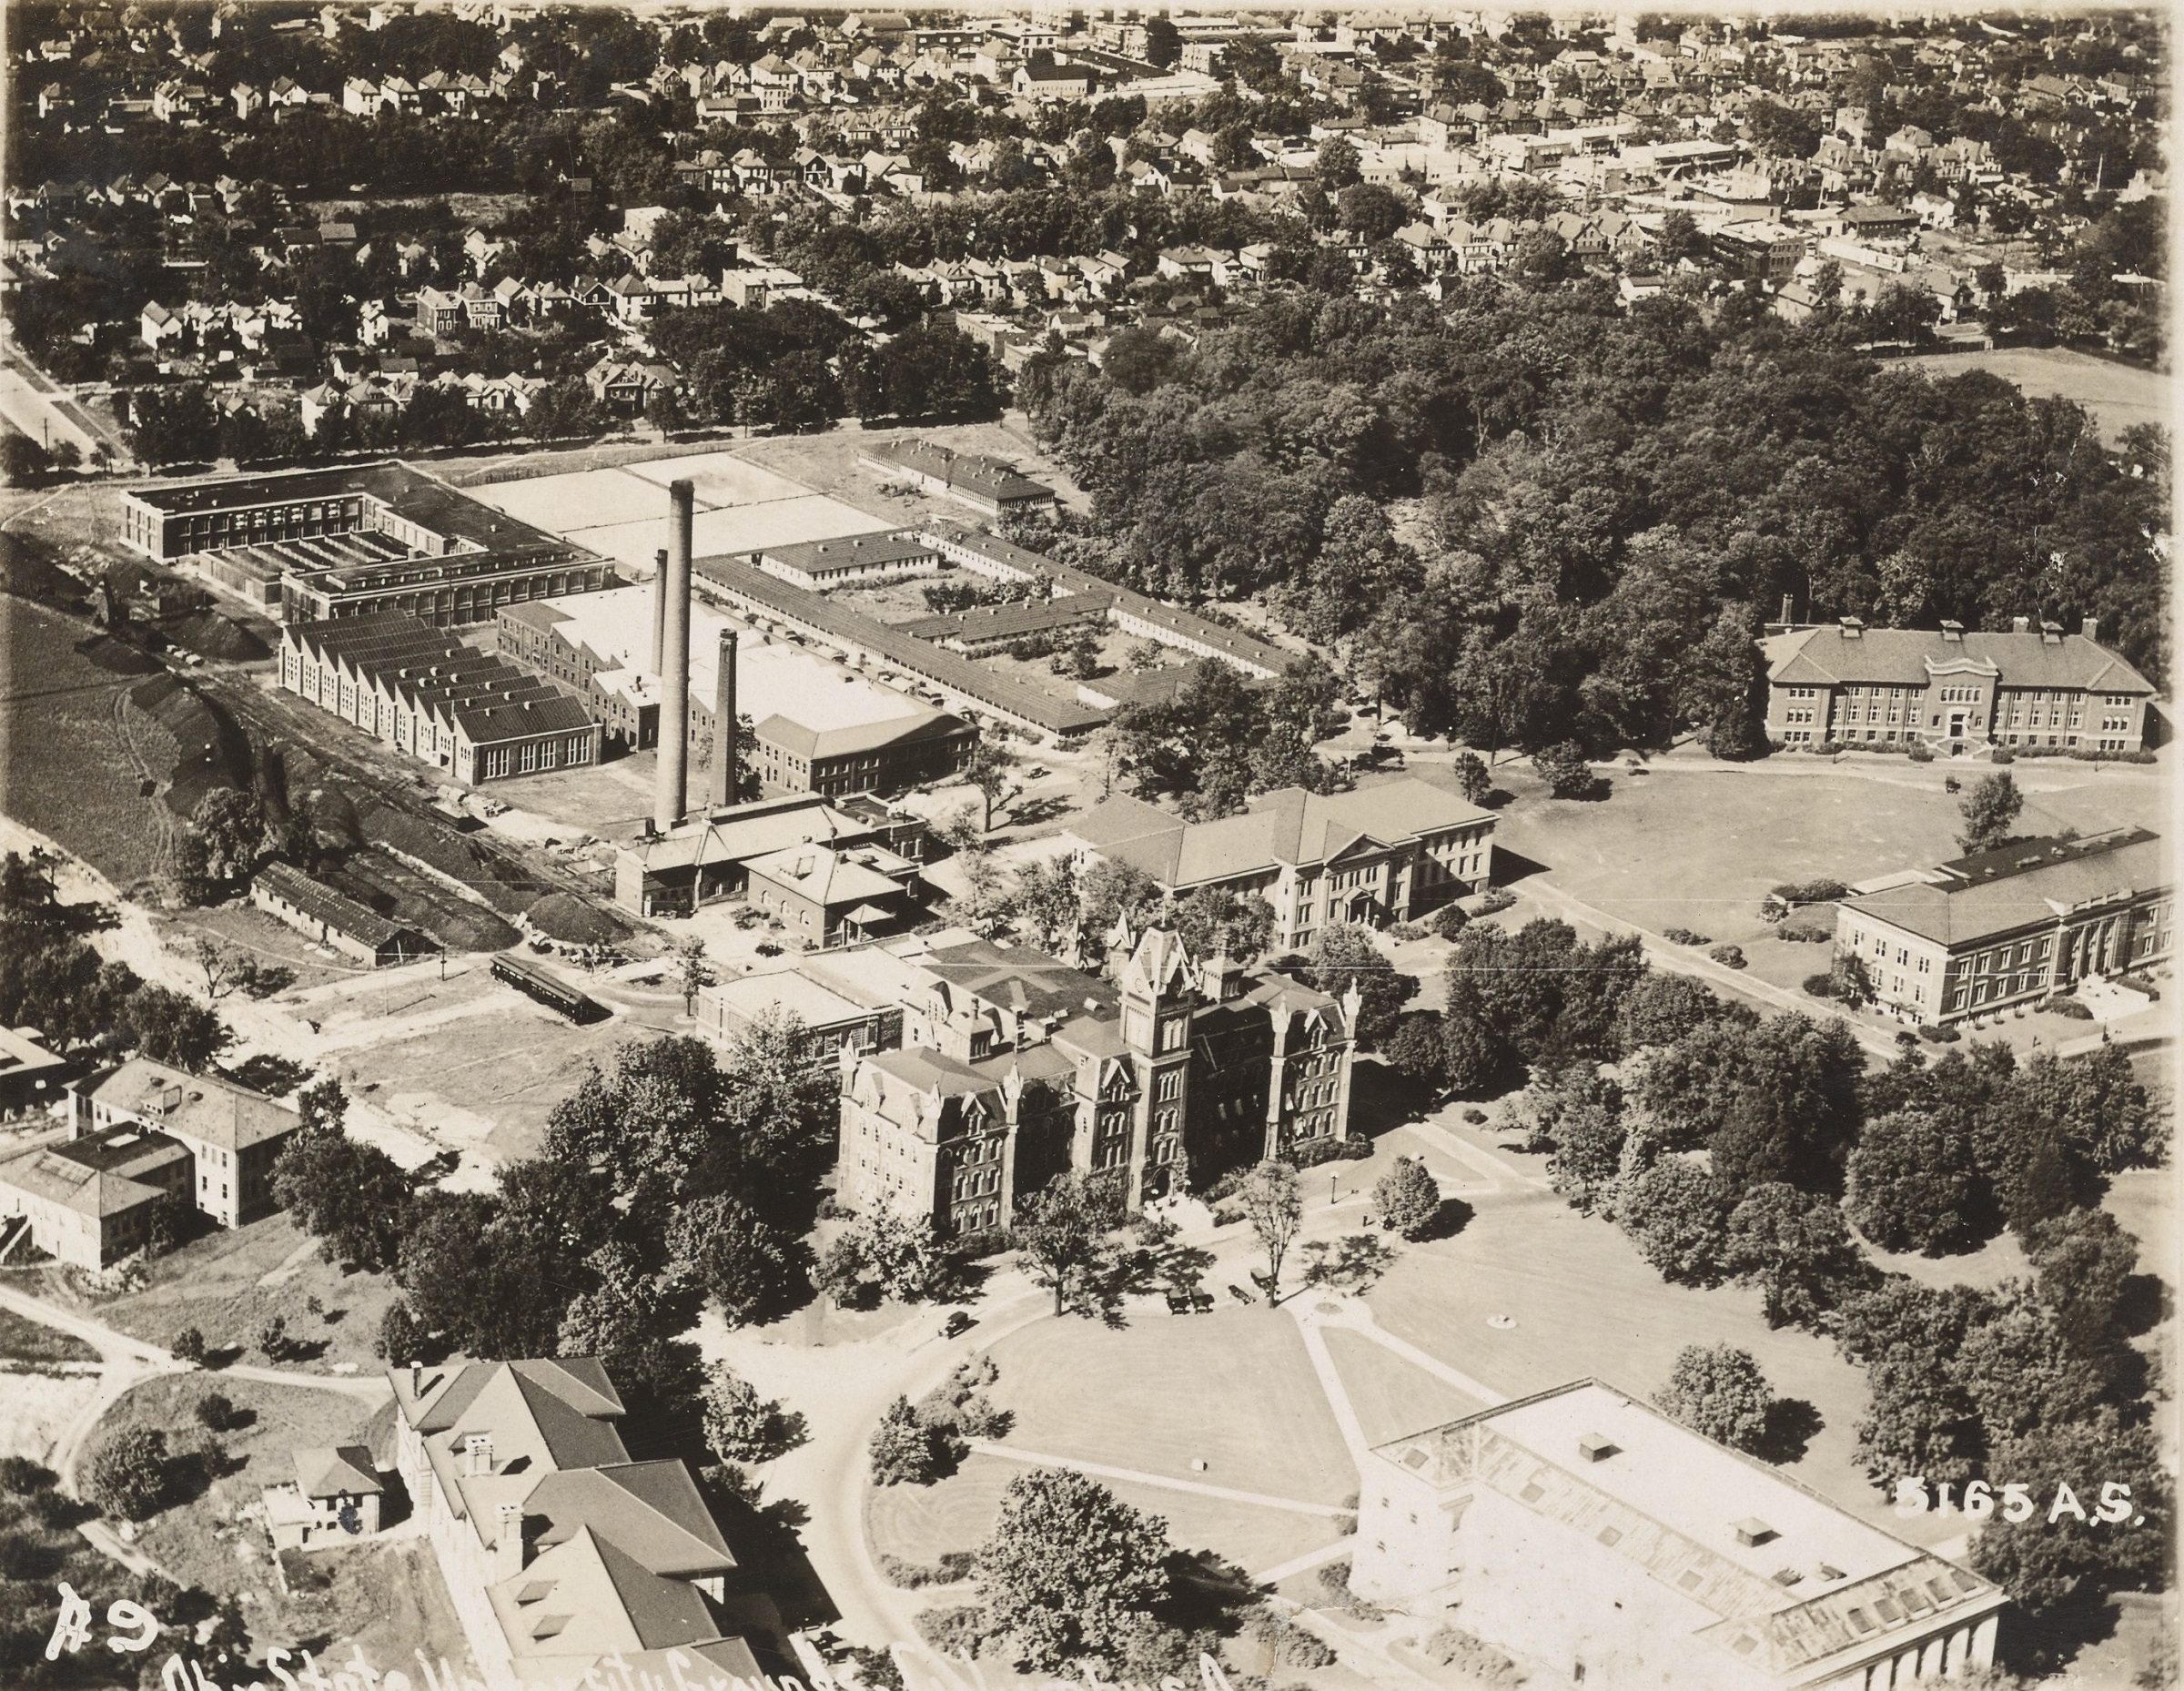
Photo taken in 1919.
This 1919 photo of the Oval and the surrounding neighborhood shows just how small the campus was back then. Residential areas began just to the north of of the Oval. Over the years, almost every single building in this photo would be demolished in OSU’s never-ending quest to expand and modernize. After
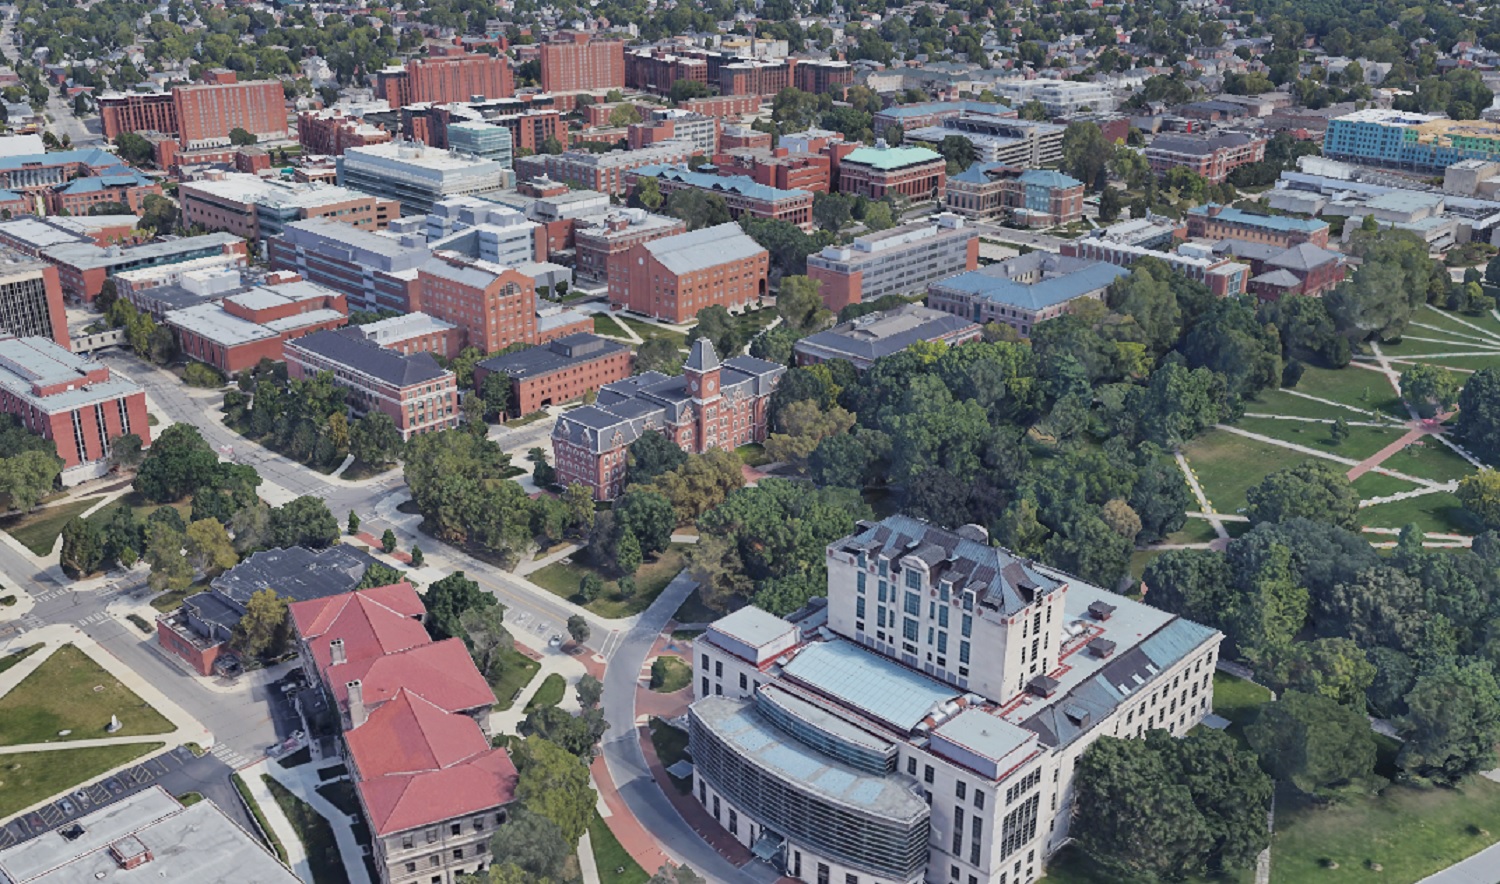
Photo taken in 2019.
The residential neighborhood is long gone, replaced with new student residences, offices and educational buildings. Almost nothing remains the same- even the street grid itself has been dramatically altered. Before
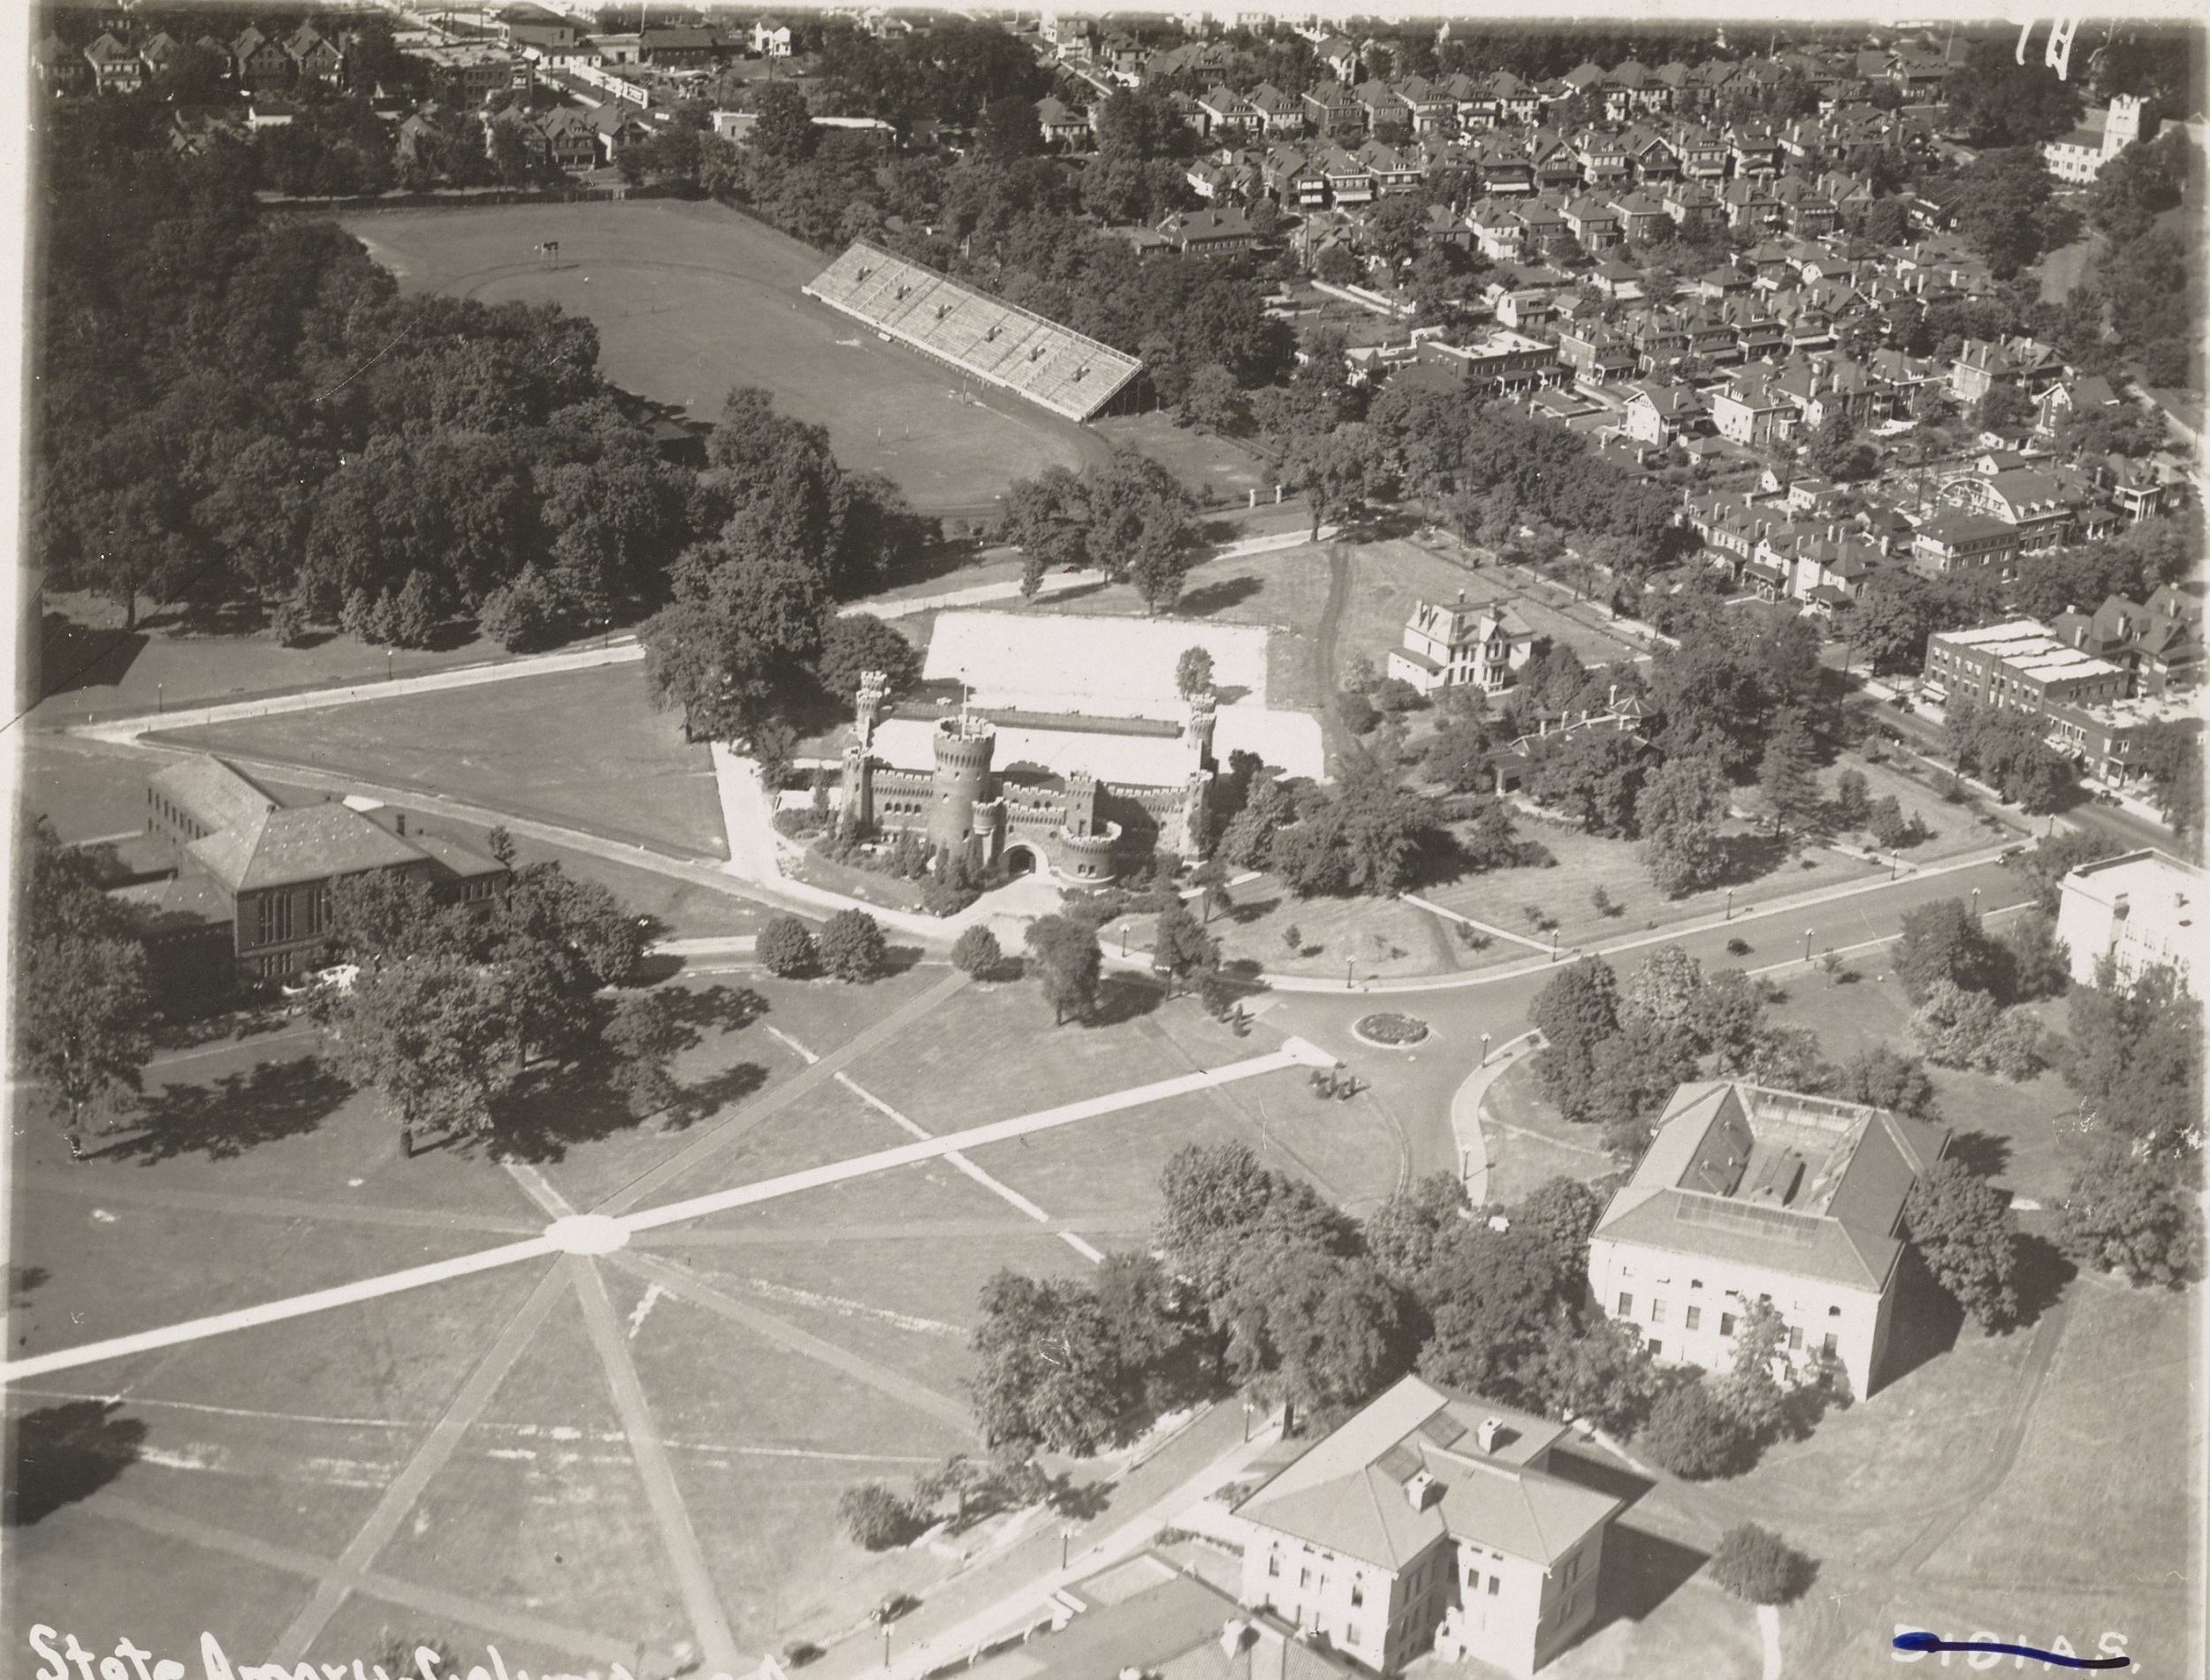
Photo taken in 1919.
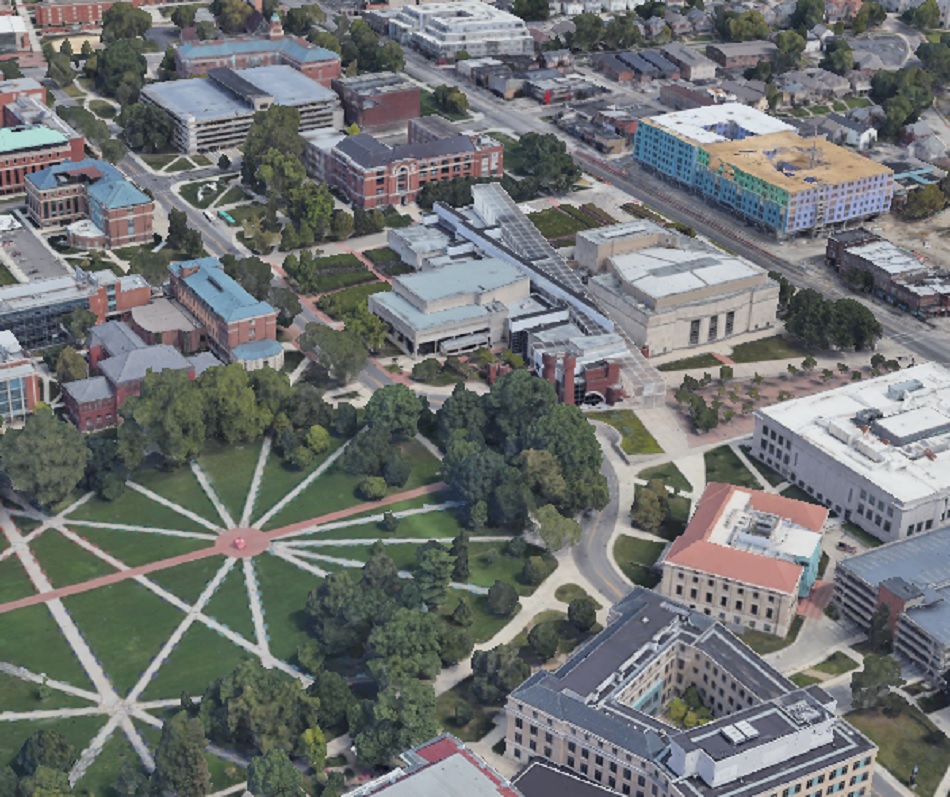
This photo of Campus further east show the famous castle-looking Armory, along with an athletic field and part of High Street. After Some buildings remain recognizable, but not many. The athletic field disappeared by the 1930s, and the Armory burned down in disastrous fire in the early 1950s. It iconic castle towers were recreated somewhat in the Wexner Center for the Arts, which occupies the former Armory location.
Clearly, Ohio State’s campus has changed drastically over the last century. No doubt a century from now, it will be equally as unrecognizable to us as the current iteration would be to students from long ago.
The local housing market update May 2021 is finally out, and the trends continue to show a strong sellers market. Prices continued to accelerate upward and supply continued to lag way behind, pushing home sales to occur even faster than they have been in recent months.
Note: LSD= Local School District, CSD= City School District. In both cases, school district boundaries differ from city boundaries.
Top 15 Most Expensive Locations By Median Sales Price in May 2021 1. New Albany: $810,000 2. German Village: $630,000 3. New Albany Plain LSD: $570,000 4. Dublin: $528,750 5. Bexley: $497,500 6. Upper Arlington CSD: $495,000 7. Worthington: $461,420 8. Powell: $460,000 9. Dublin CSD: $450,000 10. Olentangy LSD: $445,000 11. Buckeye Valley LSD: $406,790 12. Granville CSD: $402,500 13. Short North: $400,450 14. Grandview Heights: $394,000 15. Jonathan Alder LSD: $390,000
New Albany proper posted an astronomical median price in May, reaching unprecedented numbers for a Columbus suburb.
Top 15 Least Expensive Locations by Median Sales Price in May 2021 1. Whitehall: $138,000 2. Valleyview: $157,500 3. Groveport Madison LSD: $175,825 4. Lancaster CSD: $176,000 5. Circleville CSD: $182,000 6. Newark CSD: $184,250 7. Jefferson LSD: $207,500 8. Columbus CSD: $220,000 9. London CSD: $225,000 10. Hamilton LSD: $237,000 11. Columbus: $240,000 12. Reynoldsburg CSD: $245,500 13. South-Western CSD: $249,900 14. Canal Winchester CSD: $260,000 15. Teays Valley LSD: $268,894
In general, the further out the place from Columbus, the cheaper the location, but there are some exceptions. Whitehall and Columbus proper remain relatively affordable compared to most locations in the metro.
Overall Market Median Sales Price in May 2021: $227,088 The overall market is defined by Columbus Metro Area counties.
Top 15 Locations with the Highest Median Sales Price % Growth Between May 2020 and May 2021 1. German Village: +59.5% 2. Worthington: +54.6% 3. Obetz: +52.2% 4. New Albany Plain LSD: +40.7% 5. Hamilton LSD: +39.4% 6. Dublin CSD: +32.0% 7. Delaware CSD: +32.0% 8. Dublin: +31.4% 9. Pickerington: +30.3% 10. New Albany: +29.7% 11. Newark CSD: +29.4% 12. Worthington CSD: +29.1% 13. Westerville CSd: +28.6% 14. Pataskala: +27.0% 15. Jonathan Alder LSD: +25.8%
Top 15 Locations with the Lowest Median Sales Price % Growth Between May 2020 and May 2021 1. Lancaster CSD: -7.3% 2. Jefferson LSD: -5.5% 3. Downtown Columbus: -4.2% 4. Hilliard: -0.5% 5. Teays Valley LSD: +3.5% 6. Powell: +5.1% 7. Big Walnut LSD: +6.2% 8. Grandview Heights: +6.8% 9. Granville CSD: +7.6% 10. Short North: +7.6% 11. Canal Winchester CSD: +8.3% 12. Minerva Park: +8.4% 13. London CSD: +10.3% 14. Circleville CSD: +11.3% 15. Buckeye Valley LSD: +11.4%
There were fewer locations down year-over-year in May than in previous months, though urban areas generally saw lower increases.
Overall Market Median Sales Price % Change May 2021 vs. May 2020: +18.6%
Top 10 Locations with the Most New Listings in May 2021 1. Columbus: 1,467 2. Columbus CSD: 972 3. South-Western CSD: 217 4. Hilliard CSD: 171 5. Westerville CSD: 168 6. Olentangy LSD: 166 7. Dublin CSD: 166 8. Worthington CSD: 118 9. Pickerington LSD: 115 10. Upper Arlington CSD: 101
Top 10 Locations with the Fewest New Listings in May 2021 1. Valleyview: 2 2. Lithopolis: 5 3. Minerva Park: 5 4. Jefferson LSD: 6 5. Obetz: 8 6. Sunbury: 8 7. Grandview Heights: 10 8. Johnstown-Monroe LSD: 11 9. Whitehall: 12 10. Circleville CSD: 14
Urban areas and major suburbs saw increases in supply versus previous months, but because sales were also stronger, it didn’t help with actual supply or prices.
Total New Listings in the Columbus Metro in May 2021: +3,468 Overall Metro New Listings % Change May 2021 vs May 2020: +14.3%
Top 10 Fastest-Selling Locations by # of Days Homes Remain on the Market Before Sale in May 2021 1. Jonathan Alder LSD: 3 2. Valleyview: 3 3. Canal Winchester CSD: 4 4. Groveport Madison LSD: 4 5. Lithopolis: 4 6. German Village: 5 7. Worthington: 5 8. Worthington CSD: 5 9. Beechwold/Clintonville: 6 10. Blacklick: 6 11. Gahanna: 6 12. Marysville CSD: 6 13. Pickerington LSD: 6 14. Powell: 6 15. Westerville CSD: 6 16. Whitehall: 6
Top 10 Slowest-Selling Locations by # of Days Homes Remain on the Market Before Sale in May 2021 1. Short North: 51 2. Downtown Columbus: 39 3. Johnstown-Monroe LSD: 28 4. Bexley: 25 5. Lancaster CSD: 25 6. Jefferson LSD: 23 7. Obetz: 22 8. Buckeye Valley LSD: 21 9. Dublin: 19 10. Olentangy LSD: 18
Top 10 Locations with the Greatest % Decline of # of Days on the Market Before Sale May 2021 vs May 2020 1. Powell: -91.2% 2. Jonathan Alder LSD: -90.6% 3. Minerva Park: -85.7% 4. Circleville CSD: -84.2% 5. Whitehall: -82.9% 6. London CSD: -80.0% 7. Sunbury: -78.9% 8. Newark CSD: -78.0% 9. Upper Arlington CSD: -76.5% 10. Granville CSD: -75.8%
Top 10 Locations with the Lowest % Decline of # of Days on the Market Before Sale May 2021 vs May 2020 1. Short North: +264.3% 2. Valleyview: +50.0% 3. Bexley: +13.6% 4. Downtown Columbus: +11.4% 5. Lancaster CSD: -3.8% 6. Teays Valley LSD: -11.1% 7. Dublin: -26.9% 8. Reynoldsburg CSD: -29.4% 9. Westerville: -33.3% 10. Pataskala: -38.5%
% Change for the # of Days Homes Remain on the Market Before Sale Across the Metro Overall: 14
The market’s sales pace only increased further in May, with the entire metro’s supply of homes selling in an average of just 2 weeks. Many locations were selling at far faster rates, however.
A handy link is the Columbus Realtors website, which most of this data is derived from.
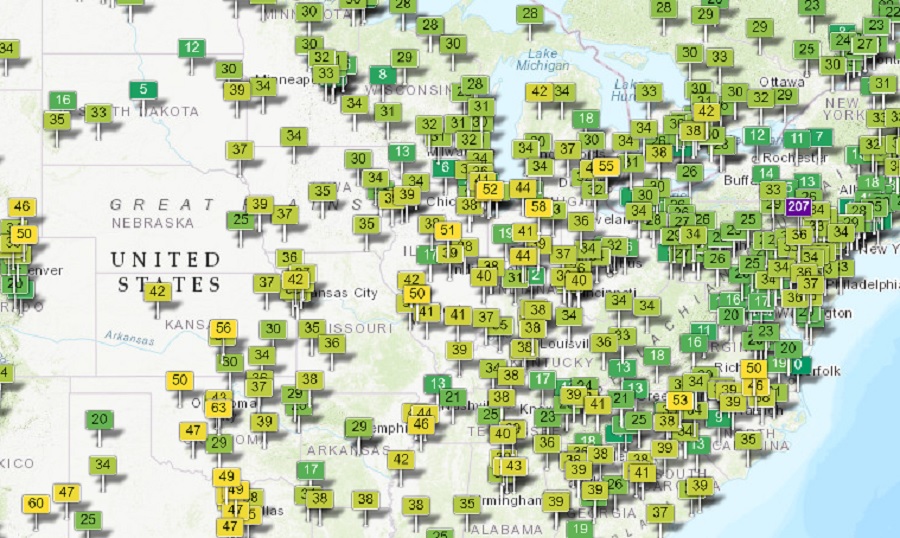
Wondering whether the air in your city or state is up to par? With this link, you can zoom in to your area to check air quality maps that are based on a variety of pollution types. Not only that, but an archive is available for pollution levels on past dates.
And if you’re interested in the air quality for places around the world, this link offers a great map of live conditions and measurements for most place on earth.