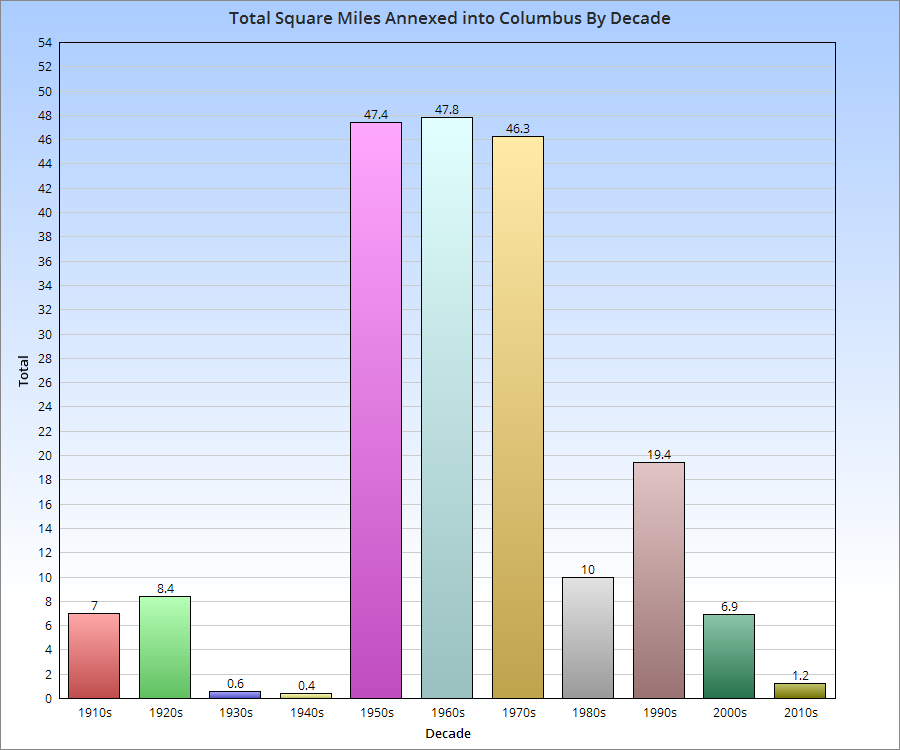
Ever wonder how Columbus got so big in area? Its city limits stretch into parts of other counties and include about a third of Franklin County. Today, it has a reputation for annexing its way to growth, but how true is this?
Well, 50 years ago, it was more or less true. Today, not so much. Aggressive annexation began in Columbus in 1953, when Mayor Maynard “Jack” Sensenbrenner began his policy of requiring annexation into the city if communities wanted city water service. Between 1953 and 1960, the area size of the city more than doubled, and that rate continued through the 1960s and 1970s, even after Sensenbrenner was no longer mayor. After 1980, annexation rates gradually began to decline. As the chart above shows, you can see the rapid rate of growth during the 1950s-1970s and the decline in more recent decades. Through the first 5 years of the 2010s, Columbus is on pace to add fewer than 3 square miles by 2020. Despite that fact, the city’s annual population growth since 2010 is exceeding the average annual growth of any decade during the mass annexation years. This strongly supports that the dynamic, and indeed, the story of Columbus’ growth is no longer about “fake” growth through the addition of existing land and population, but rather though the influx of new residents from outside of the city limits altogether. This is helping to gradually raise the city’s population density, which exceeded Cincinnati’s last year, as the chart below shows, along with a few other Columbus peers.
The first part of this comparison of young professionals and the city, seen here, seemed to be well-received, so I wanted to expand the examination of the 25-34 age group. In the first post, I just compared growth of this population by Columbus’ peers, but let’s take a closer look at this group through educational attainment. I will use the same 33 cities I used in the first post.
Educational Attainment 2014 Rank by City of Bachelors Degree or Higher within 25-34 Population 1. Chicago: 268,470 2. Austin: 97,721 3. Columbus: 75,305 4. San Jose: 68,392 5. Charlotte: 63,132 6. San Antonio: 62,572 7. Portland: 60,259 8. Minneapolis: 51,043 9. Indianapolis: 48,188 10. Pittsburgh: 35,860 11. Kansas City: 32,101 12. Madison: 30,039 13. Milwaukee: 29,661 14. Omaha: 28,984 15. St. Louis: 28,946 16. Sacramento: 27,304 17. Cincinnati: 25,496 18. St. Paul: 22,929 19. Virginia Beach: 22,134 20. Orlando: 20,181 21. Wichita: 19,659 22. Las Vegas: 17,817 23. Lincoln: 16,429 24. Grand Rapids: 15,724 25. Detroit: 14,285 26. Fort Wayne: 12,228 27. Cleveland: 12,013 28. Des Moines: 10,089 29. Providence: 10,432 30. Toledo: 8,514 31. Akron: 6,600 32. Dayton: 4,029 33. Youngstown: 1,084
Columbus has the 3rd highest total of 25-34-year-olds with at least a bachelor’s degree, even compared to some cities with larger populations in the city or metro area. This is likely due to the high number of colleges and universities in the area, not least of which includes Ohio State.
2014 % of Total 25-34 Age Group with Bachelors or Higher 1. Madison: 67.0% 2. Pittsburgh: 57.4% 3. Minneapolis: 56.3% 4. Portland: 51.5% 5. Chicago: 51.1% 6. Austin: 48.9% 7. Cincinnati: 47.0% 8. St. Louis: 46.9% 9. Charlotte: 44.5% 10. San Jose: 44.5% 11. Columbus: 44.1% 12. St. Paul: 42.1% 13. Lincoln: 41.0% 14. Omaha: 40.8% 15. Grand Rapids: 40.5% 16. Kansas City: 40.5% 17. Orlando: 37.1% 18. Indianapolis: 34.3% 19. Wichita: 33.7% 20. Providence: 32.7% 21. Sacramento: 32.5% 22. Fort Wayne: 32.4% 23. Des Moines: 29.8% 24. Milwaukee: 29.6% 25. Virginia Beach: 29.3% 26. San Antonio: 27.6% 27. Akron: 23.4% 28. Cleveland: 21.4% 29. Las Vegas: 19.7% 30. Toledo: 19.5% 31. Dayton: 19.1% 32. Detroit: 15.9% 33. Youngstown: 12.8%
While just outside of the top 10 in the peer group, Columbus still performs in the top 1/3rd when it comes to the % of 25-34-year-olds that have at least a bachelor’s degree.
2000-2014 Total Change in Age 25-34 with a Bachelor’s Degree or Higher 1. Chicago: +78,514 2. Austin: +38,348 3. Portland: +26,042 4. San Antonio: +23,504 5. Columbus: +21,601 6. Charlotte: +19,149 7. Pittsburgh: +19,060 8. Minneapolis: +15,629 9. St. Louis: +14,538 10. San Jose: +13,372 11. Sacramento: +11,530 12. Kansas City: +10,499 13. Madison: +8,774 14. Orlando: +8,600 15. Omaha: +8,521 16. Indianapolis: +8,369 17. Milwaukee: +7,031 18. Grand Rapids: +6,275 19. Wichita: +6,049 20. Fort Wayne: +5,350 21. Cincinnati: +5,083 22. Las Vegas: +4,433 23. St. Paul: +4,316 24. Virginia Beach: +4,167 25. Lincoln: +3,450 26. Providence: +2,488 27. Des Moines: +806 28. Dayton: +59 29. Youngstown: -108 30. Cleveland: -522 31. Akron: -628 32. Detroit: -1,471 33. Toledo: -1,639
Another great showing is in the total growth of 25-34-year-olds with at least a bachelor’s degree. Again, Columbus is outperforming several larger cities/metros on the list.
2000-2014 Total % Change in Age 25-34 with a Bachelor’s Degree or Higher 1. Pittsburgh: +113.45% 2. St. Louis: +100.90% 3. Fort Wayne: +77.78% 4. Portland: +76.11% 5. Orlando: +74.26% 6. Sacramento: +73.09% 7. Grand Rapids: +66.41% 8. Austin: +64.59% 9. San Antonio: +60.16% 10. Kansas City: +48.60% 11. Wichita: +44.45% 12. Minneapolis: +44.13% 13. Charlotte: +43.54% 14. Omaha: +41.64% 15. Chicago: +41.33% 16. Madison: +41.26% 17. Columbus: +40.22% 18. Las Vegas: +33.12% 19. Providence: +31.32% 20. Milwaukee: +31.07% 21. Lincoln: +26.58% 22. Cincinnati: +24.90% 23. San Jose: +24.30% 24. St. Paul: +23.19% 25. Virginia Beach: +23.19% 26. Indianapolis: +21.02% 27. Des Moines: +8.68% 28. Dayton: +1.49% 29. Cleveland: -4.16% 30. Akron: -8.69% 31. Youngstown: -9.06% 32. Detroit: -9.34% 33. Toledo: -16.14%
So in Part 1, it was shown that Columbus had one of the fastest growing 25-34 populations. These numbers show that it also has one of the largest age 25-34 populations with a Bachelor’s degree or higher in terms of totals, and one of the fastest growing in terms of totals. By %, however, it performs a bit worse, but part of the reason for that is because so many of these cities started with relatively low educated populations to begin with. Overall, Columbus seems to be very attractive, not only to this age group, but also for those within the group that are highly educated.
Millennials- those born roughly between 1981 and 2001- are big news these days. They are the largest generation ever in terms of total numbers (exceeding 76 million), and their choices are already having big impacts on everything from housing to the economy. I wanted to look at Columbus and its peers to see where it ranks in terms of attracting these young professionals.
For the comparison, I looked at metro areas of 1.5-2.5 million as well as major Midwest metros and then used their core cities to get the numbers. I used the age group of 25-34 specifically, as that is usually the number most often cited in the news.
Rank of Total Population Aged 25-34 2005_______________________2010___________________2014 1. Chicago: 463,236_______1. Chicago: 510,042_______1. Chicago: 525,381 2. San Antonio: 180,981_____2. San Antonio: 200,645____2. San Antonio: 226,711 3. Austin: 137,523_________3. Austin: 162,247_________3. Austin: 199,838 4. San Jose, CA: 133,144___4. Columbus: 147,584______4. Columbus: 170,759 5. Columbus: 131,641______5. San Jose, CA: 142,551___5. San Jose, CA: 153,690 6. Indianapolis: 114,532_____6. Indianapolis: 133,088____6. Charlotte, NC: 141,869 7. Detroit: 110,759_________7. Charlotte, NC: 127,539___7. Indianapolis: 140,491 8. Charlotte, NC: 100,025____8. Portland, OR: 113,210___8. Portland, OR: 116,109 9. Portland, OR: 90,023_____9. Milwaukee: 97,359______9. Milwaukee: 100,205 10. Las Vegas: 84,418______10. Detroit: 85,023________10. Minneapolis: 90,662 11. Milwaukee: 82,060______11. Minneapolis: 81,532____11. Las Vegas: 90,441 12. Sacramento, CA: 75,497___12. Las Vegas: 81,212____12. Detroit: 89,843 13. Minneapolis: 74,208___13. Sacramento, CA: 78,527__13. Sacramento, CA: 84,013 14. Kansas City, MO: 68,060__14. Kansas City: 73,872__14. Kansas City, MO: 79,262 15. Virginia Beach: 60,749__15. Virginia Beach: 67,614__15. Virginia Beach: 75,543 16. Omaha, NE: 56,248____16. Omaha, NE: 62,396_____16. Omaha, NE: 71,040 17. Wichita, KS: 52,426____17. St. Louis: 57,627_______17. Pittsburgh: 62,473 18. Cleveland: 50,558_____18. Wichita, KS: 56,737_____18. St. Louis: 61,718 19. St. Louis: 48,137______19. Cleveland: 54,428______19. Wichita, KS: 58,334 20. Cincinnati: 44,945_____20. Pittsburgh: 51,109______20. Cleveland: 56,134 21. Toledo: 43,134_______21. St. Paul, MN: 50,107_____21. St. Paul, MN: 54,464 22. Orlando: 40,846______22. Cincinnati: 49,067_______22. Orlando: 54,395 23. St. Paul, MN: 39,676__23. Orlando: 48,102________23. Cincinnati: 54,247 24. Lincoln, NE: 38,893___24. Madison, WI: 44,662_____24. Madison, WI: 44,835 25. Madison, WI: 38,826___25. Lincoln, NE: 42,034_____25. Toledo: 43,661 26. Pittsburgh: 38,744____26. Toledo: 41,580_________26. Lincoln, NE: 40,071 27. Grand Rapids: 35,287__27. Fort Wayne, IN: 35,193__27: Grand Rapids: 38,922 28. Des Moines: 32,640__28. Providence, RI: 31,044__28. Fort Wayne, IN: 37,741 29. Fort Wayne, IN: 31,738__29. Grand Rapids: 30,963__29. Des Moines: 33,857 30. Akron: 30,436_______30. Des Moines: 30,376_____30. Providence, RI: 31,902 31. Providence, RI: 29,307__31. Akron: 27,446________31. Akron: 28,207 32. Dayton: 18,591_______32. Dayton: 20,278________32. Dayton: 21,096 33. Youngstown: 8,505____33. Youngstown: 8,484_____33. Youngstown: 8,468
So Columbus ranks highly among total population in the 25-34 age group. But what about growth?
Total Growth Rank in 25-34 Population 2005-2014 1. Austin, TX: 62,315 2. Chicago: 62,145 3. San Antonio, TX: 45,730 4. Charlotte, NC: 41,844 5. Columbus: 39,118 6. Portland, OR: 26,086 7. Indianapolis: 25,959 8. Pittsburgh: 23,729 9. San Jose, CA: 20,546 10. Milwaukee, WI: 18,145 11. Minneapolis, MN: 16,454 12. Virginia Beach, VA: 14,794 13. St. Paul, MN: 14,788 14. Omaha, NE: 14,612 15. St. Louis, MO: 13,581 16. Orlando, FL: 13,549 17. Kansas City, MO: 11,202 18. Cincinnati: 9,302 19. Sacramento, CA: 8,516 20. Las Vegas, NV: 6,023 21. Madison, WI: 6,009 22. Fort Wayne, IN: 6,003 23. Wichita, KS: 5,908 24. Cleveland: 5,576 25. Grand Rapids, MI: 3,635 26. Providence, RI: 2,595 27. Dayton: 2,505 28. Des Moines, IA: 1,217 29. Lincoln, NE: 1,178 30. Toledo: 527 31. Youngstown: -37 32. Akron: -2,229 33. Detroit: -20,736
Again, Columbus ranks near the top during this period. What about more recently, since 2010?
Total Growth Rank of 25-34 Population 2010-2014 1. Austin: 37,591 2. San Antonio: 26,066 3. Columbus: 23,175 4. Chicago: 15,339 5. Charlotte: 14,330 6. Pittsburgh: 11,364 7. San Jose: 11,139 8. Las Vegas: 9,229 9. Minneapolis: 9,130 10. Omaha: 8,644 11. Grand Rapids: 7,959 12. Virginia Beach: 7,929 13. Indianapolis: 7,403 14. Orlando: 6,293 15. Sacramento: 5,486 16. Kansas City: 5,390 17. Cincinnati: 5,180 18. Detroit: 4,820 19. St. Paul: 4,357 20. St. Louis: 4,091 21. Des Moines: 3,481 22. Portland: 2,899 23. Milwaukee: 2,846 24. Fort Wayne: 2,548 25. Toledo: 2,081 26. Cleveland: 1,706 27. Wichita: 1,597 28. Providence: 858 29. Dayton: 818 30. Akron: 761 31. Madison: 173 32. Youngstown: -16 33. Lincoln: -1,963
So Columbus is doing even better since 2010 than it did in the earlier period and attracts significantly more Millennials in the 25-34 age group than cities often cited for this very metric.
Next, let’s look at percentage growth, as city size can affect this.
Total Percent Growth 2005-2014 in 25-34 Population 1. Pittsburgh: +61.25% 2. Austin: +45.31% 3. Charlotte: +41.83% 4. St. Paul: +37.27% 5. Orlando: +33.17% 6. Columbus: +29.72% 7. Portland: +28.98% 8. St. Louis: +28.21% 9. Omaha: +25.89% 10. San Antonio: +25.27% 11. Virginia Beach: +24.35% 12. Indianapolis: +22.67% 13. Minneapolis: +22.17% 14. Milwaukee: +22.11% 15. Cincinnati: +20.70% 16. Fort Wayne: +18.91% 17. Kansas City: +16.46% 18. Madison: +15.48% 19. San Jose: +15.43% 20. Dayton: +13.47% 21. Chicago: +13.42% 22. Sacramento: +11.28% 23. Wichita: +11.27% 24. Cleveland: +11.03% 25. Grand Rapids: +10.30% 26. Providence: +8.85% 27. Las Vegas: +7.13% 28. Des Moines: +3.73% 29. Lincoln: +3.03% 30. Toledo: +1.22% 31. Youngstown: -0.44% 32. Akron: -7.32% 33. Detroit: -18.75%
So Columbus again performs well in percentage growth, despite having one of the largest populations in the age group. It performs even better in the period since 2010, coming in at 3rd place.
Finally, now that we know the totals and the growth, what is the % of total city population that the 25-34 age group makes up?
25-34 % of Total City Population 2014 1. Minneapolis: 22.27% 2. Austin: 21.89% 3. Orlando: 20.73% 4. Pittsburgh: 20.45% 5. Columbus: 20.42% 6. Grand Rapids: 20.08% 7. St. Louis: 19.44% 8. Chicago: 19.30% 9. Portland: 18.74% 10. St. Paul: 18.30% 11. Madison: 18.25% 12. Cincinnati: 18.19% 13. Providence: 17.81% 14. Charlotte: 17.52% 15. Sacramento: 17.32% 16. Kansas City: 16.84% 17. Virginia Beach: 16.75% 18. Milwaukee: 16.71% 19. Indianapolis: 16.50% 20. Des Moines: 16.19% 21. Omaha: 15.91% 22. San Antonio: 15.78% 23. Toledo: 15.54% 24. San Jose: 15.13% 25. Wichita: 15.02% 26. Dayton: 14.96% 27. Fort Wayne: 14.74% 28. Las Vegas: 14.74% 29. Lincoln: 14.68% 30. Cleveland: 14.41% 31. Akron: 14.26% 32. Detroit: 13.21% 33. Youngstown: 13.02%
And here’s a simple % of population projection for just 4 years from now, 2018, provided the 25-34 population grows the same between 2014-2018 as it did 2010-2014. 1. Pittsburgh: 24.18% 2. Grand Rapids: 23.71% 3. Austin: 23.38% 4. Minneapolis: 23.27% 5. Columbus: 22.16% 6. Orlando: 21.34% 7. St. Louis: 20.82% 8. Cincinnati: 19.85% 9. Chicago: 19.70% 10. St. Paul: 19.05% 11. Providence: 18.20% 12. Portland: 18.14% 13. Virginia Beach: 18.1% 14. Sacramento: 17.84% 15. Charlotte: 17.67% 16. Kansas City: 17.64% 17. Des Moines: 17.50% 18. Madison: 17.40% 19. Milwaukee: 17.07% 20. Indianapolis: 16.85% 21. Omaha: 16.61% 22. Toledo: 16.59% 23. San Antonio: 16.52% 24. Fort Wayne: 15.61% 25. Las Vegas: 15.59% 26. Dayton: 15.27% 27. San Jose: 15.24% 28. Wichita: 15.23% 29. Cleveland: 15.08% 30. Akron: 14.73% 31. Detroit: 14.48% 32. Youngstown: 13.35% 33. Lincoln: 13.13%
Columbus has an existing large population of the 25-34 age demographic, and looks to be one of the strongest performers into the near future. Some would ask why that would be considering that Columbus transit is woefully lacking and has a reputation (very undeservedly, in my opinion) of being suburban- characteristics that Millennials supposedly almost universally reject. Perhaps the bottom line is that economics trump all other desires. Cost of living and employment tend to be higher up the list than rail lines, and Columbus has both a strong economy and relatively low COL. Whatever the case may be, Columbus seems to be doing something right. Continue this look at this population in Part 2.
I’ve compared Columbus to peer cities nationally in terms of density and population, but I’ve never made a Midwest cities historic population and density comparison overall. For the following, I used the top 15 largest Midwest cities as of 2014.
Red indicates a fallen ranking while blue indicates a rise. Black is no change.
Historic Population Rankings 1840 1. Cincinnati: 46,338 2. St. Louis: 16,469 3. Detroit: 9,102 4. Cleveland: 6,071 5. Columbus: 6,048 6. Chicago: 4,470 7. Indianapolis: 2,695 8. Milwaukee: 1,700 9. Toledo: 1,222 10. Kansas City: Not incorporated. 11. Lincoln: Not incorporated. 12. Minneapolis: Not incorporated. 13. Omaha: Not incorporated. 14. St. Paul: Not incorporated. 15. Wichita: Not incorporated.
1850 1. Cincinnati: 115,435 2. St. Louis: 77,860 3. Chicago: 29,963 4. Detroit: 21,019 5. Milwaukee: 20,061 6. Columbus: 17,882 7. Cleveland: 17,034 8. Indianapolis: 8,091 9. Toledo: 3,829 10. St. Paul: 1,112 11. Kansas City: Not incorporated. 12. Lincoln: Not incorporated. 13. Minneapolis: Not incorporated. 14. Omaha: Not incorporated. 15. Wichita: Not incorporated.
Columbus seems poised to take the #2 spot from Indianapolis around or just after 2020. Also, 11 of 15 would’ve seen growth 2010-2020. Cleveland, Toledo, St. Louis and Detroit would be the only cities that still lost.
Total Births Census 2010 to July 1, 2014 Chicago, IL: 516,295 Detroit, MI: 212,571 Minneapolis, MN: 192,866 Charlotte, NC: 125,143 Kansas City, MO: 117,872 Portland, OR: 117,482 Cincinnati: 117,072 Sacramento, CA: 116,893 Orlando, FL: 114,387 Columbus: 113,392 Indianapolis, IN: 113,127 Las Vegas, NV: 111,857 Austin, TX: 107,591 San Jose, CA: 105,447 Pittsburgh, PA: 100,888 Cleveland: 98,504 Virginia Beach, VA: 96,734 Nashville, TN: 96,440 Milwaukee, WI: 84,990 Providence, RI: 70,850 Grand Rapids, MI: 57,551 Omaha, NE: 55,860 Dayton: 40,683 Wichita, KS: 40,276 Des Moines, IA: 36,423 Akron: 32,228 Toledo: 32,024 Madison, WI: 31,280 Youngstown: 23,686
Total Deaths Census 2010 to July 1, 2014 Chicago, IL: 289,440 Detroit, MI: 166,387 Pittsburgh, PA: 114,531 Minneapolis, MN: 90,773 Cleveland: 88,446 Cincinnati: 77,345 Charlotte, NC: 71,315 Kansas City, MO: 68,102 Sacramento, CA: 67,943 Portland, OR: 67,820 Orlando, FL: 65,979 Indianapolis, IN: 64,207 Columbus: 62,011 Providence, RI: 61,604 Las Vegas, NV: 60,256 Nashville, TN: 55,846 Virginia Beach, VA: 55,425 Milwaukee, WI: 55,123 San Jose, CA: 41,927 Austin, TX: 36,873 Dayton: 33,636 Grand Rapids, MI: 30,324 Youngstown: 29,196 Akron: 29,040 Omaha, NE: 26,829 Toledo: 24,226 Wichita, KS: 23,025 Des Moines, IA: 17,602 Madison, WI: 17,069
Total Natural Change Census 2010 to July 1, 2014 Chicago, IL: 226,855 Minneapolis, MN: 102,093 Austin, TX: 70,718 San Jose, CA: 63,520 Charlotte, NC: 53,828 Las Vegas, NV: 51,601 Columbus: 51,381 Kansas City, MO: 49,770 Portland, OR: 49,662 Sacramento, CA: 48,950 Indianapolis, IN: 48,920 Orlando, FL: 48,708 Detroit, MI: 46,184 Virginia Beach, VA: 41,309 Nashville, TN: 40,594 Cincinnati: 39,727 Milwaukee, WI: 29,867 Omaha, NE: 29,031 Grand Rapids, MI: 27,227 Des Moines, IA: 18,821 Wichita, KS: 17,251 Madison, WI: 14,211 Cleveland: 10,058 Providence, RI: 9,246 Toledo: 7,798 Dayton: 7,047 Akron: 3,188 Youngstown: -5,510 Pittsburgh, PA: -13,643
Total Domestic Migration Census 2010 to July 1, 2014 Austin, TX: 126,296 Charlotte, NC: 83,305 Orlando, FL: 72,735 Nashville, TN: 63,477 Portland, OR: 48,793 Las Vegas, NV: 35,289 Columbus: 20,083 Indianapolis, IN: 16,744 Des Moines, IA: 16,559 Sacramento, CA: 15,658 Madison, WI: 6,901 Grand Rapids, MI: 5,372 Pittsburgh, PA: 4,053 Omaha, NE: 2,869 Minneapolis, MN: -934 Kansas City, MO: -1,948 Akron: -6,490 Youngstown: -7,347 Dayton: -10,873 Wichita, KS: -11,148 Toledo: -13,337 San Jose, CA: -15,335 Cincinnati: -18,334 Providence, RI: -21,325 Milwaukee, WI: -22,597 Virginia Beach, VA: -24,374 Cleveland: -38,424 Detroit, MI: -89,649 Chicago, IL: -237,666
Total International Migration Census 2010 to July 1, 2014 Chicago, IL: 108,320 San Jose, CA: 69,894 Orlando, FL: 63,215 Minneapolis, MN: 46,328 Detroit, MI: 44,614 Las Vegas, NV: 29,440 Sacramento, CA: 29,435 Austin, TX: 25,762 Charlotte, NC: 23,114 Virginia Beach, VA: 23,092 Portland, OR: 22,042 Columbus: 21,574 Providence, RI: 21,170 Indianapolis, IN: 17,623 Nashville, TN: 16,204 Cleveland: 16,010 Kansas City, MO: 14,569 Cincinnati: 14,567 Pittsburgh, PA: 12,887 Milwaukee, WI: 9,968 Omaha, NE: 7,897 Madison, WI: 6,706 Grand Rapids, MI: 6,232 Dayton: 6,200 Des Moines, IA: 6,159 Akron: 4,599 Wichita, KS: 4,006 Toledo: 2,971 Youngstown: 1,088
Total Migration Census 2010 to July 1, 2014 Austin, TX: 152,058 Orlando, FL: 135,950 Charlotte, NC: 106,419 Nashville, TN: 79,681 Portland, OR: 70,835 Las Vegas, NV: 64,729 San Jose, CA: 54,559 Minneapolis, MN: 45,394 Sacramento, CA: 45,093 Columbus: 41,657 Indianapolis, IN: 34,367 Des Moines, IA: 22,718 Pittsburgh, PA: 16,940 Madison, WI: 13,607 Kansas City, MO: 12,621 Grand Rapids, MI: 11,604 Omaha, NE: 10,766 Providence, RI: -155 Virginia Beach, VA: -1,282 Akron: -1,891 Cincinnati: -3,767 Dayton: -4,673 Youngstown: -6,259 Wichita, KS: -7,142 Toledo: -10,366 Milwaukee, WI: -12,629 Cleveland: -22,414 Detroit, MI: -45,035 Chicago, IL: -129,346
Total Population Change Census 2010 to July 1, 2014 Austin, TX: 226,996 Orlando, FL: 187,012 Charlotte, NC: 163,066 Minneapolis, MN: 146,319 Portland, OR: 122,236 Nashville, TN: 121,749 Las Vegas, NV: 118,412 San Jose, CA: 115,931 Sacramento, CA: 95,254 Chicago, IL: 93,061 Columbus: 92,521 Indianapolis, IN: 83,192 Kansas City, MO: 61,795 Des Moines, IA: 41,916 Virginia Beach, VA: 39,807 Omaha, NE: 39,071 Grand Rapids, MI: 38,763 Cincinnati: 34,694 Madison, WI: 28,350 Milwaukee, WI: 16,291 Wichita, KS: 10,157 Providence, RI: 8,151 Dayton: 1,620 Akron: 618 Detroit, MI: 298 Pittsburgh, PA: -317 Toledo: -2,545 Youngstown: -12,541 Cleveland: -13,648
Out of the 31 peer and Midwest metros, Columbus had the 7th highest natural growth, the 10th highest migration rate and the 11th highest overall growth rate.