And here were the top 25 cities with the highest numeric growth 2010-2018. 1. Columbus: +105,500 2. Hilliard: +7,979 3. Dublin: +6,896 4. Grove City: +6,050 5. Cincinnati: +5,662 6. Delaware: +5,177 7. North Ridgeville: +4,424 8. Westerville: +4,267 9. New Albany: +3,165 10. Pickerington: +2,910 11. Mason: +2,874 12. Newark: +2,456 13. Reynoldsburg: +2,385 14. Gahanna: +2,303 15. Wadsworth: +2,214 16. Beavercreek: +2,198 17. Marysville: +2,173 18. Avon: +2,070 19. Powell: +1,809 20. Grandview Heights: +1,785 21. Upper Arlington: +1,751 22. Harrison: +1,711 23. Lancaster: +1,634 24. Oxford: +1,514 25. Sunbury: +1,485
Columbus’ growth is very impressive in Ohio, but it has also been a top 15 fastest-growing city in the country for the past few years now, and there appears to be little standing in the way of that continuing.
In the 2nd post related to the recently-released Census demographic data, I’ll look at Columbus city diversity and peer comparison for how it’s been changing since 2005.
Rank by City of Total White, non-Hispanic Population by Year 2005————————————–2010————————————-2017 1. Chicago, IL: 819,215————1. Chicago: 853,910————1. Chicago: 879,334 2. Indianapolis, IN: 491,044—2. Indianapolis: 482,195—–2. Columbus: 490,149 3. Columbus: 442,958———-3. Columbus: 470,971—-3. Indianapolis: 468,665 4. Portland, OR: 382,033———-4. Portland: 417,876————4. Austin: 453,801 5. San Antonio, TX: 356,420—–5. Austin: 384,065————5. Portland: 452,132 6. Austin, TX: 347,013——-6. San Antonio: 351,420—6. San Antonio: 375,463 7. Nashville, TN: 314,518——–7. Nashville: 339,030——–7. Nashville: 368,195 8. Charlotte, NC: 302,789——-8. Charlotte: 331,357——8. Charlotte: 360,270 9. Virginia Beach, VA: 290,891–9. Virginia Beach: 282,812——9. Omaha: 311,349 10. San Jose, CA: 281,822—–10. Las Vegas: 280,604———–10. Las Vegas: 280,201 11. Las Vegas, NV: 281,679—-11. Omaha: 277,606———–11. Virginia Beach: 277,338 12. Omaha, NE: 267,685——–12. San Jose: 265,311————12. Kansas City: 272,548 13. Kansas City, MO: 249,123—13. Kansas City: 247,473——13. San Jose: 267,315 14. Wichita, KS: 245,527———-14. Wichita: 245,146————14. Minneapolis: 252,304 15. Milwaukee, WI: 219,891——15. Minneapolis: 242,848——15. Wichita: 243,143 16. Minneapolis, MN: 216,975—16. Milwaukee: 221,514——–16. Lincoln: 226,297 17. Lincoln, NE: 197,287———-17. Lincoln: 216,076————-17. Milwaukee: 207,043 18. Toledo: 183,746—————-18. Pittsburgh: 203,622———18. Pittsburgh: 196,687 19. Pittsburgh, PA: 180,725——19. Fort Wayne: 179,646——-19. Madison: 187,566 20. Madison, WI: 161,631——–20. Madison: 178,307————20. Fort Wayne: 166,912 21. St. Paul, MN: 161,329——–21. Toledo: 177,341————–21. Toledo: 164,104 22. Sacramento, CA: 160,599—22. Sacramento: 165,610——22. Sacramento: 159,291 23. Fort Wayne, IN: 157,672—–23. St. Paul: 159,704———–23. St. Paul: 152,558 24. Des Moines, IA: 149,786—–24. Des Moines: 145,937——24. Cincinnati: 143,028 25. Cleveland: 147,359———–25. Cincinnati: 143,120———25. Des Moines: 137,235 26. St. Louis, MO: 143,590——26. Cleveland: 137,977———26. St. Louis: 134,471 27. Cincinnati: 138,486———–27. St. Louis: 134,146———–27. Cleveland: 126,714 28. Akron: 128,976—————-28. Akron: 120,800————–28. Grand Rapids: 114,349 29. Grand Rapids, MI: 113,791—29. Grand Rapids: 104,636—29. Akron: 113,951 30. Orlando, FL: 92,326———–30. Orlando: 96,867————-30. Orlando: 95,876 31. Detroit, MI: 77,163————-31. Dayton: 72,663————–31. Dayton: 71,094 32. Dayton: 67,581—————–32. Providence: 64,284——–32. Detroit: 70,931 33. Providence, RI: 64,223——-33. Detroit: 55,298————–33. Providence: 59,321
Columbus moved from 3rd to 2nd over the period.
Rank by City of Total Black, non-Hispanic Population by Year 2005—————————————–2010———————————2017 1. Chicago: 938,097—————–1. Chicago: 895,294———–1. Chicago: 797,253 2. Detroit: 683,999——————–2. Detroit: 587,707————-2. Detroit: 529,593 3. Milwaukee: 222,040————–3. Charlotte: 251,274———-3. Charlotte: 292,104 4. Cleveland: 221,797—————4. Milwaukee: 230,473——–4. Columbus: 248,476 5. Charlotte: 205,216—————-5. Indianapolis: 226,314——-5. Indianapolis: 236,606 6. Indianapolis: 193,948————6. Columbus: 216,486———6. Milwaukee: 228,720 7. Columbus: 179,197—————7. Cleveland: 208,528———7. Cleveland: 186,073 8. St. Louis: 168,768—————-8. Nashville: 171,104———–8. Nashville: 180,830 9. Nashville: 148,051—————-9. St. Louis: 157,382———–9. St. Louis: 143,761 10. Kansas City: 131,694———-10. Kansas City: 138,461—–10. Kansas City: 138,346 11. Cincinnati: 131,010————-11. Cincinnati: 131,909——–11. Cincinnati: 127,589 12. Pittsburgh: 81,758————–12. Virginia Beach: 79,583—-12. San Antonio: 97,925 13. Virginia Beach: 80,004——–13. San Antonio: 79,307——13. Virginia Beach: 82,181 14. Orlando: 73,736—————–14. Toledo: 75,033————-14. Minneapolis: 75,006 15. Toledo: 72,190——————-15. Pittsburgh: 71,539——–15. Toledo: 74,906 16. Sacramento: 71,452————16. Orlando: 70,988————16. Orlando: 72,796 17. San Antonio: 70,723————17. Minneapolis: 63,749——17. Austin: 69,860 18. Dayton: 60,196——————-18. Sacramento: 61,976——18. Sacramento: 67,305 19. Akron: 59,810——————–19. Austin: 61,833————–19. Las Vegas: 65,663 20. Las Vegas: 59,780————–20. Dayton: 61,402————-20. Pittsburgh: 65,268 21. Austin: 59,583——————-21. Akron: 60,653—————-21. Akron: 61,461 22. Minneapolis: 57,499————22. Las Vegas: 60,187———22. Dayton: 57,043 23. Omaha: 50,333——————23. Omaha: 55,086————-23. Omaha: 56,098 24. Grand Rapids: 40,408———24. Wichita: 42,662————-24. St. Paul: 51,737 25. Wichita: 39,165—————–25. Grand Rapids: 41,848—–25. Wichita: 40,756 26. Fort Wayne: 35,221———–26. St. Paul: 41,923————-26. Grand Rapids: 38,130 27. St. Paul: 34,903—————-27. Fort Wayne: 39,016——–27. Fort Wayne: 37,941 28. Portland: 30,828—————28. Portland: 37,355————28. Portland: 34,624 29. San Jose: 27,446————–29. San Jose: 29,831———-29. San Jose: 28,126 30. Providence: 18,794———–30. Des Moines: 19,962——-30. Providence: 27,274 31. Des Moines: 16,709———-31. Providence: 19,265——–31. Des Moines: 22,170 32. Madison: 12,660————–32. Madison: 17,560————32. Madison: 14,185 33. Lincoln: 7,082——————33. Lincoln: 9,023—————33. Lincoln: 11,487
Columbus moved up from 7th to 4th in total Black, non-Hispanic during the period. Surprisingly, quite a few cities have actually been losing this demographic since 2010 at least.
Rank by City of Total Asian, non-Hispanic Population by Year 2005————————————-2010——————————————2017 1. San Jose: 269,186————–1. San Jose: 303,227—————–1. San Jose: 366,134 2. Chicago: 127,686—————-2. Chicago: 148,280——————2. Chicago: 179,176 3. Sacramento: 80,307————3. Sacramento: 84,556————-3. Sacramento: 93,476 4. Portland: 36,278—————–4. Austin: 46,575———————-4. Austin: 71,539 5. Austin: 35,239——————–5. Portland: 43,185——————-5. St. Paul: 61,082 6. St. Paul: 35,184——————6. St. Paul: 41,989——————-6. Charlotte: 55,142 7. Columbus: 27,125—————7. Las Vegas: 37,406—————7. Columbus: 53,027 8. Las Vegas: 25,077————–8. Charlotte: 37,181—————–8. Portland: 52,219 9. Charlotte: 23,356—————-9. Columbus: 35,468—————-9. Las Vegas: 44,735 10. Virginia Beach: 22,501——10. San Antonio: 29,200———–10. San Antonio: 38,119 11. San Antonio: 20,492———11. Virginia Beach: 27,303—–11. Virginia Beach: 29,735 12. Minneapolis: 20,189———12. Milwaukee: 22,670————–12. Minneapolis: 26,833 13. Milwaukee: 19,596———–13. Minneapolis: 21,426————13. Indianapolis: 26,548 14. Nashville: 16,943————-14. Wichita: 19,420——————14. Milwaukee: 25,624 15. Wichita: 15,417—————15. Indianapolis: 17,137————15. Madison: 24,455 16. Madison: 12,708————–16. Nashville: 17,045—————16. Nashville: 24,034 17. Indianapolis: 12,312———17. Madison: 16,671—————-17. Wichita: 19,548 18. Providence: 10,751———-18. Pittsburgh: 12,036————–18. Pittsburgh: 19,357 19. Pittsburgh: 10,727————19. Providence: 11,497————19. Omaha: 17,412 20. Kansas City: 10,674———20. Lincoln: 10,452——————20. Des Moines: 17,143 21. Detroit: 9,577——————21. Kansas City: 10,263———–21. Kansas City: 15,213 22. Des Moines: 8,796———–22. Des Moines: 8,867————-22. Fort Wayne: 14,039 23. Lincoln: 7,513—————–23. St. Louis: 8,717—————–23. Lincoln: 13,992 24. St. Louis: 7,046—————24. Omaha: 8,397——————-24. Orlando: 11,852 25. Omaha: 6,971—————–25. Orlando: 7,870——————25. Detroit: 11,790 26. Cincinnati: 6,874————-26. Fort Wayne: 6,945————–26. St. Louis: 10,404 27. Cleveland: 6,289————27. Detroit: 6,549———————27. Providence: 9,361 28. Orlando: 5,528—————28. Cincinnati: 5,938—————-28. Cleveland: 9,217 29. Fort Wayne: 4,241———-29. Cleveland: 5,392—————-29. Akron: 8,007 30. Toledo: 4,150—————-30. Akron: 4,567———————30. Cincinnati: 7,906 31. Akron: 3,497—————–31. Grand Rapids: 3,695———–31. Grand Rapids: 7,056 32. Grand Rapids: 2,847——32. Toledo: 3,125——————–32. Toledo: 3,679 33. Dayton: 1,827—————33. Dayton: 1,231——————–33. Dayton: 848
Columbus maintained its rank since 2005.
Rank by City of Total Hispanic Population by Year 2005——————————————–2010————————————2017 1. Chicago: 778,234—————1. San Antonio: 853,654———-1. San Antonio: 969,065 2. San Antonio: 735,458———–2. Chicago: 763,968—————2. Chicago: 787,978 3. San Jose: 279,420————–3. San Jose: 318,389————–3. San Jose: 332,603 4. Austin: 223,361——————4. Austin: 288,130——————4. Austin: 324,973 5. Las Vegas: 153,813————5. Las Vegas: 181,923————-5. Las Vegas: 219,220 6. Sacramento: 111,559———6. Sacramento: 124,461———–6. Sacramento: 141,752 7. Milwaukee: 80,945————-7. Milwaukee: 104,619————-7. Milwaukee: 133,812 8. Providence: 60,008————-8. Charlotte: 96,246—————-8. Charlotte: 122,904 9. Charlotte: 58,466—————9. Indianapolis: 78,467————-9. Indianapolis: 93,042 10. Wichita: 49,928—————10. Providence: 76,645————10. Orlando: 86,305 11. Indianapolis: 47,764———11. Nashville: 61,212—————11. Providence: 77,893 12. Detroit: 46,993—————-12. Wichita: 59,823——————12. Nashville: 69,574 13. Orlando: 43,978————–13. Portland: 58,986—————–13. Wichita: 68,389 14. Portland: 43,324————–14. Orlando: 56,061—————–14. Portland: 67,551 15. Omaha: 39,674—————15. Omaha: 53,661——————15. Omaha: 66,056 16. Nashville: 37,463————-16. Kansas City: 49,800————16. Columbus: 55,782 17. Minneapolis: 37,017———17. Detroit: 45,580——————-17. Detroit: 48,328 18. Kansas City: 35,995———18. Columbus: 43,276————–18. Cleveland: 47,962 19. Grand Rapids: 32,368——19. Cleveland: 36,067————–19. Minneapolis: 46,375 20. Cleveland: 32,085———–20. Minneapolis: 34,504———–20. Kansas City: 45,975 21. Columbus: 24,607———–21. Grand Rapids: 30,659——21. Virginia Beach: 36,723 22. St. Paul: 22,402————–22. Virginia Beach: 29,206—–22. Grand Rapids: 32,016 23. Virginia Beach: 20,803—–23. St. Paul: 28,725————–23. Des Moines: 31,333 24. Des Moines: 18,952——–24. Des Moines: 23,832———-24. St. Paul: 30,007 25. Toledo: 18,404————–25. Toledo: 21,346——————25. Fort Wayne: 24,724 26. Fort Wayne: 16,438——-26. Fort Wayne: 19,576————26. Toledo: 22,796 27. Madison: 11,997———–27. Lincoln: 16,007——————27. Lincoln: 21,921 28. Lincoln: 9,672—————28. Madison: 14,062—————28. Madison: 20,741 29. St. Louis: 8,268————-29. St. Louis: 11,207————–29. St. Louis: 12,447 30. Pittsburgh: 5,018———-30. Cincinnati: 8,710—————30. Cincinnati: 11,787 31. Cincinnati: 3,855———–31. Pittsburgh: 7,282————–31. Pittsburgh: 9,212 32. Akron: 3,485—————-32. Akron: 3,990——————–32. Dayton: 5,765 33. Dayton: 1,693————–33. Dayton: 3,180——————-33. Akron: 5,536
Columbus moved up from 21st to 16th in the total Hispanic population.
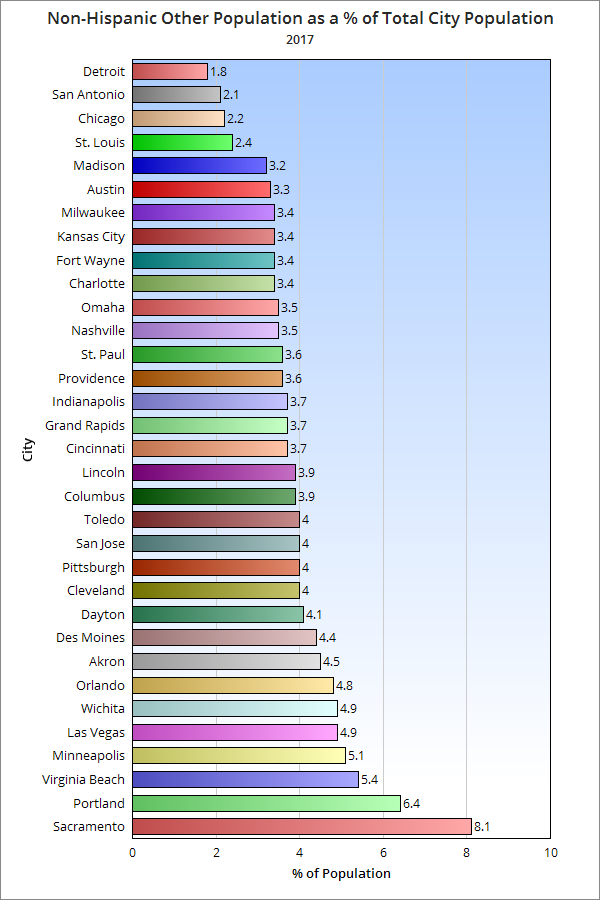
Rank by City of Total Other, non-Hispanic Population by Year 2005——————————————-2010—————————————–2017 1. Chicago: 38,694—————1. Chicago: 37,379——————–1. Chicago: 58,721 2. San Jose: 29,456————2. San Jose: 32,439——————–2. Portland: 41,595 3. Sacramento: 21,370———-3. Sacramento: 30,900—————3. San Jose: 41,175 4. Portland: 21,164————–4. Portland: 28,027———————4. Sacramento: 40,066 5. Indianapolis: 20,242———-5. Las Vegas: 24,521—————–5. Columbus: 34,467 6. Columbus: 20,096————-6. Columbus: 23,738—————–6. Indianapolis: 32,525 7. San Antonio: 19,130———-7. San Antonio: 20,778————–7. Las Vegas: 31,889 8. Minneapolis: 18,580———-8. Minneapolis: 20,753————–8. San Antonio: 31,341 9. Detroit: 18,324—————–9. Virginia Beach: 20,268———-9. Austin: 30,541 10. Las Vegas: 18,304———-10. Indianapolis: 20,086———-10. Charlotte: 28,632 11. Virginia Beach: 16,685—-11. Charlotte: 18,360————–11. Virginia Beach: 24,458 12. Milwaukee: 14,476———-12. Detroit: 16,776—————–12. Nashville: 23,334 13. Kansas City: 13,399——–13. Milwaukee: 16,311———–13. Minneapolis: 21,808 14. Austin: 13,261—————-14. Wichita: 16,091—————14. Milwaukee: 20,166 15. Charlotte: 11,771————-15. Omaha: 15,519————–15. Wichita: 18,763 16. Wichita: 11,545—————16. Austin: 14,915—————-16. Kansas City: 16,743 17. Omaha: 8,552—————–17. Kansas City: 14,668——–17. Omaha: 15,988 18. St. Paul: 7,741—————-18. Nashville: 14,227————18. Cleveland: 15,586 19. Toledo: 7,447—————–19. St. Paul: 13,098————–19. Orlando: 13,429 20. Cincinnati: 7,315————-20. Pittsburgh: 11,280———–20. Detroit: 12,461 21. Cleveland: 7,004————-21. Toledo: 10,134—————21. Pittsburgh: 11,890 22. Providence: 6,488———–22. Akron: 9,020——————22. St. Paul: 11,220 23. Pittsburgh: 6,138————23. Fort Wayne: 8,513———–23. Fort Wayne: 11,180 24. St. Louis: 6,058————–24. Cleveland: 8,276————-24. Lincoln: 11,037 25. Fort Wayne: 5,774———-25. St. Louis: 7,704————–25. Toledo: 11,009 26. Orlando: 5,731—————26. Lincoln: 7,483—————-26. Cincinnati: 10,995 27. Nashville: 5,687————-27. Grand Rapids: 7,376——–27. Des Moines: 9,627 28. Madison: 4,708————–28. Orlando: 7,251—————28. Akron: 8,894 29. Lincoln: 4,508—————-29. Cincinnati: 7,230————29. Madison: 8,292 30. Akron: 4,431—————–30. Madison: 7,177————–30. St. Louis: 7,543 31. Grand Rapids: 4,154——31. Providence: 6,471———–31. Grand Rapids: 7,260 32. Des Moines: 2,674———32. Des Moines: 5,598———-32. Providence: 6,539 33. Dayton: 1,382—————33. Dayton: 3,025—————-33. Dayton: 5,629
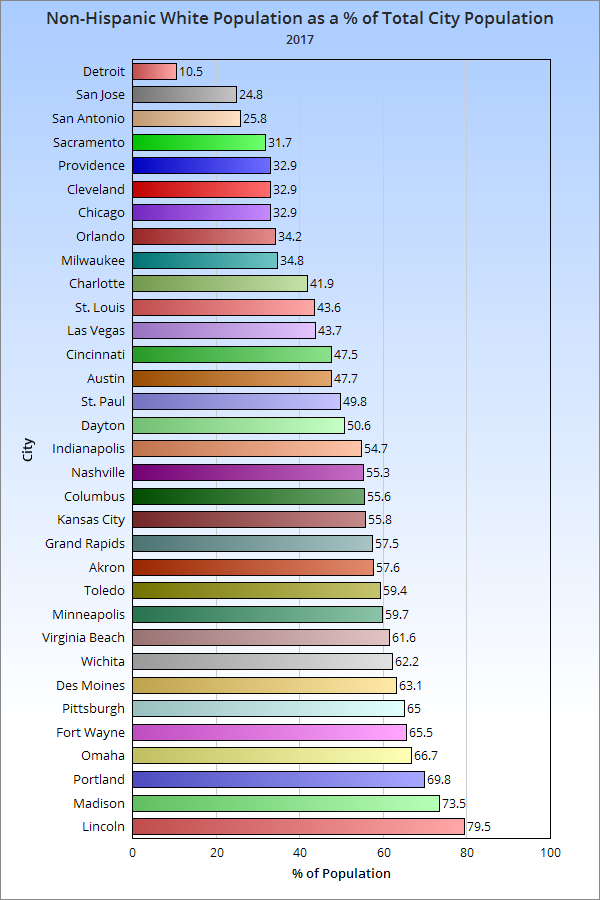
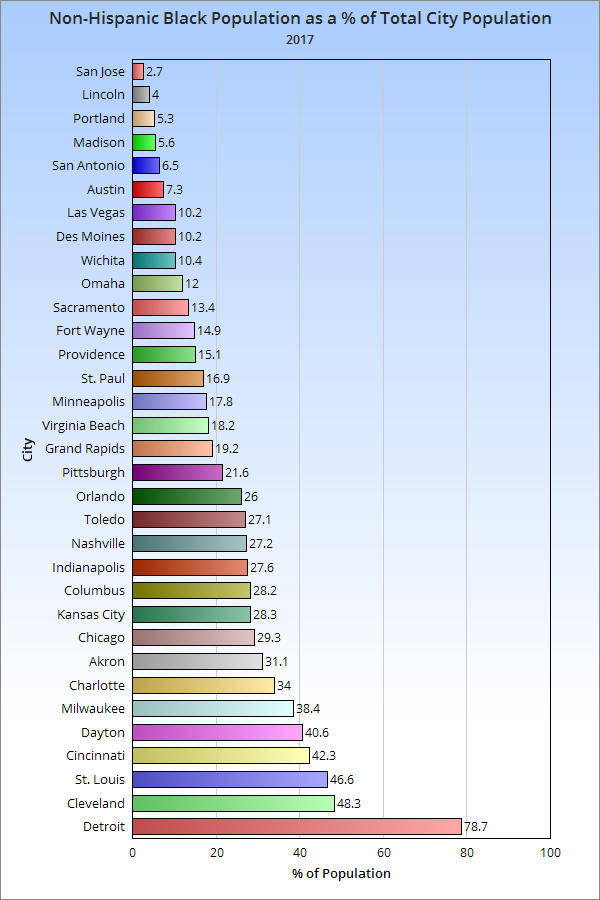
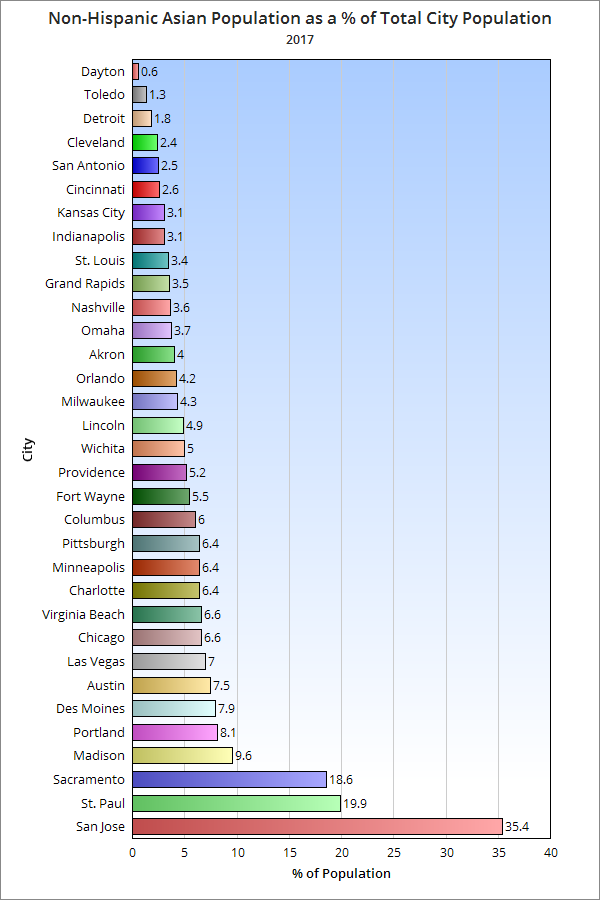
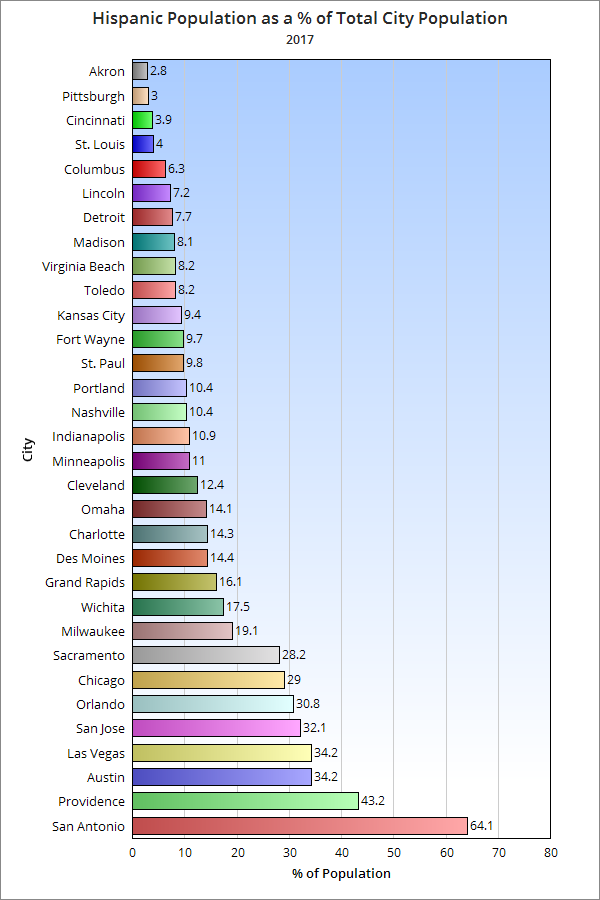
Finally, Columbus moved up from 6th to 5th in the total of Other, non-Hispanic population. Overall, Columbus ranks fairly well in totals vs. its peers, as one might expect given that it is one of the largest cities in the grouping. However, to truly find out how it compares with these other cities, you have to look at percentages, which tells how much of the city’s population is made up of each group. Columbus ranks in the middle of the pack for its % of Non-Hispanic White population. Like in most cities, even while this demographic is growing in total numbers in Columbus, the % of total population continues to fall. Columbus ranked in the top 3rd of peer cities for its % of Non-Hispanic Black population. Columbus also ranked in the top 3rd for its Non-Hispanic Asian population. Columbus ranks poorly with Hispanics in the group, ranking near the bottom. Finally, Columbus ranks in the middle for its Non-Hispanic Other population.
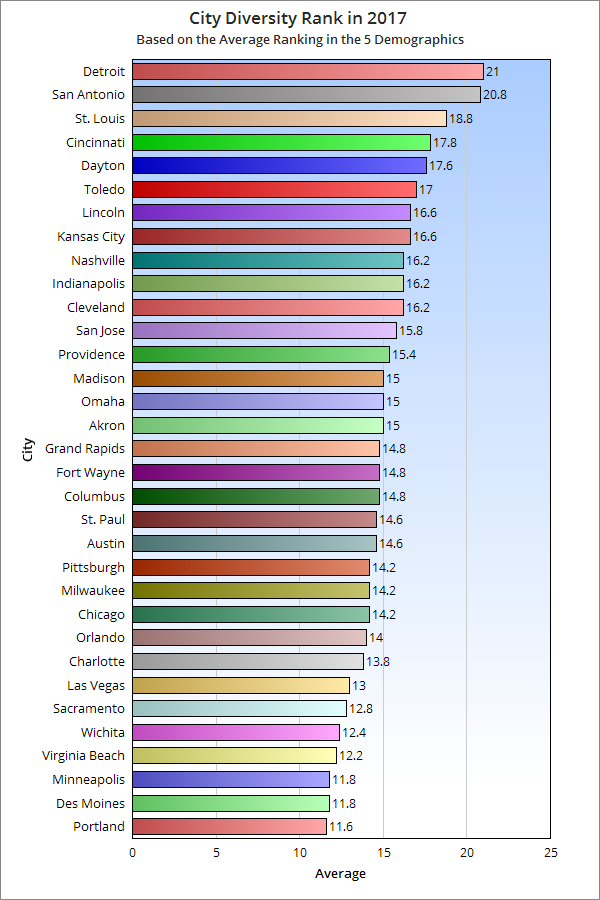
So what’s the final ranking for where Columbus is with diversity compared to its peers in 2017? To find out, I assigned points based on ranked position in each 5 racial categories and took the average of the positions in each 5. The result is that the higher the average number, the lower the overall diversity. So based on this, Columbus ranks in the top half of national and Midwest peers for diversity.
*Note: Normally, Youngstown would be included, but the data was not available.
Given that the 2017 demographic information was released yesterday by the US Census, it’s time to revisit this Columbus foreign-born population comparison and update it with the new data.
First up, let’s take a look at total foreign-born populations. I have looked at this topic some in the past, but I have never done a full-scale comparison for this topic.
Total Foreign-Born Population Rank by City 2000, 2010 and 2017 2000—————————————-2010———————————-2017 1. Chicago, IL: 628,903———–1. Chicago: 557,674—————1. Chicago: 563,688 2. San Jose, CA: 329,750——–2. San Jose: 366,194————-2. San Jose: 417,148 3. San Antonio, TX: 133,675—-3. San Antonio: 192,741———-3. San Antonio: 212,109 4. Austin, TX: 109,006————4. Austin: 148,431——————4. Austin: 177,844 5. Las Vegas, NV: 90,656——-5. Las Vegas: 130,503————-5. Charlotte: 147,074 6. Sacramento, CA: 82,616—–6. Chalotte: 106,047—————6. Las Vegas: 139,790 7. Portland, OR: 68,976———7. Sacramento: 96,105————-7. Sacramento: 111,904 8. Charlotte, NC: 59,849——–8. Columbus: 86,663—————-8. Columbus: 105,826 9. Minneapolis, MN: 55,475—–9. Portland: 83,026—————–9. Indianapolis: 89,465 10. Columbus: 47,713———–10. Indianapolis: 74,407———–10. Portland: 89,050 11. Milwaukee, WI: 46,122—–11. Nashville: 73,327—————11. Nashville: 86,271 12. Detroit, MI: 45,541———–12. Minneapolis: 57,846———–12. Minneapolis: 69,567 13. Providence, RI: 43,947—–13. Milwaukee: 57,222————-13. Orlando: 68,811 14. St. Paul, MN: 41,138——-14. Providence: 52,920————14. St. Paul: 64,056 15. Nashville, TN: 38,936——-15. St. Paul: 50,366—————-15. Milwaukee: 59,443 16. Indianapolis, IN: 36,067—-16. Orlando: 43,747—————-16. Providence: 54,520 17. Virginia Beach, VA: 28,276–17. Virginia Beach: 40,756—–17. Omaha: 51,041 18. Wichita, KS: 27,938———18. Omaha: 39,288—————18. Virginia Beach: 42,319 19. Orlando, FL: 26,741——–19. Wichita: 39,128—————–19. Detroit: 41,374 20. Omaha, NE: 25,687———-20. Kansas City: 35,532———20. Wichita: 40,427 21. Kansas City, MO: 25,632—21. Detroit: 34,307—————-21. Kansas City: 37,833 22. Cleveland: 21,372————22. Madison: 24,929————–22. Madison: 32,066 23. Grand Rapids, MI: 20,814—23. St. Louis: 23,011————23. Des Moines: 29,876 24. St Louis, MO: 19,542——–24. Lincoln: 22,214—————24. Pittsburgh:26,504 25. Pittsburgh, PA: 18,874——-25. Des Moines: 20,798——–25. Grand Rapids: 26,014 26. Madison, WI: 18,792———26. Pittsburgh: 18,698———–26. Lincoln: 25,689 27. Des Moines, IA: 15,713—–27. Cleveland: 17,739————27. St. Louis: 23,659 28. Lincoln, NE: 13,246———-28. Grand Rapids: 16,615——-28. Fort Wayne: 22,186 29. Cincinnati: 12,461————29. Cincinnati: 16,531————29. Cleveland: 21,992 30. Fort Wayne, IN: 10,187—–30. Fort Wayne: 15,286———30. Cincinnati: 19,085 31. Toledo: 9,475——————31. Toledo: 11,159—————31. Akron: 13,423 32. Akron: 6,911——————-32. Akron: 8,524——————-32. Toledo: 11,260 33. Dayton: 3,245—————–33. Dayton: 5,102——————33. Dayton: 6,743 34. Youngstown: 1,605———-34. Youngstown: 3,695———–34. Youngstown: 1,401
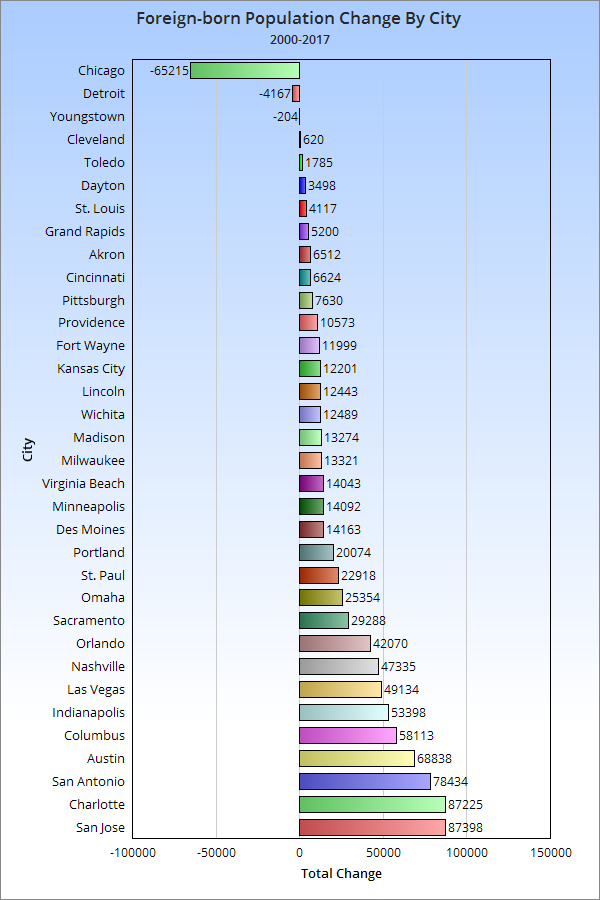
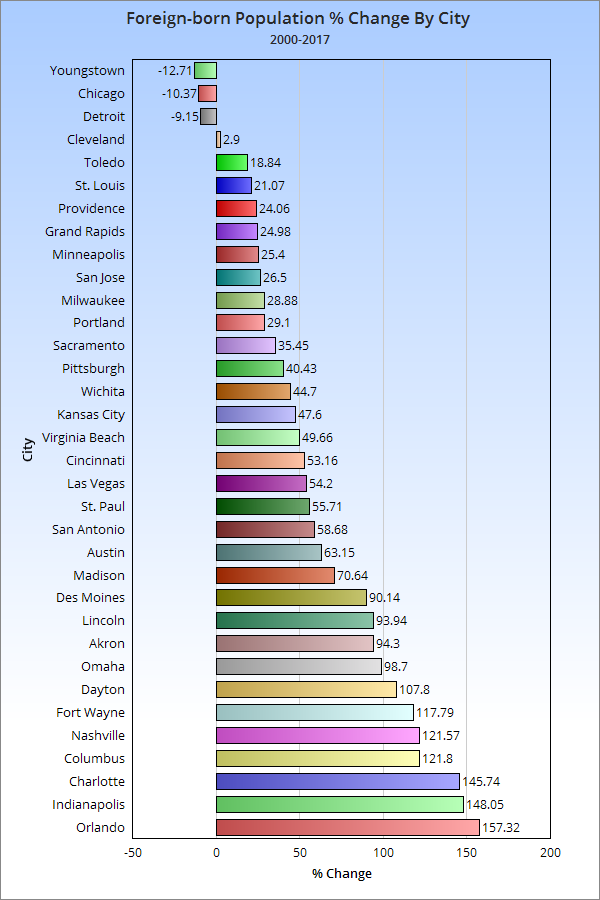
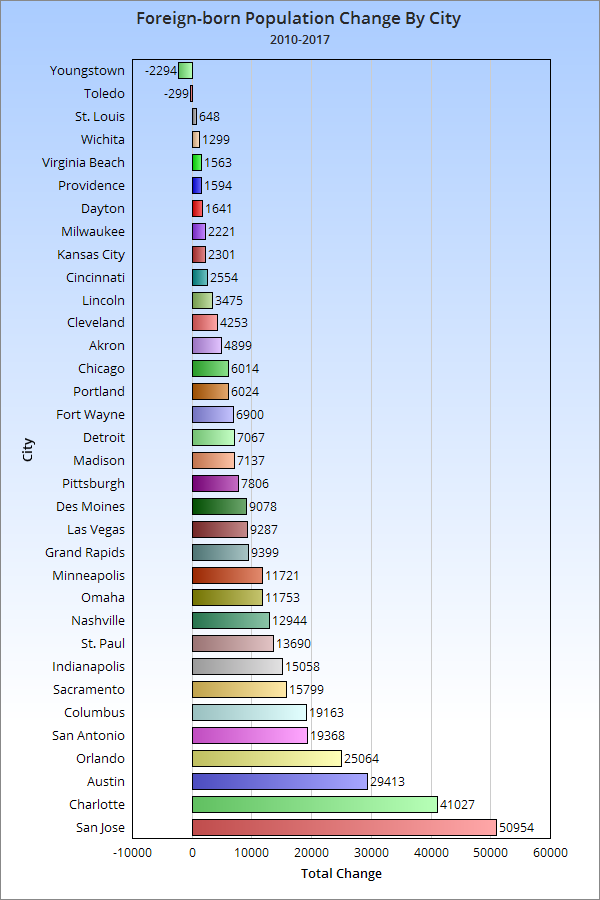
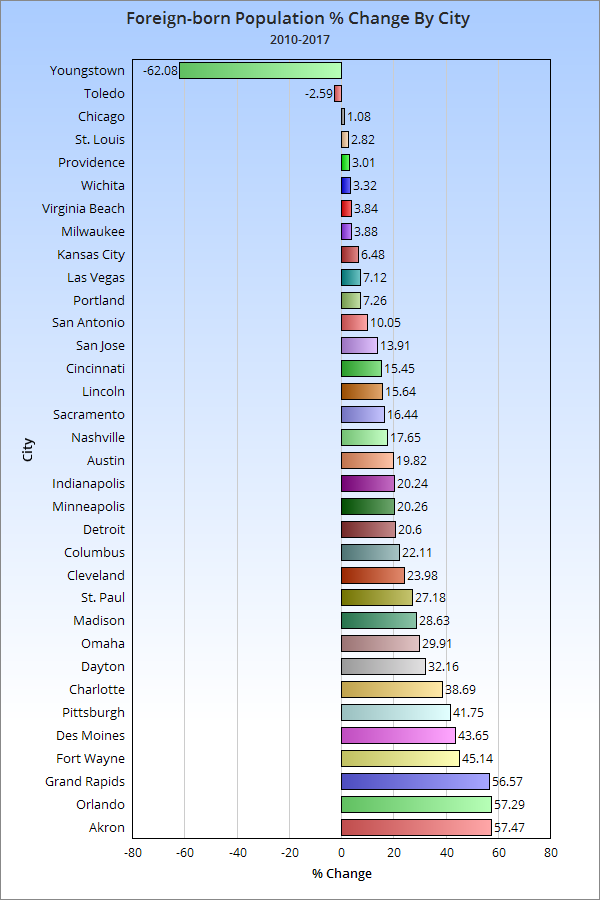
Here’s the 2000-2017 total change. And the 2000-2017 change by %.
So Columbus has had above average total and % growth compared to its peers nationally since 2000. What about more recently?
Total change 2010-2017. And the 2010-2017 change by %. So now that we know how many foreign-born immigrants are arriving, let’s take a look at where they are coming from.
Total Foreign-Born Residents From Europe in 2000 and 2017 2000———————————————–2017 1. Chicago: 145,462———————1. Chicago: 96,656 2. San Jose: 21,904———————2. San Jose: 25,147 3. Portland: 17,572———————-3. Portland: 16,548 4. Las Vegas: 9,070———————4. Austin: 13,337 5. Cleveland: 8,796———————-5. Charlotte: 9,775 6. St. Louis: 8,543———————–6. Las Vegas: 8,536 7. San Antonio: 8,323——————7. San Antonio: 7,852 8. Sacramento: 8,204——————8. Virginia Beach: 7,368 9. Milwaukee: 7,841——————–9. Columbus: 6,860 10. Charlotte: 7,487——————–10. Indianapolis: 6,344 11. Austin: 7,474————————11. Sacramento: 6,008 12. Pittsburgh: 7,413——————-12. Nashville: 5,778 13. Columbus: 7,017——————-13. Orlando: 5,516 14. Indianapolis: 6,543—————-14. Minneapolis: 5,477 15. Virginia Beach: 6,333————-15. Milwaukee: 4,388 16. Detroit: 5,600————————16. Pittsburgh: 4,265 17. Minneapolis: 5,409—————–17. Providence: 4,022 18. Providence: 5,126——————18. Lincoln: 3,908 19. Nashville: 4,859——————–19. St. Louis: 3,680 20. Cincinnati: 3,851——————-20. Cincinnati: 3,556 21. Grand Rapids: 3,396————–21. Omaha: 3,483 22. Omaha: 3,320———————–22. Cleveland: 3,399 23. St. Paul: 3,255———————-23. Kansas City: 3,362 24. Des Moines: 3,216—————-24. Madison: 2,867 25. Kansas City: 2,985—————-25. St. Paul: 2,394 26. Madison: 2,871——————–26. Detroit: 2,393 27. Lincoln: 2,701———————-27. Fort Wayne: 2,388 28. Akron: 2,687———————–28. Des Moines: 2,156 29. Orlando: 2,509——————–29. Wichita: 1,660 30. Fort Wayne: 2,076—————30. Grand Rapids: 1,517 31. Toledo: 2,020———————31. Akron: 1,286 32. Wichita: 2,004———————32. Toledo: 1,242 33. Dayton: 901———————–33. Dayton: 877 34. Youngstown: 870—————-34. Youngstown: 173
Columbus had a high number of Europeans versus most peers, but almost all cities saw drops in this demographic between 2000 and 2017, some quite drastic. Columbus’ drop was relatively minor.
Total Foreign-born Population from Asia 2000 and 2017 2000————————————————–2017 1. San Jose: 182,712—————————1. San Jose: 262,208 2. Chicago: 112,932—————————-2. Chicago: 140,434 3. Sacramento: 40,253————————-3. Austin: 57,584 4. Portland: 26,271——————————4. Sacramento: 53,731 5. Austin: 25,036——————————–5. Charlotte: 46,698 6. St. Paul: 23,245——————————6. Columbus: 43,706 7. Columbus: 22,354—————————7. San Antonio: 40,642 8. Minneapolis: 17,376————————8. Portland: 38,224 9. Las Vegas: 17,062————————–9. Las Vegas: 35,087 10. San Antonio: 15,840———————-10. St. Paul: 34,678 11. Charlotte: 15,734————————–11. Nashville: 26,155 12. Virginia Beach: 15,176——————-12. Indianapolis: 23,934 13. Detroit: 15,114——————————13. Virginia Beach: 23,625 14. Nashville: 12,573—————————14. Madison: 18,795 15. Milwaukee: 12,114————————-15. Detroit: 18,681 16. Wichita: 10,826—————————–16. Milwaukee: 17,838 17. Madison: 9,736—————————–17. Minneapolis: 15,967 18. Indianapolis: 9,190————————-18. Pittsburgh: 15,873 19. Pittsburgh: 7,938—————————-19. Wichita: 15,466 20. Providence: 7,871————————–20. Omaha: 14,504 21. Kansas City: 7,312————————-21. Lincoln: 13,804 22. Lincoln: 6,691——————————-22. Kansas City: 12,043 23. St. Louis: 6,425—————————–23. Fort Wayne: 10,972 24. Omaha: 6,302——————————-24. Des Moines: 10,691 25. Cleveland: 6,213—————————25. St. Louis: 9,632 26. Des Moines: 5,239————————26. Orlando: 8,122 27. Orlando: 4,530—————————–27. Akron: 7,862 28. Cincinnati: 4,326————————–28. Cleveland: 7,450 29. Toledo: 3,847——————————29. Providence: 6,668 30. Grand Rapids: 3,206———————30. Grand Rapids: 6,585 31. Akron: 3,099——————————-31. Toledo: 6,196 32. Fort Wayne: 2,792————————32. Cincinnati: 6,002 33. Dayton: 903———————————33. Dayton: 1,614 34. Youngstown: 338————————–34. Youngstown: 448
Columbus ranks even higher with its foreign-born Asian population.
Total Foreign-born Population from Africa 2000 and 2017 2000—————————————————2017 1. Minneapolis: 12,765——————–1. Columbus: 33,607 2. Chicago: 12,613————————-2. Chicago: 26,995 3. Columbus: 9,530————————3. Minneapolis: 25,286 4. San Jose: 5,189————————-4. Nashville: 18,387 5. Charlotte: 4,722————————–5. Charlotte: 18,234 6. St. Paul: 4,697—————————-6. Indianapolis: 17,452 7. Nashville: 4,183————————–7. St. Paul: 15,926 8. Detroit: 3,249—————————–8. Omaha: 7,496 9. Providence: 3,138———————–9. San Jose: 7,400 10. Indianapolis: 2,650——————–10. Portland: 7,059 11. Portland: 2,430————————-11. Austin: 6,469 12. Austin: 2,263—————————-12. Des Moines: 6,124 13. Kansas City: 2,192——————–13. San Antonio: 5,718 14. Cincinnati: 1,781———————–14. Kansas City: 5,051 15. St. Louis: 1,500————————-15. St. Louis: 4,977 16. Omaha: 1,497—————————16. Providence: 4,697 17. San Antonio: 1,358——————–17. Milwaukee: 4,423 18. Milwaukee: 1,332———————-18. Cincinnati: 4,207 19. Cleveland: 1,075———————–19. Grand Rapids: 3,754 20. Sacramento: 1,051——————–20. Sacramento: 2,955 21. Des Moines: 1,038——————–21. Pittsburgh: 2,731 22. Madison: 991—————————22. Cleveland: 2,728 23. Orlando: 983—————————23. Orlando: 2,552 24. Wichita: 946—————————-24. Akron: 2,311 25. Las Vegas: 916———————–25. Madison: 2,180 26. Pittsburgh: 905————————26. Wichita: 2,142 27. Virginia Beach: 840——————27. Las Vegas: 1,846 28. Grand Rapids: 718——————-28. Lincoln: 1,680 29. Toledo: 638—————————-29. Dayton: 1,397 30. Lincoln: 637—————————30. Detroit: 1,082 31. Dayton: 522—————————-31. Virginia Beach: 847 32. Fort Wayne: 384———————-32. Fort Wayne: 628 33. Akron: 197—————————–33. Toledo: 615 34. Youngstown: 50———————-34. Youngstown: 0
Columbus has claimed the number 1 spot in its foreign-born African population, passing previous top city Minneapolis.
And finally, the total foreign-born population from the Americas in 2000 and 2017 2000—————————————————-2017 1. Chicago: 357,235————————–1. Chicago: 297,926 2. San Jose: 117,989————————2. San Antonio: 157,629 3. San Antonio: 107,906——————–3. San Jose: 120,657 4. Austin: 73,935——————————4. Austin: 99,482 5. Las Vegas: 63,277————————5. Las Vegas: 93,693 6. Charlotte: 31,625————————–6. Charlotte: 72,211 7. Sacramento: 28,927———————-7. Orlando: 52,421 8. Providence: 27,649———————–8. Sacramento: 42,632 9. Milwaukee: 24,781————————9. Indianapolis: 41,554 10. Detroit: 21,527—————————10. Providence: 39,093 11. Portland: 20,939————————-11. Nashville: 35,719 12. Minneapolis: 19,648——————–12. Milwaukee: 32,630 13. Orlando: 18,639————————-13. Portland: 25,417 14. Indianapolis: 17,530——————–14. Omaha: 25,385 15. Nashville: 17,125————————15. Minneapolis: 22,688 16. Omaha: 14,467————————–16. Columbus: 21,578 17. Wichita: 13,988—————————17. Wichita: 20,983 18. Grand Rapids: 13,477——————18. Detroit: 19,143 19. Kansas City: 12,948———————19. Kansas City: 17,377 20. St. Paul: 9,804—————————-20. Grand Rapids: 14,158 21. Columbus: 8,596————————21. St. Paul: 10,878 22. Des Moines: 6,201———————-22. Des Moines: 10,627 23. Virginia Beach: 5,754——————23. Virginia Beach: 10,415 24. Cleveland: 5,192————————24. Cleveland: 8,386 25. Madison: 5,080————————–25. Fort Wayne: 8,198 26. Fort Wayne: 4,930———————-26. Madison: 8,031 27. Lincoln: 3,106—————————-27. Lincoln: 6,190 28. St. Louis: 2,961————————–28. Cincinnati: 5,320 29. Toledo: 2,942—————————-29. St. Louis: 5,008 30. Pittsburgh: 2,463————————30. Pittsburgh: 3,443 31. Cincinnati: 2,432————————31. Toledo: 3,207 32. Dayton: 919——————————32. Dayton: 2,855 33. Akron: 891——————————-33. Akron: 1,699 34. Youngstown: 333———————–34. Youngstown: 780
Columbus does the worst with this group, but even here it moved up 5 spots in the rankings.
The rest of the foreign-born population is made up of small groups of people from Oceania- or basically island nations.
The US Census 2017 demographic estimates came out today for cities and counties, and they show that Columbus is continuing to change quickly.
Highlights for the City of Columbus -The non-Hispanic Asian population continues to skyrocket, up over 67% since 2010. -Beyond that, all other racial groups saw population growth within the city since 2010. -The foreign-born population has climbed above 105,000, and now represents 12% of the total population, the highest % level since 1890. -Every age group has increased since 2010, but the older working-age population increased the most, as seen below: 19 and Under: +17,962 20-34: +22,627 35-64: +32,045 65+: +22,234
Check out all of the City, County and Metro Area demographic and population data on the Demographics and Population page.
Okay, so a link on Census record transcribing may not be the coolest I’ve put on this site, but it may be one of the most important. The US Census records go back all the way to the 1700s, and a lot of these records have either not been digitized at all, or only rough copies exist in many different formats. Due to age, use, insect and water damage, etc., some of these records are in danger of disappearing forever. Many others are difficult to use because of the varying formats. Because of this, transcribing them into a standardized digital form is critical. This site allows anyone from the general public to choose individual records and volunteer to transcribe them digitally. No experience necessary! The site gives basic walkthroughs and other how-to information, so anyone can do it, and at their own speed in their free time. Just click on the state and area of your choice and go from there.