A little more than 4 years ago, I posted numbers on the recovery of Ohio downtowns, and what that might mean for the future. That post has proven to be one of the site’s most popular. I figured it was time to take a look at their continuing changes.
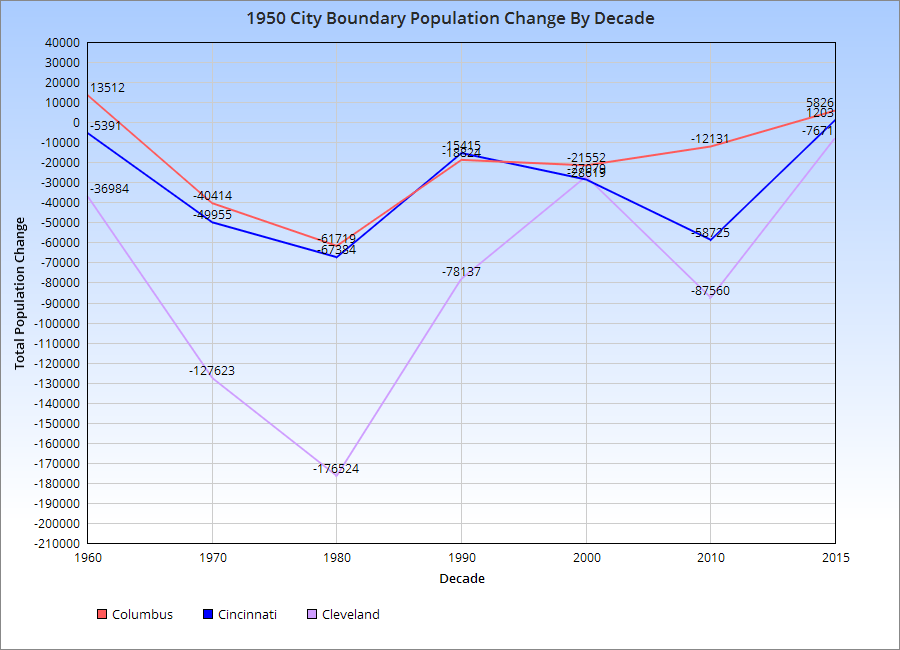
You can see by the chart for the 1950 Boundary population, the urban core of each city, that all 3-Cs suffered population losses post-1950. However, the rate of losses gradually declined, and 2 of the cities, Columbus and Cincinnati, appear to be growing in this boundary since at least 2010. Cleveland continues to lose.
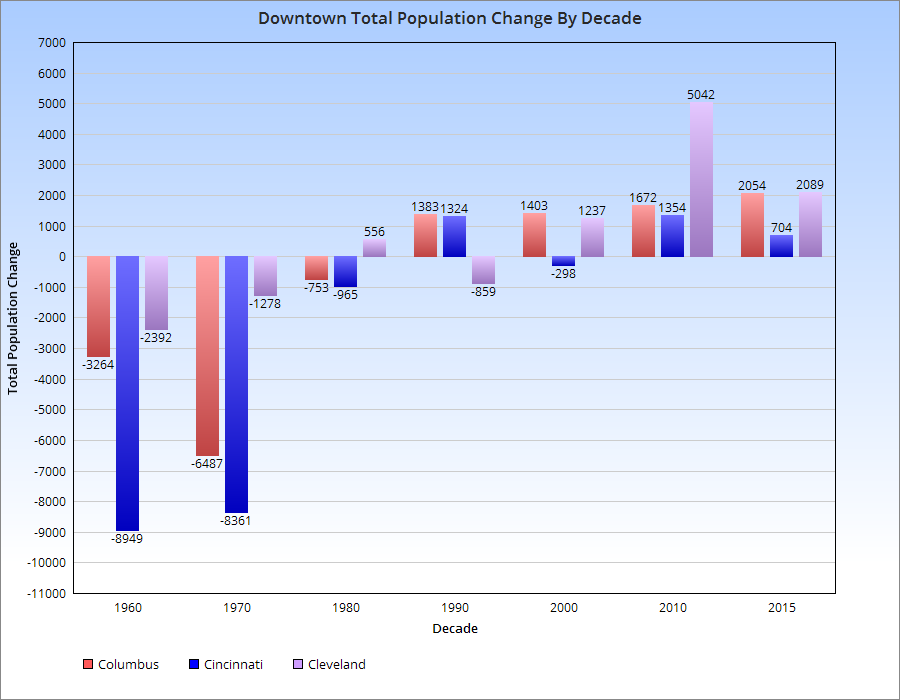
This is shown further by the chart below.
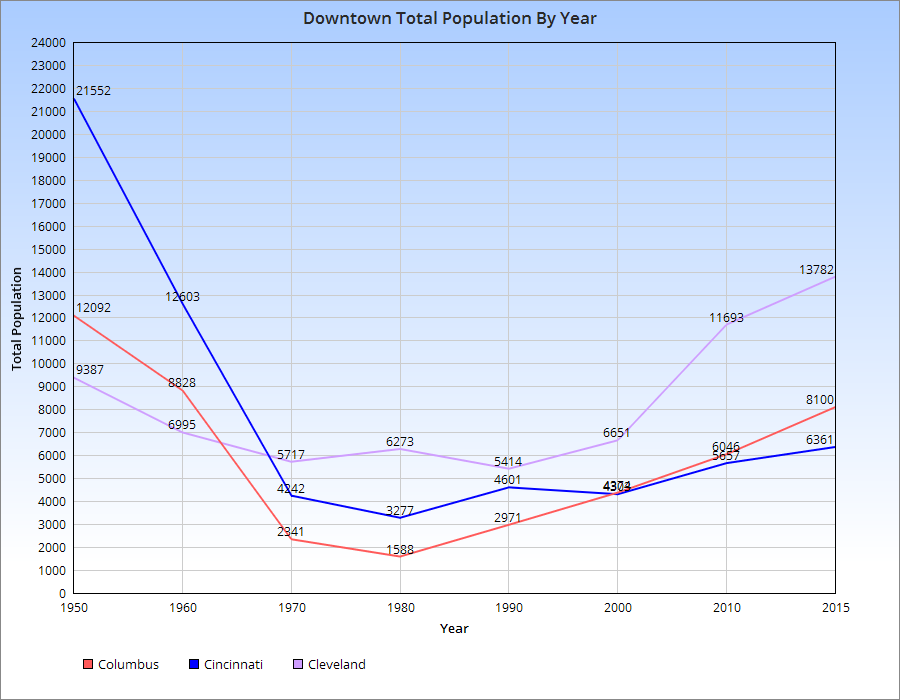
As far as the actual Downtowns of each, here are the population trends.
For the most part, population declines in the 3-Cs peaked around 1980, give or take a decade. Since then, all of them have seen increases, with Cleveland seeing the most rapid increase and Cincinnati the least. Columbus has seen steady, but increasingly rapid growth with each subsequent decade since 1980.
The Census just came out with 2015 demographic numbers for all places with at least 65,000 people. Given that half the decade is over, it’s a good point to look at where Columbus stands relative to its national/Midwest peers in a foreign-born comparison. A few days ago, I gave numbers for GDP. In the next few posts, I will look at the people that make up the populations of these places.
First up, let’s take a look at foreign-born populations. I have looked at this topic some in the past, but I have never done a full-scale comparison for this topic.
Total Foreign-Born Population Rank by City 2000, 2010 and 2015 2000—————————————-2010———————————-2015 1. Chicago, IL: 628,903———–1. Chicago: 557,674—————1. Chicago: 573,463 2. San Jose, CA: 329,750——–2. San Jose: 366,194————-2. San Jose: 401,493 3. San Antonio, TX: 133,675—-3. San Antonio: 192,741———-3. San Antonio: 208,046 4. Austin, TX: 109,006————4. Austin: 148,431——————4. Austin: 181,686 5. Las Vegas, NV: 90,656——-5. Las Vegas: 130,503————-5. Charlotte: 128,897 6. Sacramento, CA: 82,616—–6. Chalotte: 106,047—————6. Las Vegas: 127,609 7. Portland, OR: 68,976———7. Sacramento: 96,105————-7. Sacramento: 112,579 8. Charlotte, NC: 59,849——–8. Columbus: 86,663—————-8. Columbus: 101,129 9. Minneapolis, MN: 55,475—–9. Portland: 83,026—————–9. Nashville: 88,193 10. Columbus: 47,713———–10. Indianapolis: 74,407———–10. Portland: 86,041 11. Milwaukee, WI: 46,122—–11. Nashville: 73,327—————11. Indianapolis: 72,456 12. Detroit, MI: 45,541———–12. Minneapolis: 57,846———–12. Minneapolis: 70,769 13. Providence, RI: 43,947—–13. Milwaukee: 57,222————-13. Milwaukee: 58,321 14. Nashville, TN: 38,936——-14. Providence: 52,926————14. Providence: 53,532 15. Indianapolis, IN: 36,067—-15. Orlando: 43,747—————-15. Orlando: 50,558 16. Virginia Beach, VA: 28,276–16. Virginia Beach: 40,756—–16. Omaha: 48,263 17. Orlando, FL: 26,741———17. Omaha: 39,288—————–17. Detroit: 39,861 18. Omaha, NE: 25,687———18. Kansas City: 35,532———18. Virginia Beach: 38,360 19. Kansas City, MO: 25,632—19. Detroit: 34,307—————-19. Kansas City: 37,787 20. Cleveland: 21,372————20. St. Louis: 23,011————–20. Pittsburgh: 28,187 21. Grand Rapids, MI: 20,814–21. Pittsburgh: 18,698————21. St. Louis: 21,802 22. St Louis, MO: 19,542——-22. Cleveland: 17,739————-22. Grand Rapids: 19,176 23. Pittsburgh, PA: 18,874—–23. Grand Rapids: 16,615——–23. Cleveland: 18,830 24. Cincinnati: 12,461———–24. Cincinnati: 16,531————-24. Cincinnati: 16,896 25. Toledo: 9,475—————–25. Toledo: 11,559—————–25. Akron: 10,024 26. Akron: 6,911——————26. Akron: 8,524——————–26. Toledo: 9,257 27. Dayton: 3,245—————-27. Dayton: 5,102——————-27. Dayton: 7,381 28. Youngstown: 1,605———28. Youngstown: 3,695————28. Youngstown: 1,058
Here’s the 2000-2015 total change.
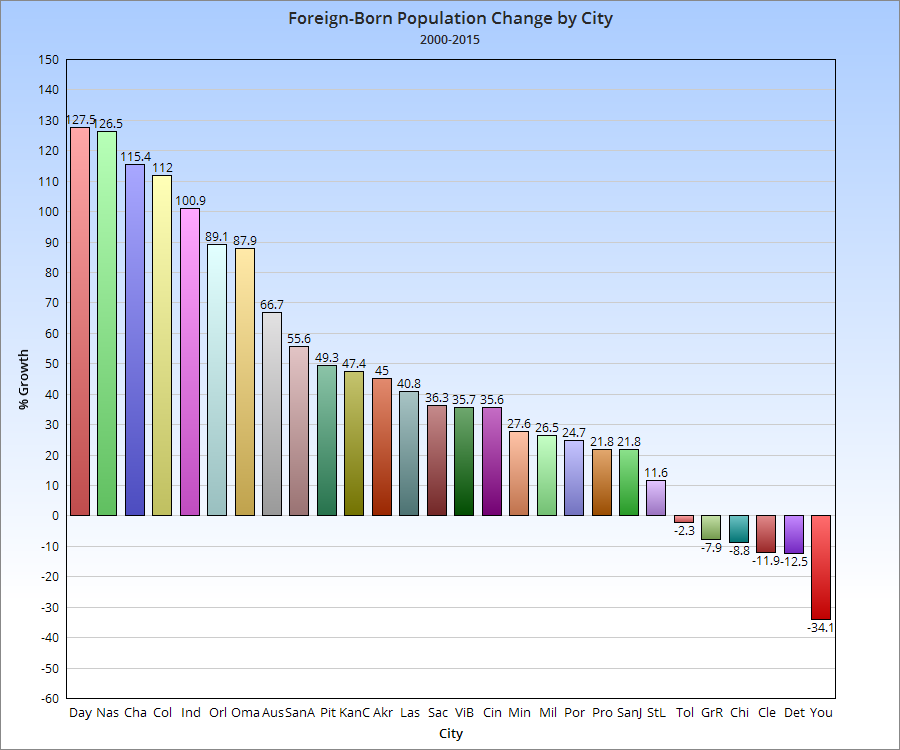
And the 2000-2015 change by %.
So Columbus has an above average total and growth compared to its peers nationally.