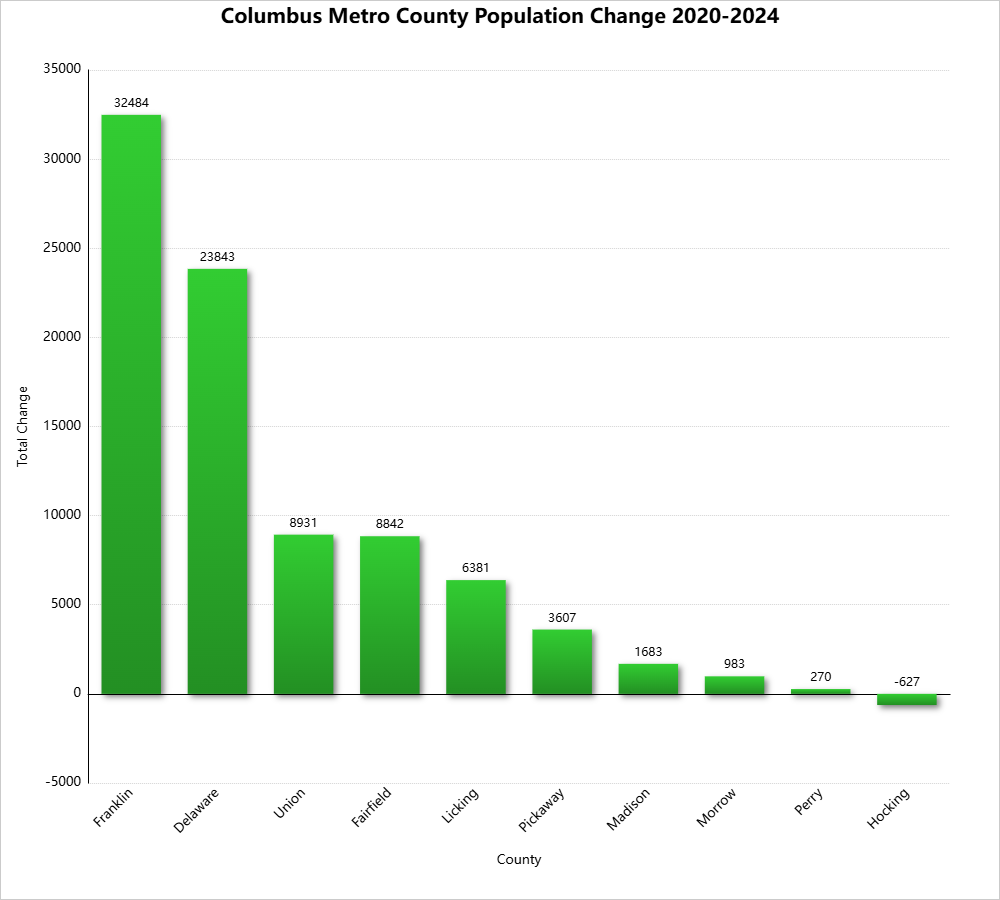
The US Census has released 2024 county and metro population estimates. The estimates generally show a further continuation of the post-pandemic recovery in the numbers. In fact, older estimates have also been revised upwards. Let’s break down the numbers.
Metro County
2020 Census
2023 Population
2024 Population
Delaware
214,123
232,732
237,966
Fairfield
158,920
165,630
167,762
Franklin
1,323,819
1,338,903
1,356,303
Hocking
28,056
27,567
27,429
Licking
178,517
183,540
184,898
Madison
43,848
44,668
45,531
Morrow
34,944
35,583
35,927
Perry
35,412
35,577
35,682
Pickaway
58,551
61,064
62,158
Union
62,790
69,765
71,721
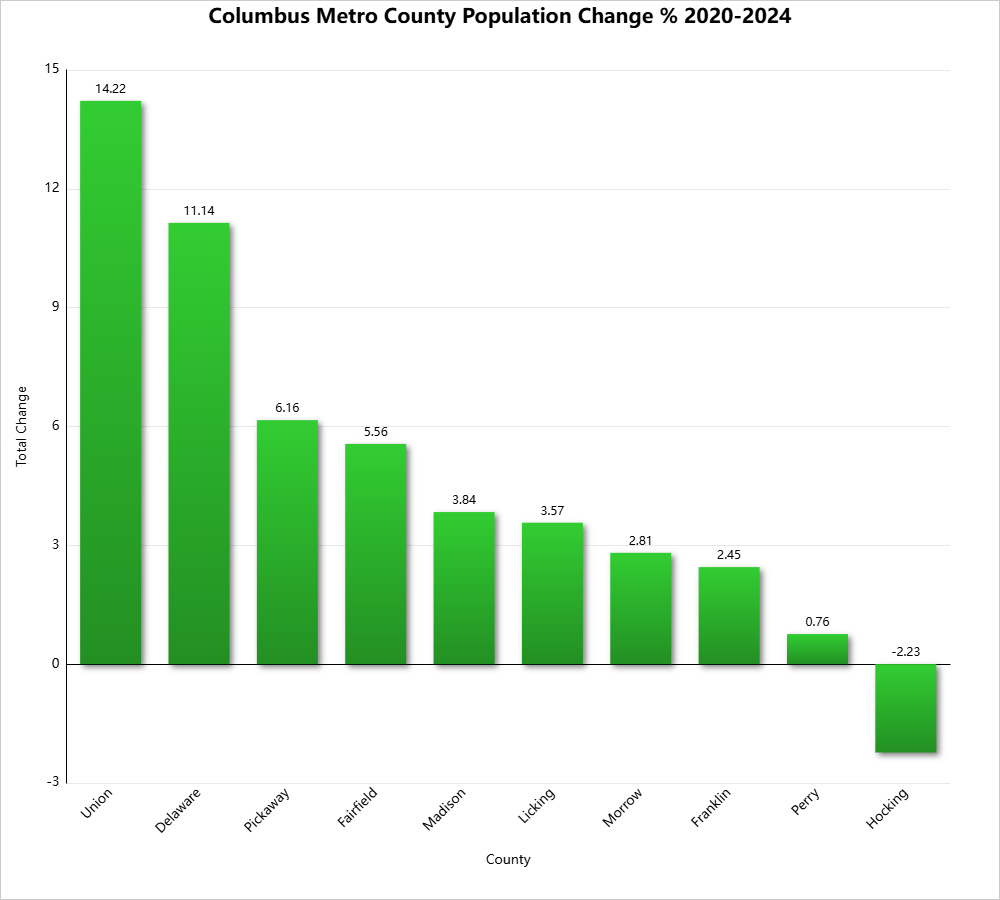
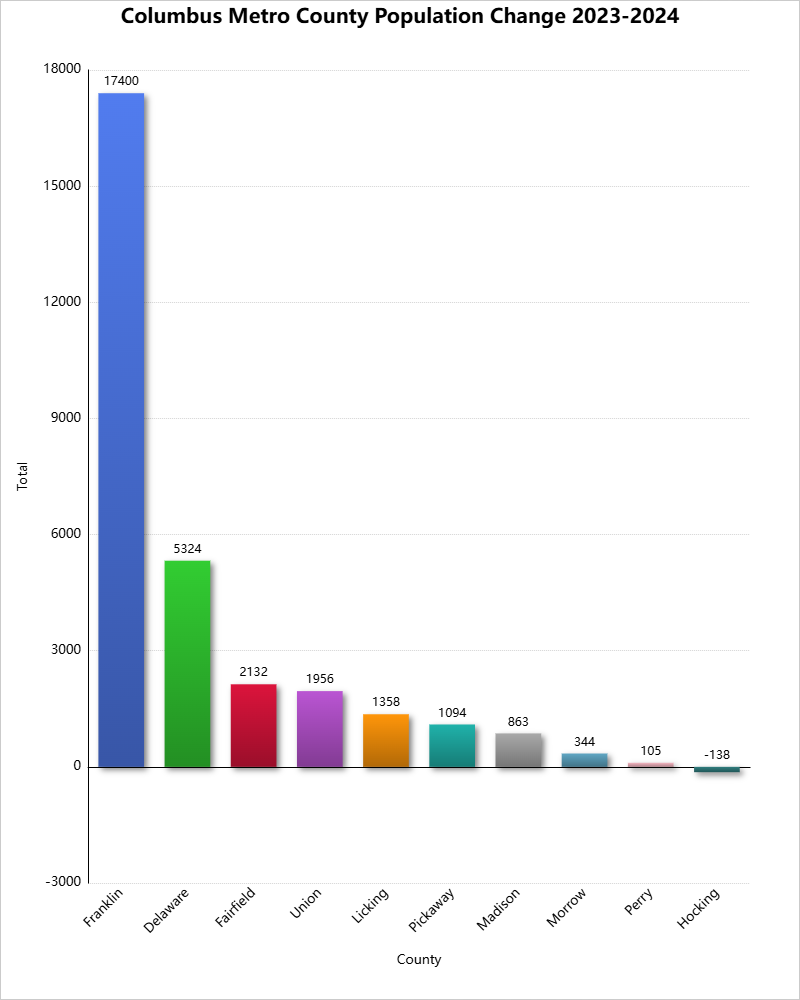
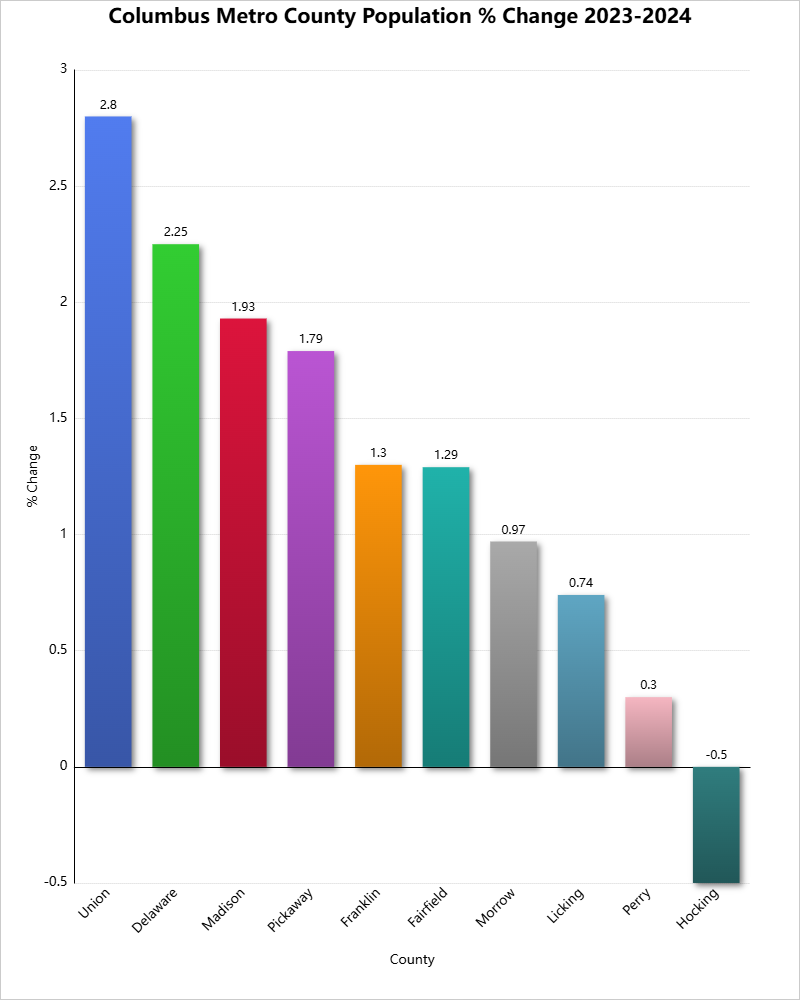
As you can see, all counties but Hocking grew in both the 2020-2024 and 2023-2024 periods. Most of the estimates were improvements over the 2023 version, as mentioned. For example, Franklin County’s estimates population in 2023 was 1,326,063, but the 2024 version for 2023 was revised to 1,338,903, indicating growth was significantly stronger than originally estimated.
Franklin County continued its very long run of being the top county in the metro for total growth.
The Census has just released 2019 city population estimates. These estimates are good for July 1, 2019. Let’s take a look at how Columbus compares to other cities in Ohio.
In 2010, 4 Columbus metro communities were in the top 30. By last year, 6 were, with more poised to enter the list in the coming years. This represents the Columbus region’s growing influence in the state and how its share of the state’s population continues to increase.
2018 to 2019, Columbus had 12 cities in the top 30, a lower number than the average of the decade. This is not necessarily indicating a slowdown in growth within the metro, however. The final year before a decennial census, population estimates tend to be used for final adjustments. This means that if a city is thought to have been estimated too high or too low through the decade, the final estimate year is adjusted accordingly and not necessarily according to true growth. The point of estimates is to get a snapshot of the population at the time of the estimate, but they are constantly being changed every time a new estimate comes out. This usually leaves the final estimate year as showing the slowest growth. This was true for 2008-2009 as well.
Out of the 101 communities of any size in the Metro, 81 of them have either steady populations or estimated growth since 2010. Most of the 20 that have shown declines are very small communities in the Appalachia counties of Perry and Hocking, the furthest removed from Columbus’ influence.
The Census has released 2019 metro population estimates. This comparison uses those figures to rank the Columbus metro with other metros under the following categories: Ohio metros with at least 250,000 people. Midwest metros with at least 500,000 people. National metros with 1.5-2.599 million people.
Total Metro Area Population Census 2010, July 1, 2018 and July 1, 2019 Census 2010——————————-July 1, 2018————————July 1, 2019 1. Chicago, IL: 9,461,105————-1. Chicago: 9,484,158———–1. Chicago: 9,458,539 2. Detroit, MI: 4,296,250—————2. Detroit: 4,322,084————-2. Detroit: 4,319,629 3. Minneapolis, MN: 3,348,8459—-3. Minneapolis: 3,610,061–3. Minneapolis: 3,640,043 4. St. Louis, MO: 2,787,701———-4. St. Louis: 2,803,958———4. St. Louis: 2,803,228 5. Pittsburgh, PA: 2,356,285——5. San Antonio: 2,512,379—5. San Antonio: 2,550,960 6. San Juan, PR: 2,350,126———-6. Portland: 2,473,350———6. Portland: 2,492,412 7. Portland, OR: 2,226,009——-7. Sacramento: 2,341,940—–7. Sacramento: 2,363,730 8. Sacramento, CA: 2,149,127—–8. Pittsburgh: 2,322,653——–8. Pittsburgh: 2,317,600 9. San Antonio, TX: 2,142,516—–9. Las Vegas: 2,226,115——-9. Las Vegas: 2,266,715 10. Cincinnati: 2,114,580———–10. Cincinnati: 2,211,936——-10. Austin: 2,227,083 11. Cleveland: 2,077,240———–11. Austin: 2,165,497———–11. Cincinnati: 2,221,208 12. Kansas City, MO: 2,009,342-12. Kansas City: 2,144,427–12. Kanas City: 2,157,990 13. Las Vegas, NV: 1,951,269—–13. Columbus: 2,104,194—–13. Columbus: 2,122,271 14. Columbus: 1,901,974——-14. Cleveland: 2,053,795—–14. Indianapolis: 2,074,537 15. Indianapolis, IN: 1,887,877—15. Indianapolis: 2,052,368—15. Cleveland: 2,048,449 16. San Jose, CA: 1,836,911—16. San Juan: 2,022,139———16. San Juan: 2,023,227 17. Austin, TX: 1,716,289————17. San Jose: 1,993,804—–17. San Jose: 1,990,660 18. Virginia Beach, VA: 1,676,822—18. Nashville: 1,904,726—18. Nashville: 1,934,317 19. Nashville: 1,670,890—19. Virginia Beach: 1,763,713–19. Virginia Beach: 1,768,901 20. Providence, RI: 1,600,852—-20. Providence: 1,622,379—20. Providence: 1,624,578 21. Milwaukee, WI: 1,555,908—–21. Milwaukee: 1,573,995—21. Milwaukee: 1,575,179 22. Jacksonville, FL: 1,345,596-22. Jacksonville: 1,532,663–22. Jacksonville: 1,559,514 23. Grand Rapids: 988,938–23. Grand Rapids: 1,071,370-23. Grand Rapids: 1,077,370 24. Omaha, NE: 865,350————–24. Omaha: 940,970—-24. Omaha: 949,442 25. Dayton: 799,232——————–25. Dayton: 805,088—–25. Dayton: 807,611 26. Akron: 703,200———————26. Akron: 703,855——–26. Akron: 703,479 27. Wichita, KS: 630,919————27. Des Moines: 690,915—27. Des Moines: 699,292 28. Toledo: 610,001——————28.Madison: 659,927——–28. Madison: 664,865 29. Madison, WI: 605,435———–29. Toledo: 643,089——–29. Toledo: 641,816 30. Des Moines, IA: 569,633——-30. Wichita: 637,519——30. Wichita: 640,218 31. Youngstown: 565,773———–31. Lansing: 548,674—–31. Lansing: 550,391 32. Lansing, MI: 534,684————32. Youngstown: 538,226—32. Youngstown: 536,081 33. Canton: 404,422——————33. Canton: 401,165—-33. Canton: 399,927
Charlotte and Orlando metros, previous national peers, have grown past the population standard limit of 2.599 million and are no longer used. Lansing and San Juan have been added.
Metro Area Total Growth Census 2010-July 1, 2019 and July 1, 2018-July 1, 2019 Census 2010-July 1, 2019—————————–July 1, 2018-July 1, 2019 1. Austin: +510,794————————————–1. Austin: +61,586 2. San Antonio: +408,452——————————2. Las Vegas: +40,600 3. Las Vegas: +315,446——————————–3. San Antonio: +38,581 4. Minneapolis: +306,410——————————4. Minneapolis: +29,982 5. Nashville: +288,117———————————-5. Nashville: +29,591 6. Portland: +266,403———————————–6. Jacksonville: +26,851 7. Columbus: +220,297——————————–7. Indianapolis: +22,169 8. Sacramento: +214,603——————————8. Sacramento: +21,790 9. Jacksonville: +213,918——————————9. Portland: +19,062 10. Indianapolis: +186,660—————————-10. Columbus: +18,077 11. San Jose: +153,749——————————–11. Kansas City: +13,563 12. Kansas City: +148,648—————————–12. Cincinnati: +9,272 13. Des Moines: +92,817——————————-13. Omaha: +8,472 14. Omaha: +84,092————————————-14. Des Moines: +8,377 15. Grand Rapids: +83,700—————————–15. Grand Rapids: +6,000 16. Cincinnati: +83,541———————————-16. Virginia Beach: +5,188 17. Madison: +59,430————————————17. Madison: +4,938 18. Virginia Beach: +54,947—————————-18. Wichita: +2,699 19. Providence: +23,726——————————–19. Dayton: +2,523 20. Detroit: +23,379—————————————20. Providence: +2,199 21. Milwaukee: +19,271———————————21. Lansing: +1,717 22. Wichita: +17,157————————————-22. Milwaukee: +1,184 23. Lansing: +15,707————————————23. San Juan: +1,088 24. St. Louis: +15,527———————————–24. Akron: -376 25. Dayton: +8,379—————————————25. St. Louis: -730 26. Akron: +279——————————————-26. Canton: -810 27. Chicago: -2,566————————————–27. Toledo: -1,273 28. Canton: -6,902—————————————28. Youngstown: -2,45 29. Toledo: -9,613—————————————-29. Detroit: -2,455 30. Cleveland: -28,791———————————-30. San Jose: -3,144 31. Youngstown: -29,692——————————-31. Pittsburgh: -5,053 32. Pittsburgh: -36,685———————————32. Cleveland: -5,346 33. San Juan: -326,899——————————–33. Chicago: -25,619
Now let’s look at the components of population change for metro areas.
Total Births By Metro Census 2010-July 1, 2019 and July 1, 2018-July 1, 2019 Census 2010-July 1, 2019———————–July 1, 2018-July 1, 2019 1. Chicago: 1,085,985——————————-1. Chicago: 108,425 2. Detroit: 462,696————————————2. Detroit: 48,879 3. Minneapolis: 419,634—————————–3. Minneapolis: 44,602 4. St. Louis: 310,273———————————4. San Antonio: 32,592 5. San Antonio: 300,032—————————-5. St. Louis: 31,686 6. Kansas City: 253,384—————————-6. Columbus: 27,096 7. Cincinnati: 253,180——————————-7. Las Vegas: 27,048 8. Portland: 253,110———————————8. Cincinnati: 26,892 9. Sacramento: 252,144—————————9. Sacramento: 26,752 10. Columbus: 251,291—————————10. Kanas City: 26,497 11. Las Vegas: 247,787—————————11. Indianapolis: 26,300 12. Indianapolis: 246,099————————-12. Portland: 26,204 13. Austin: 239,673———————————13. Austin: 26,115 14. San Jose: 220,891—————————–14. Nashville: 24,308 15. Pittsburgh: 218,159—————————-15. Pittsburgh: 22,570 16. Nashville: 216,969—————————–16. San Jose: 22,487 17. Cleveland: 212,523—————————-17. Cleveland: 22,003 18. Virginia Beach: 209,617———————-18. Virginia Beach: 21,589 19. Milwaukee: 182,815—————————19. Milwaukee: 18,927 20. Jacksonville: 167,526————————-20. Jacksonville: 18,592 21. Providence: 152,794————————–21. Providence: 16,182 22. Grand Rapids: 125,556———————-22. Grand Rapids: 13,339 23. Omaha: 122,306——————————23. Omaha: 12,848 24. Dayton: 88,783——————————–24. Dayton: 9,391 25. Des Moines: 85,530————————–25. Des Moines: 9,311 26. Wichita: 81,503——————————–26. Wichita: 8,057 27. Toledo: 71,848———————————27. Toledo: 7,428 28. Akron: 69,159———————————-28. Akron: 7,196 29. Madison: 67,559——————————29. Madison: 6,988 30. Lansing: 54,679——————————-30. Lansing: 5,702 31. Youngstown: 51,745————————-31. Youngstown: 5,450 32. Canton: 40,730——————————–32. Canton: 4,254
Components of change stats are not available for San Juan.
Total Deaths By Metro Census 2010-July 1, 2019 and July 1, 2018-July 1, 2019 Census 2010-July 1, 2019———————————July 1, 2018-July 1, 2019 1. Chicago: -647,739——————————————-1. Chicago: -74,501 2. Detroit: -377,943———————————————2. Detroit: -42,151 3. Pittsburgh: -253,686—————————————-3. St. Louis: -27,669 4. St. Louis: -241,884——————————————4. Pittsburgh: -27,387 5. Minneapolis: -210,510————————————-5. Minneapolis: -24,290 6. Cleveland: -198,044—————————————-6. Cleveland: -21,464 7. Cincinnati: -179,563—————————————-7. Cincinnati: -20,279 8. Sacramento: -157,234————————————-8. Sacramento: -18,933 9. Portland: -156,592——————————————9. San Antonio: -18,551 10. Kansas City: -155,166———————————–10. Portland: -18,458 11. San Antonio: -153,339———————————–11. Las Vegas: -17,919 12. Indianapolis: -148,608———————————–12. Kansas City: -17,692 13. Columbus: -142,665————————————–13. Columbus: -16,704 14. Las Vegas: -142,415————————————-14. Indianapolis: -16,678 15. Providence: -139,006————————————15. Virginia Beach: -15,280 16. Virginia Beach: -131,065——————————–16. Providence: -15,189 17. Nashville: -128,228—————————————17. Nashville: -15,122 18. Milwaukee: -123,806————————————-18. Jacksonville: -14,089 19. Jacksonville: -114,660———————————–19. Milwaukee: -13,810 20. San Jose: -94,587—————————————-20. San Jose: -11,582 21. Austin: -89,867——————————————–21. Austin: -11,445 22. Dayton: -77,893——————————————-22. Dayton: -8,506 23. Grand Rapids: -69,869———————————-23. Grand Rapids: -7,947 24. Akron: -65,852——————————————–24. Akron: -7,196 25. Youngstown: -64,558————————————25. Omaha: -6,931 26. Omaha: -62,030——————————————26. Youngstown: -6,842 27. Toledo: -59,436——————————————-27. Toledo: -6,624 28. Wichita: -51,734——————————————28. Wichita: 5,732 29. Des Moines: -44,857————————————29. Des Moines: 5,175 30. Canton: -41,233——————————————30. Lansing: -4,577 31. Lansing: -40,586—————————————–31. Madison: -4,453 32. Madison: -39,499—————————————-32. Canton: -4,395
Total Net Natural Change (Births vs. Deaths) By Metro Census 2010-July 1, 2019 and July 1, 2018-July 1, 2019 Census 2010-July 1, 2019———————————July 1, 2018-July 1, 2019 1. Chicago: 438,246———————————————1. Chicago: 33,924 2. Minneapolis: 209,124—————————————-2. Minneapolis: 20,312 3. Austin: 149,806———————————————–3. Austin: 14,670 4. San Antonio: 146,693—————————————4. San Antonio: 14,041 5. San Jose: 126,304——————————————-5. San Jose: 10,905 6. Columbus: 108,626——————————————6. Columbus: 10,392 7. Las Vegas: 105,372—————————————–7. Indianapolis: 9,622 8. Kansas City: 98,218—————————————–8. Nashville: 9,186 9. Indianapolis: 97,491—————————————–9. Las Vegas: 9,129 10. Portland: 96,518——————————————-10. Kansas City: 8,805 11. Sacramento: 94,910————————————–11. Sacramento: 7,819 12. Nashville: 88,741——————————————12. Portland: 7,746 13. Detroit: 84,753———————————————-13. Detroit: 6,728 14. Virginia Beach: 78,552———————————–14. Cincinnati: 6,613 15. Cincinnati: 73,617—————————————–15. Virginia Beach: 6,309 16. St. Louis: 68,389——————————————-16. Omaha: 5,917 17. Omaha: 60,276———————————————17. Grand Rapids: 5,392 18. Milwaukee: 59,009—————————————–18. Milwaukee: 5,117 19. Grand Rapids: 55,687————————————19. Jacksonville: 4,503 20. Jacksonville: 52,866————————————–20. Des Moines: 4,136 21. Des Moines: 40,673————————————–21. St. Louis: 4,017 22. Wichita: 29,769——————————————–22. Madison: 2,535 23. Madison: 28,060——————————————23. Wichita: 2,325 24. Cleveland: 14,479—————————————-24. Lansing: 1,125 25. Lansing: 14,093——————————————25. Providence: 993 26. Providence: 13,788————————————–26. Dayton: 885 27. Toledo: 12,412——————————————–27. Toledo: 804 28. Dayton: 10,890——————————————-28. Cleveland: 539 29. Akron: 3,307———————————————-29. Akron: 0 30. Canton: -503———————————————-30. Canton: -141 31. Youngstown: -12,813———————————–31. Youngstown: -1,392 32. Pittsburgh: -35,527————————————–32. Pittsburgh: -4,817
Total Domestic Migration By Metro Census 2010-July 1, 2019 and July 1, 2018-July 1, 2019 Census 2010-July 1, 2019———————————July 1, 2018-July 1, 2019 1. Austin: 293,162———————————————–1. Austin: 41,334 2. San Antonio; 214,509—————————————2. Las Vegas: 31,643 3. Las Vegas: 185,570—————————————–3. San Antonio: 21,987 4. Nashville: 158,336——————————————-4. Jacksonville: 20,051 5. Jacksonville: 126,483—————————————5. Nashville: 15,482 6. Portland: 121,473——————————————–6. Sacramento: 9,941 7. Sacramento: 69,723—————————————-7. Portland: 8,374 8. Columbus: 53,301——————————————-8. Indianapolis: 6,196 9. Indianapolis: 46,076—————————————-9. Columbus: 3,746 10. Des Moines: 40,183————————————–10. Des Moines: 3,718 11. Kansas City: 24,457————————————–11. Minneapolis: 3,202 12. Madison: 15,880——————————————12. Kansas City: 2,437 13. Minneapolis: 11,638————————————–13. Madison: 1,418 14. Grand Rapids: 10,903———————————–14. Cincinnati: 1,193 15. Omaha: 7,537———————————————-15. Omaha: 1,068 16. Canton: -7,124———————————————16. Dayton: 896 17. Dayton: -15,586——————————————–17. Wichita: -291 18. Akron: -15,683———————————————-18. Grand Rapids: -669 19. Lansing: -18,240——————————————-19. Canton: -677 20. Youngstown: -19,317————————————-20. Youngstown: -751 21. Cincinnati: -19,944—————————————-21. Lansing: -840 22. Wichita: -21,454——————————————-22. Akron: -1,190 23. Toledo: -27,740——————————————–23. Virginia Beach: -2,197 24. Pittsburgh: -31,804—————————————24. Toledo: -2,339 25. Providence: -38,503————————————-25. Pittsburgh: -2,658 26. Virginia Beach: -59,729———————————26. Providence: -3,185 27. Milwaukee: -64,395————————————–27. Milwaukee: -5,140 28. Cleveland: -78,763————————————–28. Cleveland: -7,250 29. St. Louis: -85,003—————————————-29. St. Louis: -7,685 30. San Jose: -124,105————————————-30. Detroit: -16,655 31. Detroit: -172,225—————————————–31. San Jose: -27,495 32. Chicago: -638,599—————————————32. Chicago: -74,950
Total International Migration By Metro Census 2010-July 1, 2019 and July 1, 2018-July 1, 2019 Census 2010-July 1, 2019———————————July 1, 2018-July 1, 2019 1. Chicago: 197,093——————————————-1. Chicago: 15,257 2. San Jose: 152,520—————————————–2. San Jose: 13,371 3. Detroit: 110,907———————————————3. Detroit: 7,516 4. Minneapolis: 87,847—————————————4. Minneapolis: 6,645 5. Austin: 62,740———————————————–5. Indianapolis: 6,394 6. Columbus: 58,853——————————————6. Austin: 5,280 7. Sacramento: 51,225—————————————7. Nashville: 4,937 8. Providence: 49,015—————————————-8. Providence: 4,455 9. Portland: 47,983——————————————–9. Sacramento: 4,053 10. San Antonio: 45,348————————————10. Columbus: 4,032 11. Indianapolis: 43,502————————————-11. St. Louis: 2,991 12. Nashville: 39,422—————————————–12. Portland: 2,960 13. Virginia Beach: 36,319———————————-13. Pittsburgh: 2,555 14. Cleveland: 36,318—————————————-14. San Antonio: 2,504 15. Jacksonville: 34,089————————————-15. Kansas City: 2,377 16. St. Louis: 32,872—————————————–16. Jacksonville: 2,251 17. Cincinnati: 31,157—————————————-17. Cincinnati: 1,547 18. Pittsburgh: 30,654—————————————-18. Omaha: 1,517 19. Kansas City: 27,259————————————-19. Lansing: 1,452 20. Milwaukee: 25,298—————————————20. Cleveland: 1,433 21. Las Vegas: 23,319—————————————21. Grand Rapids: 1,316 22. Lansing: 19,865——————————————22. Milwaukee: 1,277 23. Grand Rapids: 17,629———————————-23. Virginia Beach: 1,165 24. Omaha: 16,785——————————————24. Madison: 988 25. Madison: 15,600—————————————–25. Akron: 836 26. Dayton: 13,473——————————————26. Dayton: 785 27. Akron: 13,086——————————————–27. Wichta: 688 28. Des Moines: 11,716————————————28. Des Moines: 519 29. Wichita: 9,096——————————————-29. Toledo: 270 30. Toledo: 5,646——————————————–30. Canton: 25 31. Youngstown: 2,675————————————-31. Youngstown: 25 32. Canton: 1,073——————————————–32. Las Vegas: -360
Total Net Migration By Metro Census 2010-July 1, 2019 and July 1, 2018-July 1, 2019 Census 2010-July 1, 2019———————————July 1, 2018-July 1, 2019 1. Austin: 355,902———————————————1. Austin: 46,614 2. San Antonio: 259,857————————————-2. Las Vegas: 31,283 3. Las Vegas: 208,889—————————————3. San Antonio: 24,491 4. Nasvhille: 197,758—————————————–4. Jacksonville: 22,302 5. Portland: 169,456——————————————5. Nashville: 20,419 6. Jacksonville: 160,572————————————-6. Sacramento: 13,994 7. Sacramento: 120,948————————————-7. Indianapolis: 12,590 8. Columbus: 112,154—————————————-8. Portland: 11,334 9. Minneapolis: 99,458—————————————9. Minneapolis: 9,847 10. Indianapolis: 89,578————————————10. Columbus: 7,778 11. Des Moines: 51,899————————————-11. Kansas City: 4,814 12. Kansas City: 51,716————————————-12. Des Moines: 4,237 13. Madison: 31,480——————————————13. Cincinnati: 2,740 14. Grand Rapids: 28,352———————————–14. Omaha: 2,585 15. San Jose: 28,415—————————————-15. Madison: 2,406 16. Omaha: 24,322——————————————-16. Dayton: 1,681 17. Cincinnati: 11,213—————————————-17. Providence: 1,270 18. Providence: 10,512————————————–18. Grand Rapids: 647 19. Lansing: 1,625——————————————–19. Lansing: 612 20. Pittsburgh: -1,150—————————————-20. Wichita: 397 21. Dayton: -2,113——————————————–21. Pittsburgh: -103 22. Akron: -2,597———————————————-22. Akron: -354 23. Canton: -6,051——————————————–23. Canton: -652 24. Wichita: -12,358——————————————24. Youngstown: -726 25. Youngstown: -16,642————————————25. Virginia Beach: -1,032 26. Toledo: -22,094——————————————-26. Toledo: -2,069 27. Virginia Beach: -23,410——————————–27. Milwaukee: -3,863 28. Milwaukee: -39,097————————————-28. St. Louis: -4,694 29. Cleveland: -42,445————————————–29. Cleveland: -5,817 30. St. Louis: -52,131—————————————-30. Detroit: -9,139 31. Detroit: -61,318——————————————31. San Jose: -14,124 32. Chicago: -441,506————————————–32. Chicago: -59,693
The 2019 metro population estimates show Columbus largely holding its own against state, regional and national peers.
The US Census has begun releasing 2019 population data, which will be the final data before we get the official, decennial census statistics for 2020. With Covid-19 ravaging the world and United States at the moment, it remains to be seen what effects it might have on the census counts, or if the official census may even end up delayed. While we wait for those issues to resolve, here are the 2019 Ohio county population estimates.
Yesterday, the US Census released tons of new demographic data for 2018. The next few posts will detail some of that data and how Columbus compares to Midwestern and national peers in terms of population, racial diversity and other metrics. These peers are based on either large Midwestern cities or metro areas between 1.5-2.5 million. This post will be a racial diversity comparison, specifically.
Total Non-Hispanic White Population by City by Year 2010———————————–2018 1. Chicago: 853,910————–1. Chicago: 899,980 2. Indianapolis: 482,195———2. Columbus: 486,431 3. Columbus: 470,971———–3. Austin: 470,620 4. Jacksonville, FL: 452,926—-4. Indianapolis: 465,466 5. Portland, OR: 417,876——–5. Portland: 457,042 6. Austin: 384,065—————6. Jacksonville: 455,487 7. Virginia Beach: 282,812——7. Omaha: 307,845 8. Las Vegas: 280,604———-8. Virginia Beach: 275,371 9. Omaha, NE: 277,606———9. Las Vegas: 272,870 10. San Jose, CA: 265,311——10. Kansas City: 269,854 11. Kansas City, MO: 247,473–11. San Jose: 253,571 12. Wichita, KS: 245,146——-12. Minneapolis: 252,327 13. Minneapolis: 242,848——13. Wichita: 242,671 14. Milwaukee: 221,514——–14. Lincoln: 227,215 15. Lincoln, NE: 216,076——-15. Milwaukee: 204,250 16. Pittsburgh: 203,622——–16. Pittsburgh: 195,468 17. Fort Wayne, IN: 179,646—17. Madison: 186,034 18. Madison, WI: 178,307——18. Fort Wayne: 173,088 19. Toledo: 177,341————–19. St. Paul: 159,782 20. Sacramento, CA: 165,610–20. Sacramento: 158,333 21. St. Paul, MN: 159,704——-21. Toledo: 157,967 22. Des Moines, IA: 145,937—22. Cincinnati: 150,693 23. Cincinnati: 143,120———23. Des Moines: 137,268 24. Cleveland: 137,977———24. St. Louis: 133,688 25. St. Louis: 134,146———–25. Cleveland: 131,010 26. Grand Rapids, MI: 104,636–26. Grand Rapids: 115,719 27. Providence, RI: 64,284——27. Detroit: 72,982 28. Detroit: 55,298————–28. Providence: 58,856
Previous peers, such as San Antonio, Charlotte and Orlando were removed as their metros are now larger than the 2.5 million comparison limit. Jacksonville, Florida entered the comparison with a metro population of just over 1.5 million in 2018. Smaller Ohio cities like Dayton, Akron, Canton and Youngstown, which are normally compared, did not have this data available.
Total Non-Hispanic White Change 2010-2018 1. Austin: +86,555 2. Chicago: +46,070 3. Portland: +39,166 4. Omaha: +30,239 5. Kansas City: +22,381 6. Detroit: +17,684 7. Columbus: +15,460 8. Lincoln: +11,139 9. Grand Rapids: +11,083 10. Minneapolis: +9,479 11. Madison: +7,727 12. Cincinnati: +7,573 13. Jacksonville: +2,561 14. St. Paul: +28 15. St. Louis: -458 16. Wichita: -2,475 17. Providence: -5,428 18. Fort Wayne: -6,558 19. Cleveland: -6,967 20. Sacramento: -7,277 21. Virginia Beach: -7,441 22. Las Vegas: -7,734 23. Pittsburgh: -8,154 24. Des Moines: -8,669 25. San Jose: -11,740 26. Indianapolis: -16,729 27. Milwaukee: -17,264 28. Toledo: -19,374
Non-Hispanic White % of Total Population by City in 2018 1. Lincoln: 79.1% 2. Madison: 72.1% 3. Portland: 70.0% 4. Omaha: 65.7% 5. Fort Wayne: 65.5% 6. Pittsburgh: 64.9% 7. Des Moines: 63.3% 8. Wichita: 62.3% 9. Virginia Beach: 61.2% 10. Minneapolis: 59.3% 11. Grand Rapids: 57.8% 12. Toledo: 57.5% 13. Kansas City: 54.9% 14. Columbus: 54.3% 15. Indianapolis: 53.9% 16. St. Paul: 51.9% 17. Jacksonville: 50.4% 18. Cincinnati: 49.8% 19. Austin: 48.8% 20. St. Louis: 44.2% 21. Las Vegas: 42.3% 22. Milwaukee: 34.5% 23. Cleveland: 34.1% 24. Chicago: 33.3% 25. Providence: 32.8% 26. Sacramento: 31.1% 27. San Jose: 24.6% 28. Detroit: 10.9%
Total Non-Hispanic Black Population by City by Year 2010————————————2018 1. Chicago: 895,294————1. Chicago: 784,266 2. Detroit: 587,707————–2. Detroit: 520,161 3. Jacksonville: 249,532——-3. Jacksonville: 274,290 4. Milwaukee: 230,473——–4. Columbus: 259,803 5. Indianapolis: 226,314——-5. Indianapolis: 251,958 6. Columbus: 216,486———6. Milwaukee: 222,619 7. Cleveland: 208,528———7. Cleveland: 178,909 8. St. Louis: 157,382———–8. Kansas City: 137,867 9. Kansas City: 138,461——-9. St. Louis: 137,087 10. Cincinnati: 131,909——-10. Cincinnati: 122,261 11. Virginia Beach: 79,583—11. Virginia Beach: 84,333 12. Toledo: 75,033————12. Minneapolis: 81,930 13. Pittsburgh: 71,539——-13. Austin: 78,354 14. Minneapolis: 63,749—–14. Toledo: 74,630 15. Sacramento: 61,976—–15. Pittsburgh: 68,637 16. Austin: 61,833————16. Las Vegas: 68,488 17. Las Vegas: 60,187——–17. Sacramento: 64,824 18. Omaha: 55,086———–18. Omaha: 56,503 19. Wichita: 42,662———-19. St. Paul: 44,572 20. St. Paul: 41,923———-20. Wichita: 42,874 21. Grand Rapids: 41,848—21. Fort Wayne: 40,640 22. Fort Wayne: 39,016—–22. Portland: 39,882 23. Portland: 37,355——–23. Grand Rapids: 35,264 24. San Jose: 29,831——–24. San Jose: 29,432 25. Des Moines: 19,962—-25. Providence: 26,594 26. Providence: 19,265—–26. Des Moines: 24,018 27. Madison: 17,560——–27. Madison: 20,276 28. Lincoln: 9,023———-28. Lincoln: 12,203
Total Non-Hispanic Black Change 2010-2018 1. Columbus: +43,317 2. Indianapolis: +25,644 3. Jacksonville: +24,758 4. Minneapolis: +18,181 5. Austin: +16,521 6. Las Vegas: +8,301 7. Providence: +7,329 8. Virginia Beach: +4,750 9. Des Moines: +4,056 10. Lincoln: +3,180 11. Sacramento: +2,848 12. Madison: +2,716 13. St. Paul: +2,649 14. Portland: +2,527 15. Fort Wayne: +1,624 16. Omaha: +1,417 17. Wichita: +212 18. San Jose: -399 19. Toledo: -403 20. Kansas City: -594 21. Pittsburgh: -2,902 22. Grand Rapids: -6,584 23. Milwaukee: -7,854 24. Cincinnati: -9,648 25. St. Louis: -20,295 26. Cleveland: -29,619 27. Detroit: -67,546 28. Chicago: -111,028
Non-Hispanic Black % of Total Population by City in 2018 1. Detroit: 77.3% 2. Cleveland: 46.6% 3. St. Louis: 45.3% 4. Cincinnati: 40.4% 5. Milwaukee: 37.7% 6. Jacksonville: 30.4% 7. Indianapolis: 29.2% 8. Columbus: 29.0% 9. Chicago: 29.0% 10. Kansas City: 28.0% 11. Toledo: 27.1% 12. Pittsburgh: 22.8% 13. Minneapolis: 19.3% 14. Virginia Beach: 18.7% 15. Grand Rapids: 17.6% 16. Fort Wayne: 15.4% 17. Providence: 14.8% 18. St. Paul: 14.5% 19. Sacramento: 12.8% 20. Omaha: 12.1% 21. Des Moines: 11.1% 22. Wichita: 11.0% 23. Las Vegas: 10.6% 24. Austin: 8.1% 25. Madison: 7.9% 26. Portland: 6.1% 27. Lincoln: 4.3% 28. San Jose: 2.9%
Total Non-Hispanic Asian Population by City by Year 2010——————————-2018 1. San Jose: 303,227————1. San Jose: 367,280 2. Chicago: 148,280————2. Chicago: 179,841 3. Sacramento: 84,556——–3. Sacramento: 97,192 4. Austin: 46,575—————4. Austin: 73,185 5. Portland: 43,185————5. St. Paul: 59,395 6. St. Paul: 41,989————–6. Portland: 57,526 7. Las Vegas: 37,406———-7. Columbus: 54,902 8. Columbus: 35,468———-8. Las Vegas: 46,422 9. Jacksonville: 33,663——–9. Jacksonville: 42,639 10. Virginia Beach: 27,303—10. Virginia Beach: 31,875 11. Milwaukee: 22,670——–11. Indianapolis: 31,777 12. Minneapolis: 21,426——12. Minneapolis: 26,768 13. Wichita: 19,420———-13. Milwaukee: 25,17 14. Indianapolis: 17,137——14. Madison: 23,594 15. Madison: 16,671———-15. Wichita: 17,410 16. Pittsburgh: 12,036——-16. Omaha: 17,185 17. Providence: 11,497——-17. Pittsburgh: 16,724 18. Lincoln: 10,452———–18. Des Moines: 15,057 19. Kansas City: 10,263—–19. Fort Wayne: 13,661 20. Des Moines: 8,867——20. Providence: 12,556 21. St. Louis: 8,717———–21. Lincoln: 12,494 22. Omaha: 8,397———–22. Kansas City: 12,130 23. Fort Wayne: 6,945—–23. St. Louis: 10,662 24. Detroit: 6,549———-24. Detroit: 10,597 25. Cincinnati: 5,938——25. Cleveland: 10,595 26. Cleveland: 5,392——26. Cincinnati: 6,999 27. Grand Rapids: 3,695–27. Grand Rapids: 4,431 28. Toledo: 3,125———-28. Toledo: 2,802
Total Non-Hispanic Asian Change 2010-2018 1. San Jose: +64,053 2. Chicago: +31,561 3. Austin: +26,610 4. Columbus: +19,434 5. St. Paul: +17,406 6. Indianapolis: +14,640 7. Portland: +14,341 8. Sacramento: +12,636 9. Las Vegas: +9,016 10. Jacksonville: +8,976 11. Omaha: +8,788 12. Madison: +6,923 13. Fort Wayne: +6,716 14. Des Moines: +6,190 15. Minneapolis: +5,342 16. Cleveland: +5,203 17. Pittsburgh: +4,688 18. Virginia Beach: +4,572 19. Detroit: +4,048 20. Milwaukee: +2,501 21. Lincoln: +2,042 22. St. Louis: +1,945 23. Kansas City: +1,867 24. Cincinnati: +1,061 25. Providence: +1,059 26. Grand Rapids: +736 27. Toledo: -323 28. Wichita: -2,010
Non-Hispanic Asian % of Total Population by City in 2018 1. San Jose: 35.7% 2. St. Paul: 19.3% 3. Sacramento: 19.1% 4. Madison: 9.1% 5. Portland: 8.8% 6. Austin: 7.6% 7. Las Vegas: 7.2% 8. Virginia Beach: 7.1% 9. Providence: 7.0% 10. Des Moines: 6.9% 11. Chicago: 6.7% 12. Minneapolis: 6.3% 13. Columbus: 6.1% 14. Pittsburgh: 5.6% 15. Fort Wayne: 5.2% 16. Jacksonville: 4.7% 17. Wichita: 4.5% 18. Lincoln: 4.4% 19. Milwaukee: 4.3% 20. Indianapolis: 3.7% 21. Omaha: 3.7% 22. St. Louis: 3.5% 23. Cleveland: 2.8% 24. Kansas City: 2.5% 25. Cincinnati: 2.3% 26. Grand Rapids: 2.2% 27. Detroit: 1.6% 28. Toledo: 1.0%
Total Hispanic Population by City By Year 2010———————————2018 1. Chicago: 763,968————-1. Chicago: 776,661 2. San Jose: 318,389————2. San Jose: 333,819 3. Austin: 288,130—————3. Austin: 314,949 4. Las Vegas: 181,923———–4. Las Vegas: 222,860 5. Sacramento: 124,461———5. Sacramento: 148,343 6. Milwaukee: 104,619———-6. Milwaukee: 119,876 7. Indianapolis: 78,467———-7. Jacksonville: 94,158 8. Providence: 76,645———-8. Indianapolis: 88,022 9. Jacksonville: 64,081———-9. Providence: 75,177 10. Wichita: 59,823————-10. Wichita: 70,564 11. Portland: 58,986————11. Omaha: 68,747 12. Omaha: 53,661————–12. Portland: 60,760 13. Kansas City: 49,800——–13. Columbus: 53,935 14. Detroit : 45,580————-14. Detroit: 52,718 15. Columbus: 43,276———-15. Kansas City: 52,638 16. Cleveland: 36,067———-16. Cleveland: 47,144 17. Minneapolis: 34,504——-17. Minneapolis: 40,912 18. Grand Rapids: 30,659—–18. Virginia Beach: 37,365 19. Virginia Beach: 29,206—-19. Grand Rapids: 36,469 20. St. Paul: 28,725————20. Des Moines: 31,706 21. Des Moines: 23,832——-21. St. Paul: 26,081 22. Toledo: 21,346————-22. Toledo: 24,625 23. Fort Wayne: 19,576——-23. Fort Wayne: 24,623 24. Lincoln: 16,007————24. Lincoln: 22,339 25. Madison: 14,062———-25. Madison: 18,867 26. St. Louis: 11,207———–26. St. Louis: 12,509 27. Cincinnati: 8,710———-27. Cincinnati: 10,773 28. Pittsburgh: 7,282———28. Pittsburgh: 10,180
Total Hispanic Population Change 2010-2018 1. Las Vegas: +40,937 2. Jacksonville: +30,077 3. Austin: +26,819 4. Sacramento: +23,882 5. San Jose: +15,430 6. Milwaukee: +15,257 7. Omaha: +15,086 8. Chicago: +12,693 9. Cleveland: +11,077 10. Wichita: +10,741 11. Columbus: +10,659 12. Indianapolis: +9,555 13. Virginia Beach: +8,159 14. Des Moines: +7,874 15. Detroit: +7,138 16. Minneapolis: +6,408 17. Lincoln: +6,332 18. Grand Rapids: +5,810 19. Fort Wayne: +5,047 20. Madison: +4,805 21. Toledo: +3,279 22. Pittsburgh: +2,898 23. Kansas City: +2,838 24. Cincinnati: +2,063 25. Portland: +1,774 26. St. Louis: +1,302 27. Providence: -1,468 28. St. Paul: -2,644
Hispanic % of Total Population by City in 2018 1. Providence: 41.9% 2. Las Vegas: 34.6% 3. Austin: 32.7% 4. San Jose: 32.4% 5. Sacramento: 29.2% 6. Chicago: 28.7% 7. Milwaukee: 20.3% 8. Grand Rapids: 18.2% 9. Wichita: 18.1% 10. Omaha: 14.7% 11. Des Moines: 14.6% 12. Cleveland: 12.3% 13. Kansas City: 10.7% 14. Jacksonville: 10.4% 15. Indianapolis: 10.2% 16. Minneapolis: 9.6% 17. Portland: 9.3% 18. Fort Wayne: 9.3% 19. Toledo: 9.0% 20. St. Paul: 8.5% 21. Virginia Beach: 8.3% 22. Detroit: 7.8% 23. Lincoln: 7.8% 24. Madison: 7.3% 25. Columbus: 6.0% 26. St. Louis: 4.1% 27. Cincinnati: 3.6% 28. Pittsburgh: 3.4%
Total Non-Hispanic Other Population by City by Year 2010——————————–2018 1. Chicago: 37,379————–1. Chicago: 65,240 2. San Jose: 32,439————-2. San Jose: 46,017 3. Sacramento: 30,900——–3. Columbus: 40,806 4. Portland: 28,027————-4. Sacramento: 39,825 5. Las Vegas: 24,521———–5. Portland: 37,363 6. Columbus: 23,738———–6. Jacksonville: 37,322 7. Jacksonville: 23,114———-7. Las Vegas: 34,024 8. Minneapolis: 20,753———8. Austin: 27,135 9. Virginia Beach: 20,268——9. Indianapolis: 26,908 10. Indianapolis: 20,086——10. Minneapolis: 23,458 11. Detroit: 16,776————-11. Virginia Beach: 21,245 12. Milwaukee: 16,311——– 12. Kansas City: 19,320 13. Wichita: 16,091————13. Milwaukee: 19,286 14. Omaha: 15,519————14. Omaha: 17,987 15. Austin: 14,915————-15. St. Paul: 17,871 16. Kansas City: 14,668——16. Detroit: 16,223 17. St. Paul: 13,098———–17. Cleveland: 16,123 18. Pittsburgh: 11,280——-18. Wichita: 15,740 19. Toledo: 10,134————19. Toledo: 14,949 20. Fort Wayne: 8,513——-20. Lincoln: 13,148 21. Cleveland: 8,276———21. Fort Wayne: 12,158 22. St. Louis: 7,704———-22. Cincinnati: 11,889 23. Lincoln: 7,483———–23. Pittsburgh: 10,029 24. Grand Rapids: 7,376—24. Madison: 9,263 25. Cincinnati: 7,230——-25. Des Moines: 8,944 26. Madison: 7,177———26. St. Louis: 8,892 27. Providence: 6,471——27: Grand Rapids: 8,347 28. Des Moines: 5,598—–28. Providence: 6,152
Total Non-Hispanic Other Population Change 2010-2018 1. Chicago: +27,861 2. Columbus; +17,068 3. Jacksonville: +14,208 4. San Jose: +13,578 5. Austin: +12,220 6. Las Vegas: +9,503 7. Portland: +9,336 8. Sacramento: +8,925 9. Cleveland: +7.847 10. Indianapolis: +6,822 11. Lincoln: +5,665 12. Toledo: +4,815 13. St. Paul: +4,773 14. Cincinnati: +4,659 15. Kansas City: +4,652 16. Fort Wayne: +3,645 17. Des Moines: +3,346 18. Milwaukee: +2,975 19. Minneapolis: +2,705 20. Omaha: +2,468 21. Madison: +2,086 22. St. Louis: 1,188 23. Virginia Beach: +977 24. Grand Rapids: +971 25. Providence: -319 26. Wichita: -351 27. Detroit: -553 28. Pittsburgh: -1251
Non-Hispanic Other % of Total Population by City in 2018 1. Sacramento: 7.8% 2. St. Paul: 5.8% 3. Portland: 5.7% 4. Minneapolis: 5.5% 5. Toledo: 5.4% 6. Las Vegas: 5.3% 7. Virginia Beach: 4.7% 8. Fort Wayne: 4.6% 9. Lincoln: 4.6% 10. Columbus: 4.6% 11. San Jose: 4.5% 12. Cleveland: 4.2% 13. Grand Rapids: 4.2% 14. Jacksonville: 4.1% 15. Des Moines: 4.1% 16. Wichita: 4.0% 17. Cincinnati: 3.9% 18. Kansas City: 3.9% 19. Omaha: 3.8% 20. Madison: 3.6% 21. Providence: 3.4% 22. Pittsburgh: 3.3% 23. Milwaukee: 3.3% 24. Indianapolis: 3.1% 25. St. Louis: 2.9% 26. Austin: 2.8% 27. Chicago: 2.4% 28. Detroit: 2.4%
Now that we can see all the numbers, what is the 2018 ranking of most to least racially diverse? To find out, I assigned points by the ranking of % of population, so #1 of a particular ranking would get 1 point, the next 2 points and so on. The cities with the fewest points are the most diverse. Here are the rankings for both 2010 and 2018.
Most to Least Diverse by Year and Total Points 2010——————————–2018 1. Portland: 50—————–1. Portland: 54 2. Sacramento: 52————2. Sacramento: 54 3. St. Paul: 53—————–3. Minneapolis: 55 4. Minneapolis: 54———–4. St. Paul: 58 5. Virginia Beach: 55——–5. Las Vegas: 59 6. Wichita: 57—————-6. Virginia Beach: 59 7. Las Vegas: 60————-7. Fort Wayne: 62 8. Providence: 61————8. Des Moines: 64 9. Omaha: 66—————-9. Jacksonville: 67 10. Grand Rapids: 69——-10. Columbus: 70 11. Des Moines: 71———-11. San Jose: 71 12. Madison: 72————-12. Cleveland: 72 13. San Jose: 72————-13. Wichita: 72 14. Fort Wayne: 73———14. Grand Rapids: 73 15. Kansas City: 73———15. Providence: 73 16. Milwaukee: 73———-16. Omaha: 74 17. Pittsburgh: 74———-17. Madison: 75 18. Jacksonville: 75——–18. Toledo: 75 19. Chicago: 76————-19. Milwaukee: 76 20. Columbus: 77———-20. Chicago: 77 21. Austin: 80—————21. Austin: 78 22. Indianapolis: 81——–22. Kansas City: 78 23. Toledo: 81————–23. Lincoln: 78 24. Lincoln: 85————-24. Indianapolis: 81 25. St. Louis: 94———–25. Pittsburgh: 82 26. Cleveland: 95———-26. Cincinnati: 91 27. Cincinnati: 97———-27. St. Louis: 96 28. Detroit: 104————28. Detroit: 106
Columbus had one of the fastest improvements of its diversity, moving up 10 spots from 20th to 10th.

 [Source: U.S. Census Bureau]