The Housing Market Update November 2022 data from Columbus Realtors showed home sales were down nearly 30% from a year ago, and new listings decreased nearly as much. However, prices remained on their trajectory upwards across the metro area.
Note: LSD= Local School District, CSD= City School District. In both cases, school district boundaries differ from city boundaries.
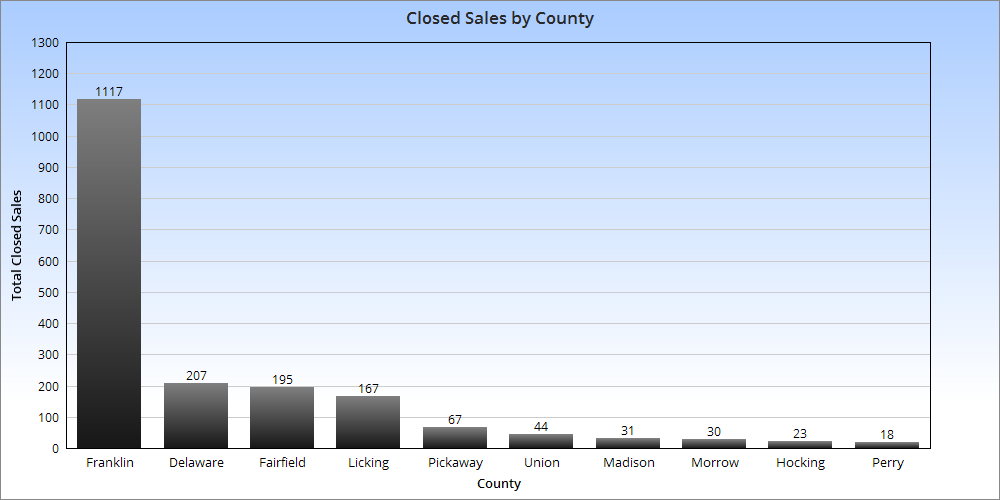
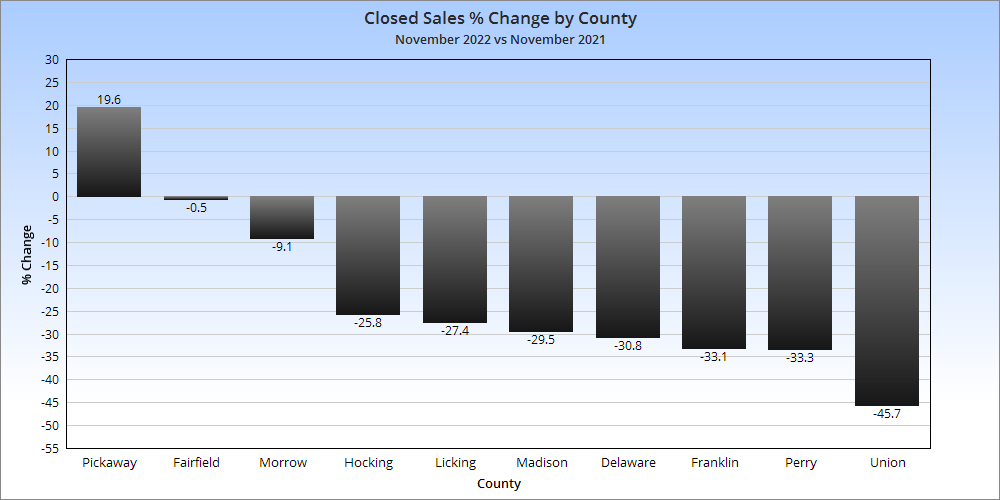
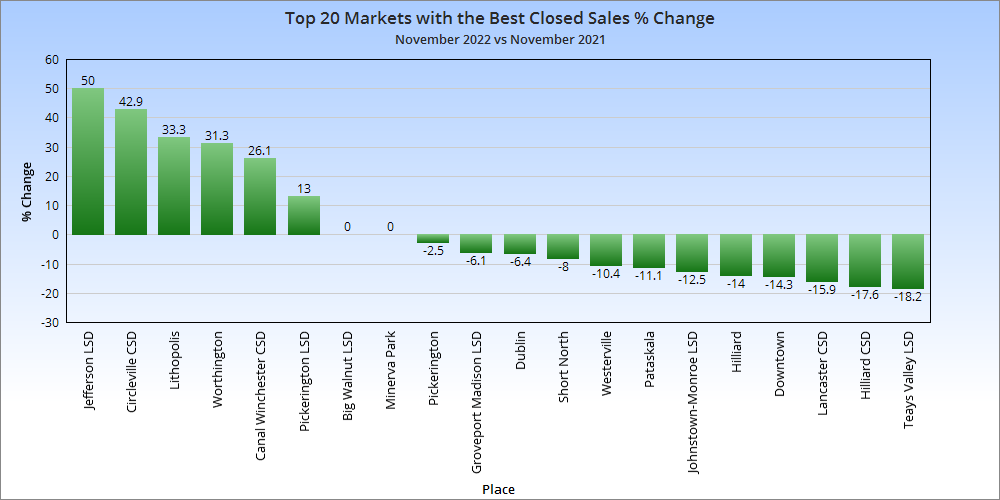
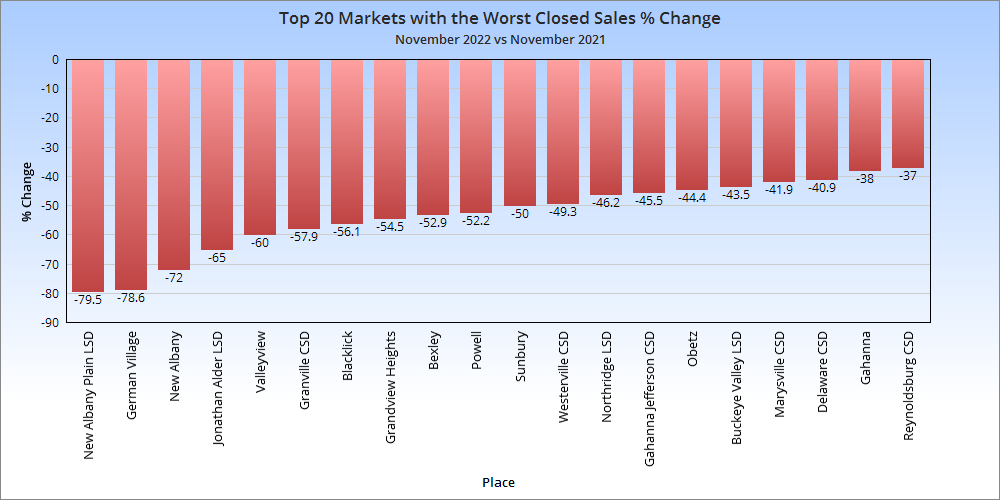
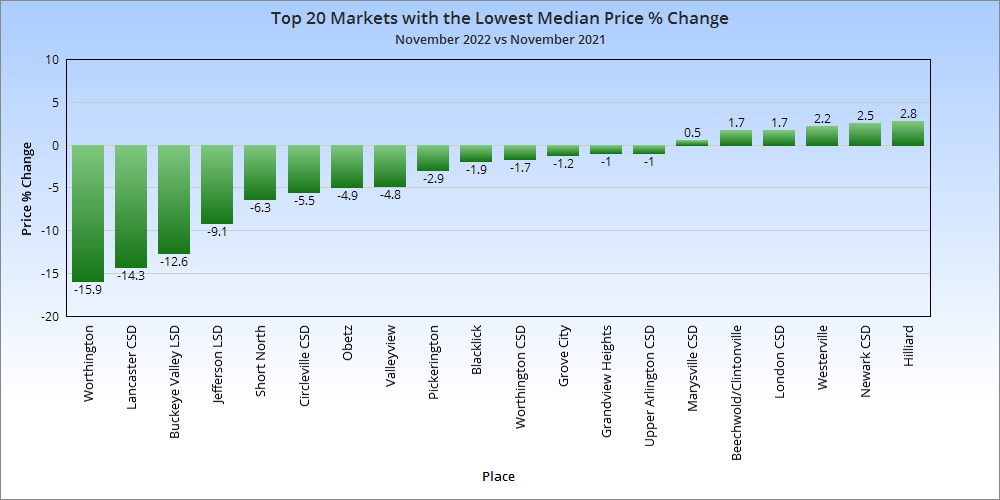
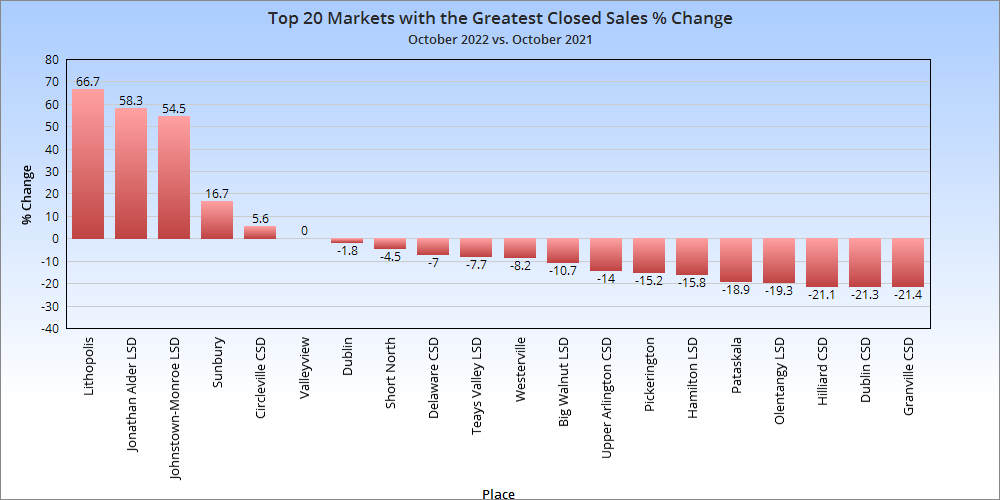
Closed sales are those sales that were completed during the month. 9 of the 10 metro counties saw declines, with 8 of them being fairly significant. Few markets were up year-over-year. The worst-performing were mostly among the metro’s most expensive areas, but there were a few standouts otherwise.
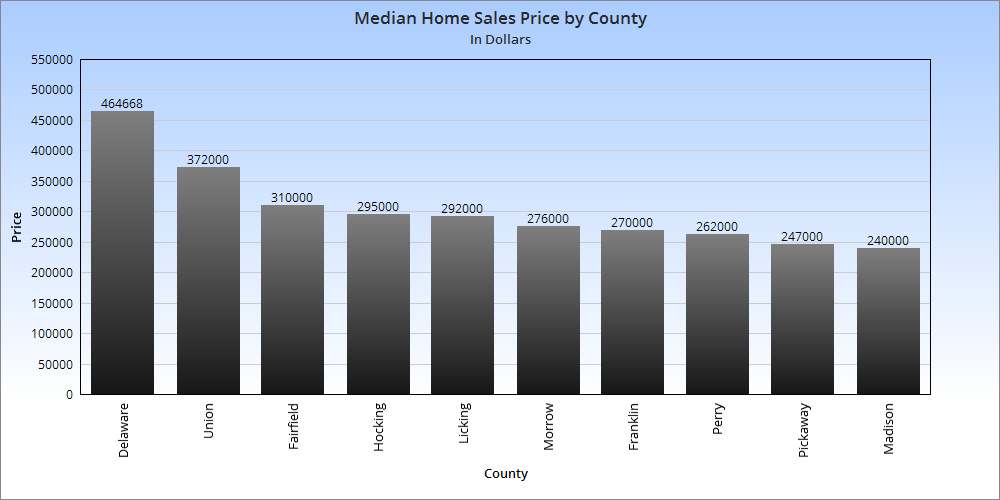
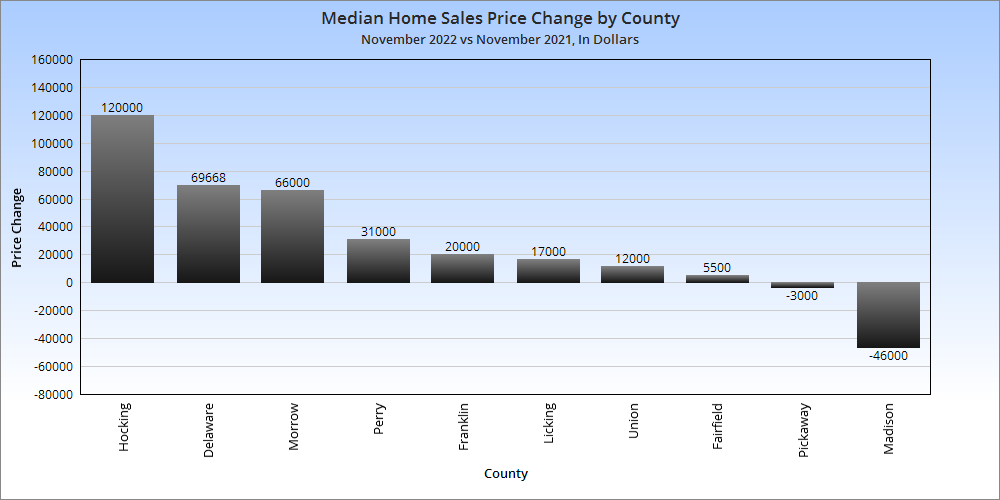
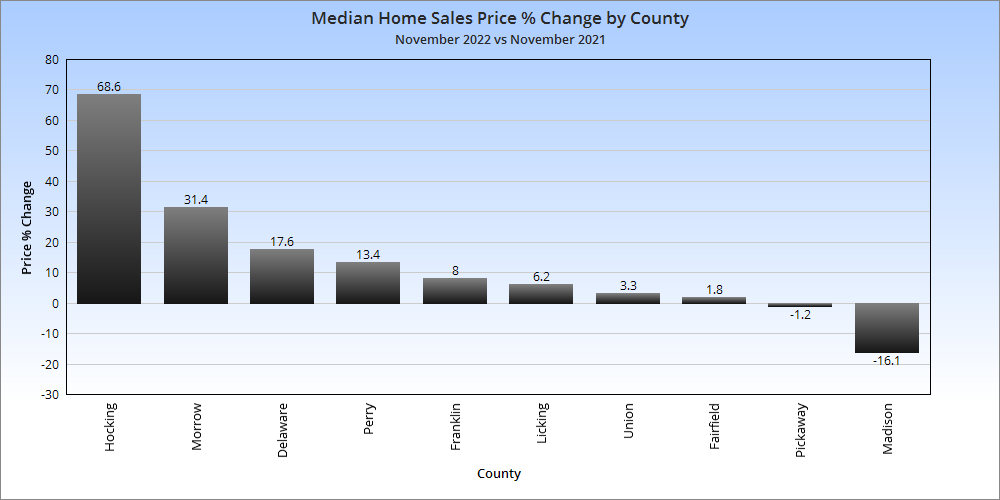
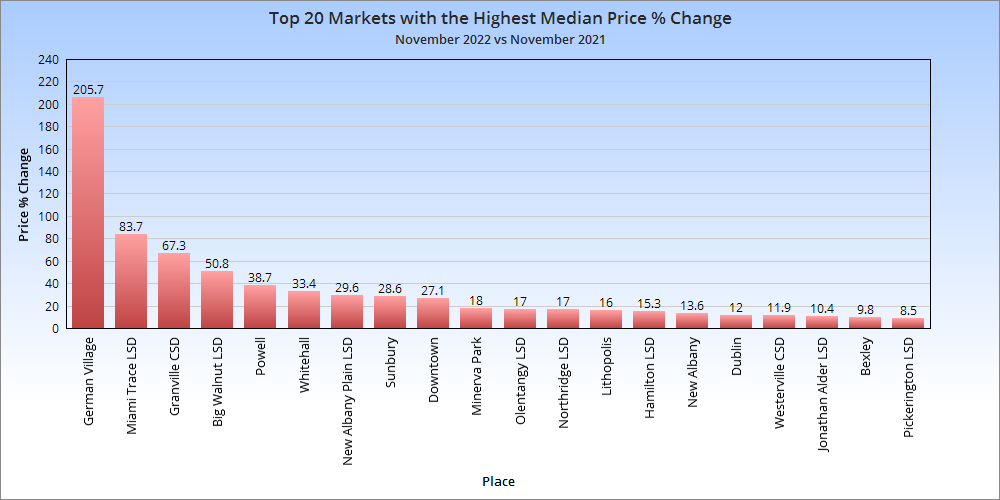
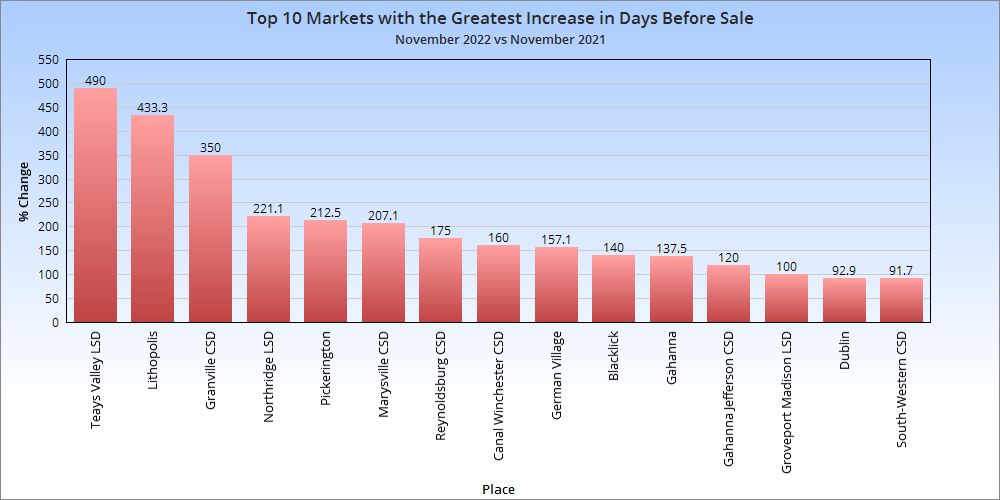
No real surprises except that the greatest increases were in the far southeast metro counties, but that could be because of working with a small supply. Overall Market Median Sales Price in November 2022: $302,867 Based on the 10 Columbus Metro Area counties, the metro price saw a more than $29,000 increase over November, 2021. Overall Market Median Sales Price % Change in November, 2022 versus November, 2021: +10.1% Despite the relative collapse in home sales, prices continued to rise by more than 10% year-over-year.
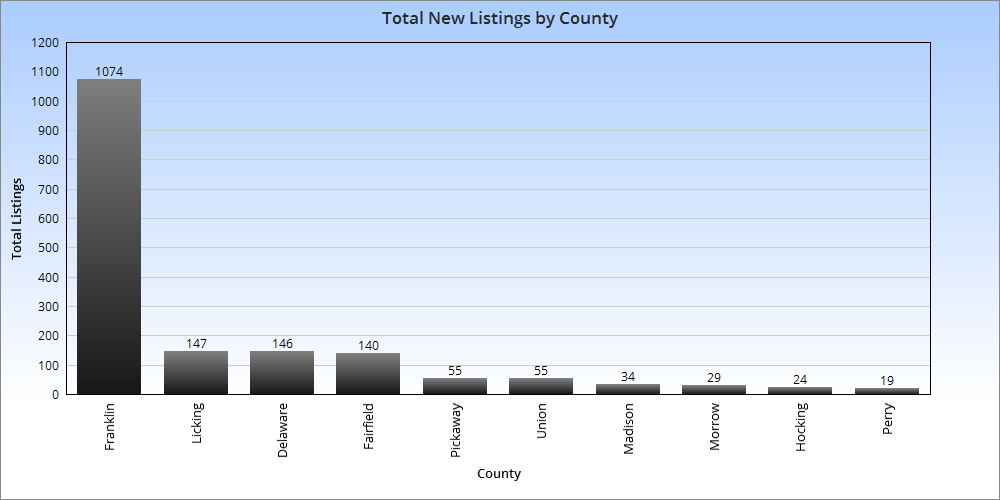
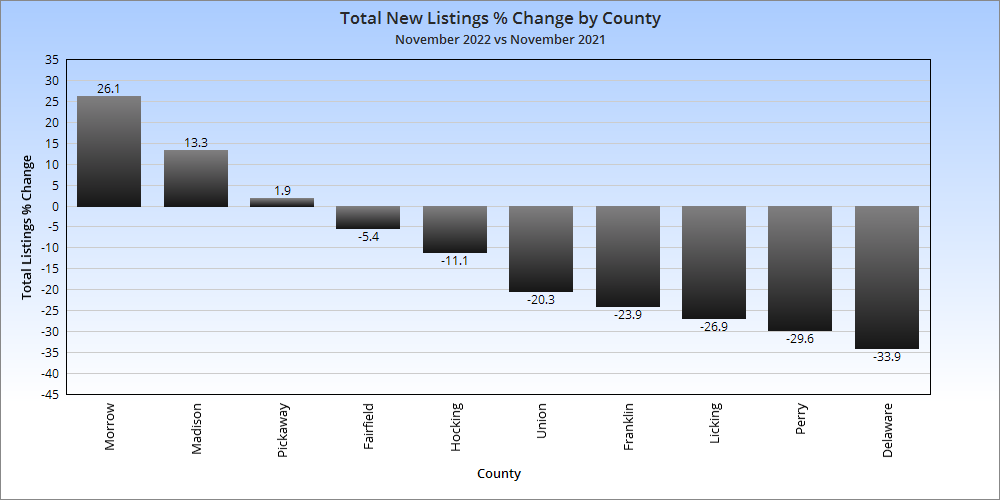
Most counties saw new listing totals drop year-over-year. This may have helped keep prices going up as demand hasn’t evaporated. Total Metro New Listings in November, 2022: 1,723 Total Metro New Listings Change from November, 2021 to November, 2022: -489
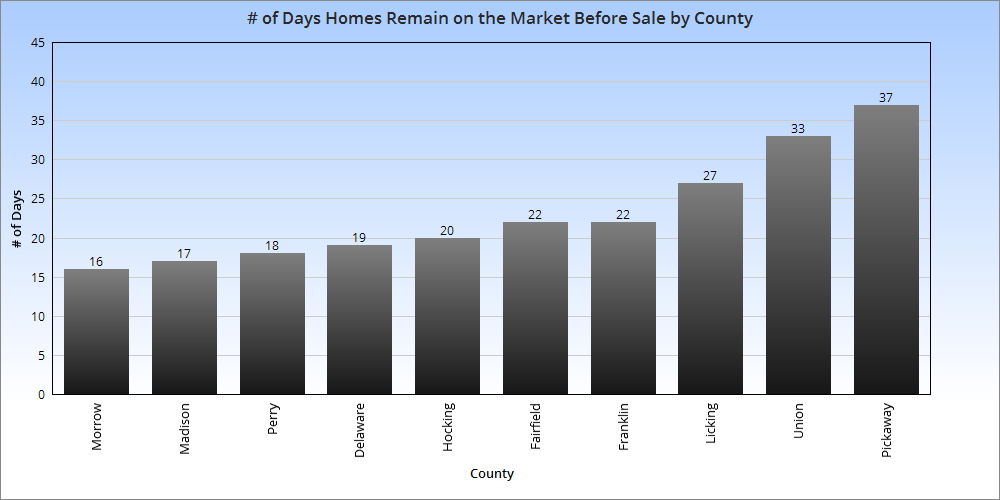
Average # of Days Homes Remain on the Market Before Sale for the Metro Overall in November, 2022: 23.1 # of Days Homes Remain on the Market Before Sale for the Metro November, 2021 vs. November, 2022: +10.5 Homes sold more slowly around the Columbus metro, but only by a few days. The rate of sale is still historically fast.
The Housing Market Update October 2022 data from Columbus Realtors showed a significant slowdown in home sales, but that it didn’t mean homes got cheaper in the process.
Note: LSD= Local School District, CSD= City School District. In both cases, school district boundaries differ from city boundaries.
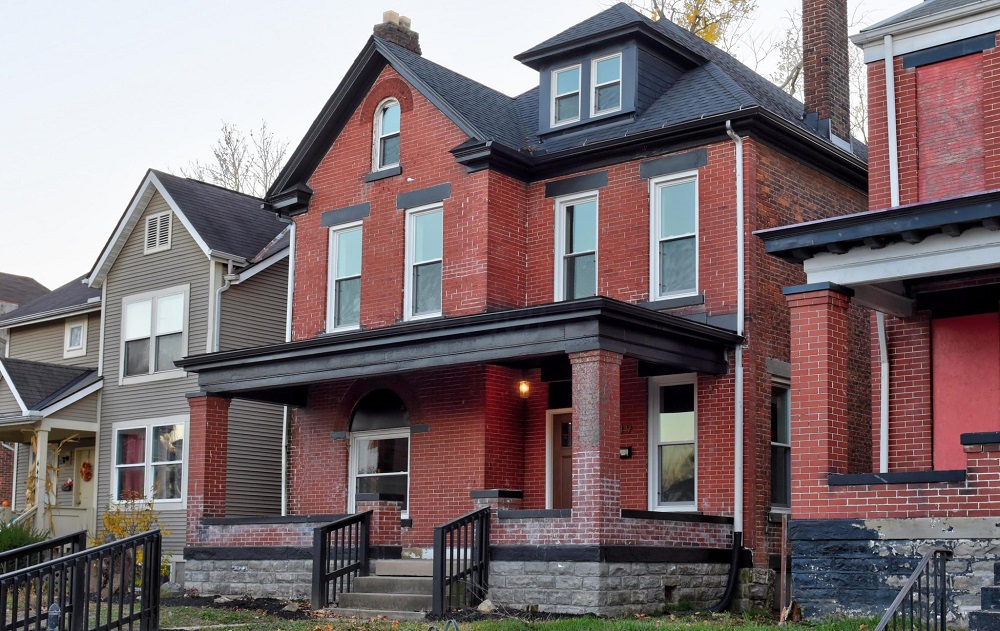
Closed sales are those sales that were completed during the month. They dropped significantly in most counties year-over-year as rising interest rates slowed the white-hot market. But what markets slowed down the most? Only a handful of markets saw an increase, including Johnstown, which is presumably seeing movement due to the Intel project. Most places on this list tended to be among the most expensive local markets, but not all.
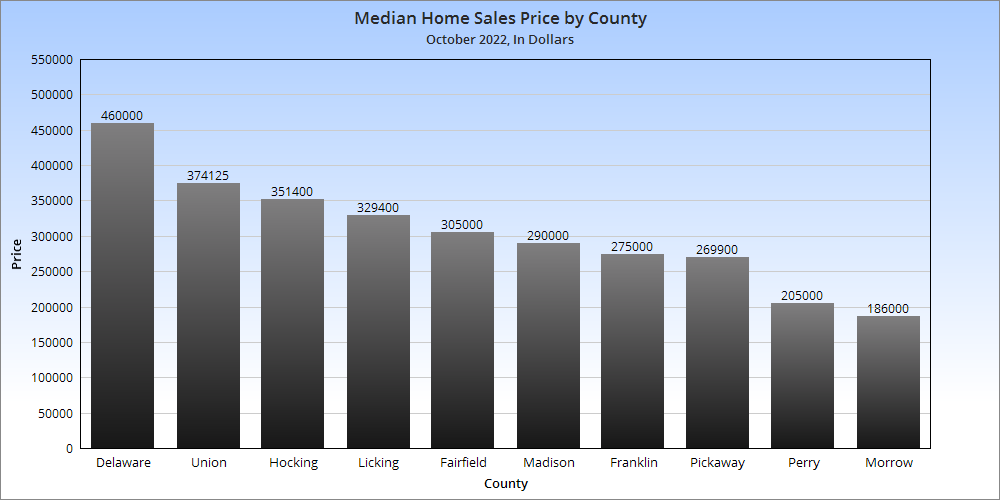
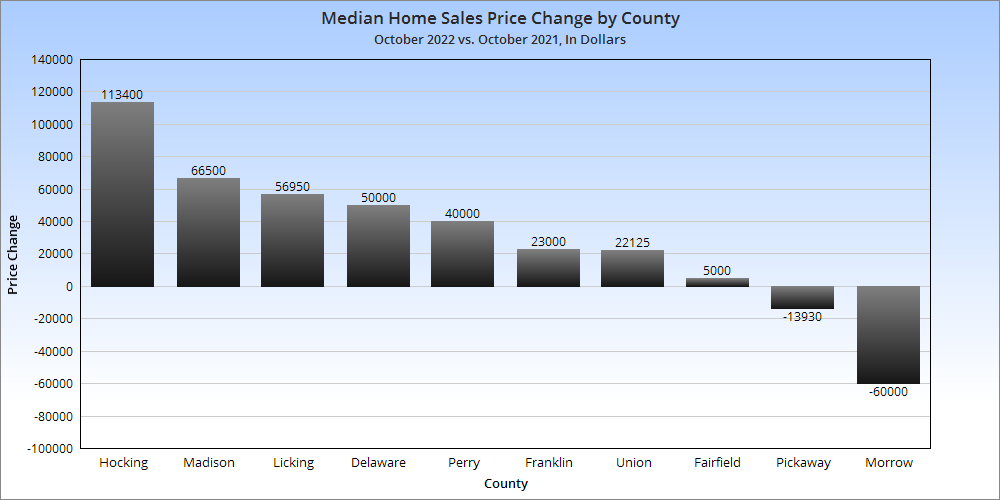
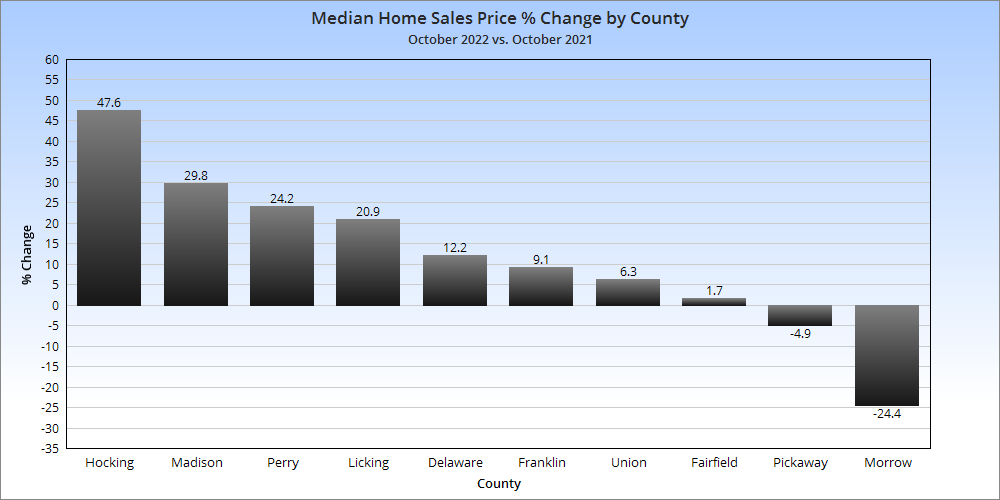
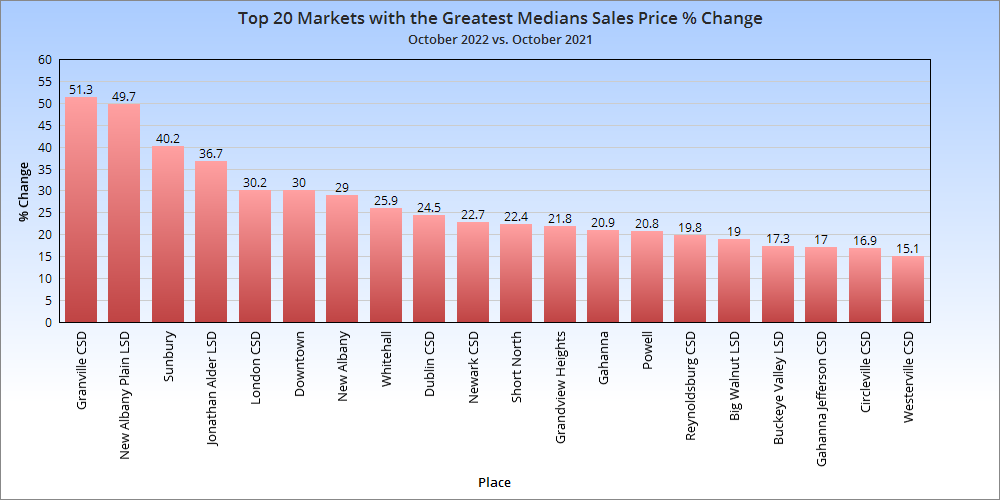
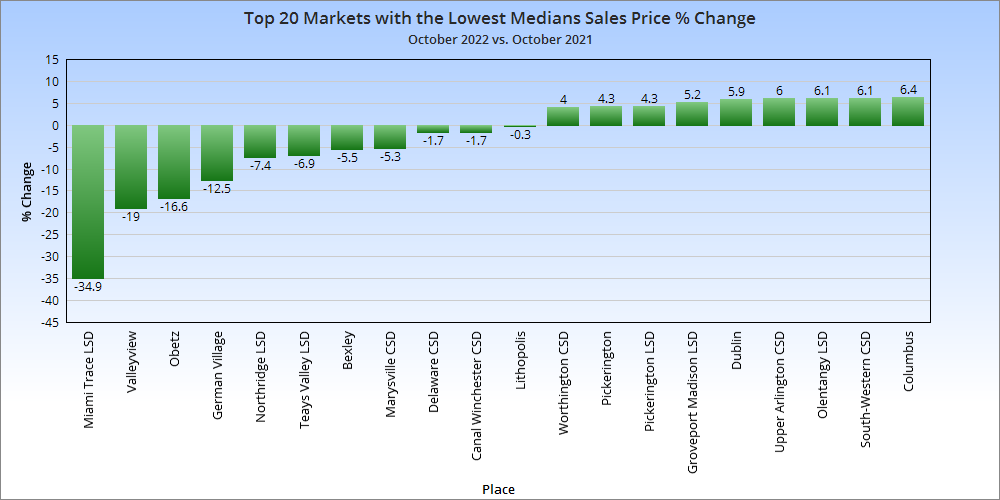
Most counties continued to see price increases, though some were much more modest than others. Franklin County was in the middle of the pack.
Overall Market Median Sales Price in October 2022: $304,583 Based on the 10 Columbus Metro Area counties, the metro price saw about a $12,000 increase vs September, 2022 and a more than $30,000 increase over October, 2021. Overall Market Median Sales Price % Change in October, 2022 versus October, 2021: +10.6%
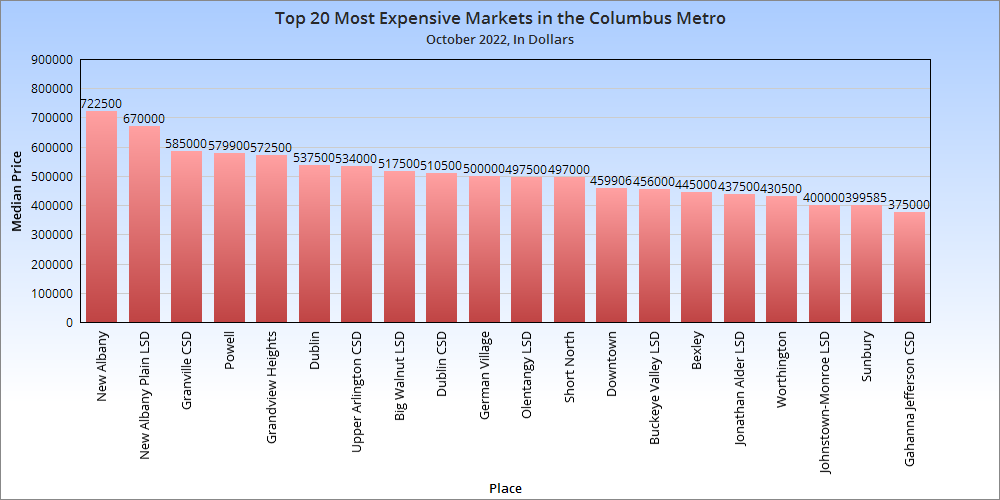
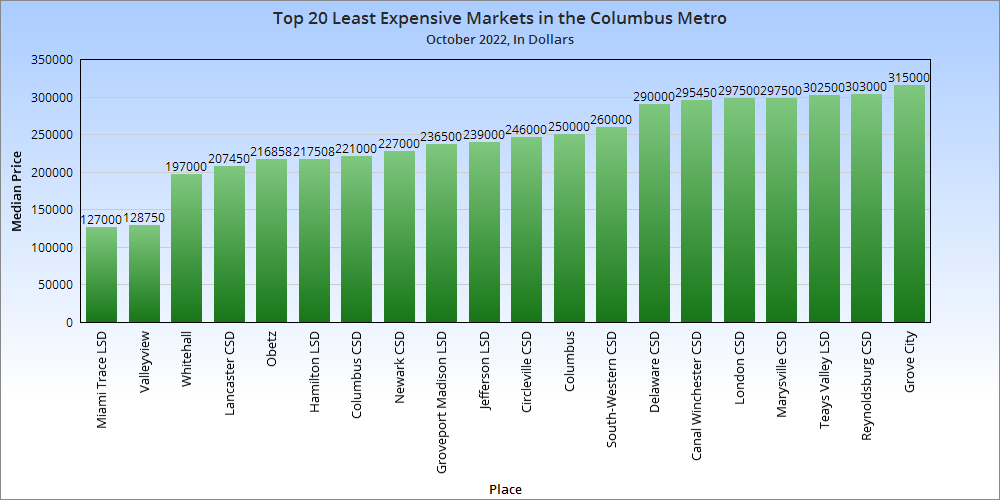
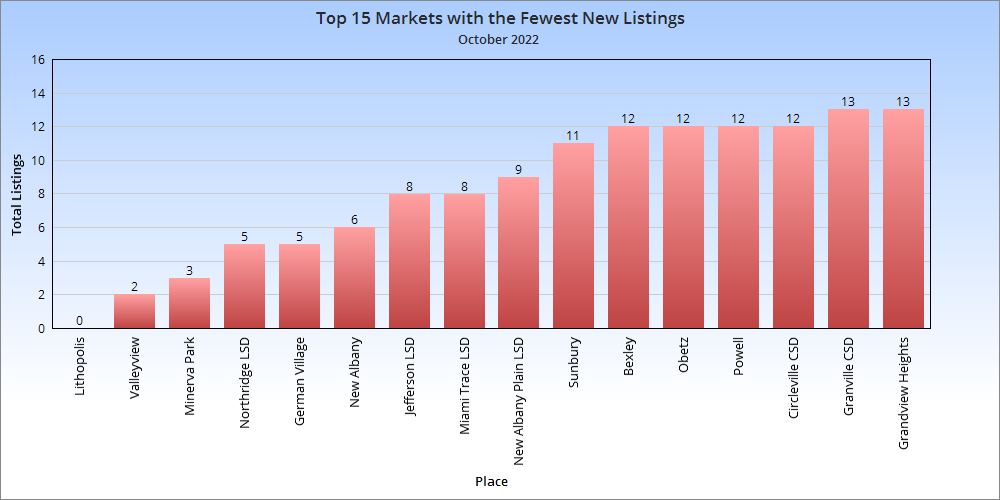
Now let’s take a look at individual neighborhoods and places within the metro area.
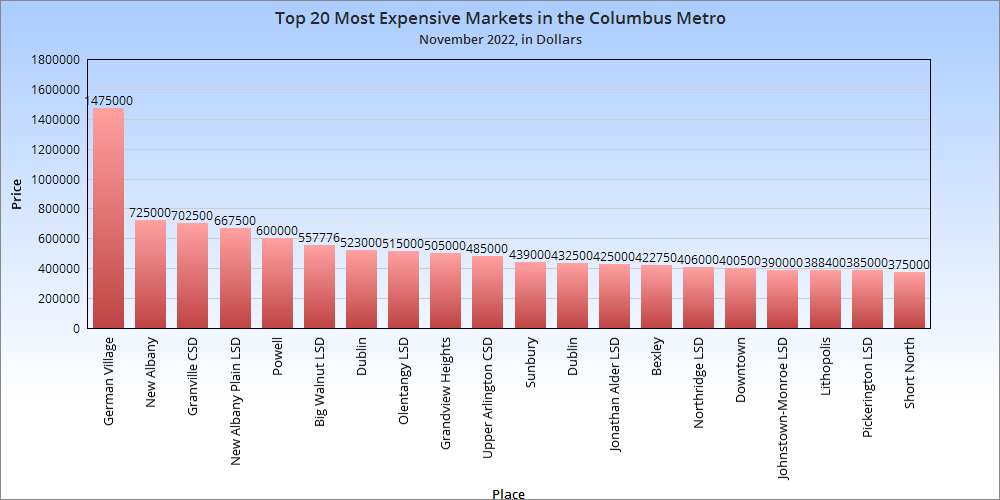
There are few surprises on this chart.
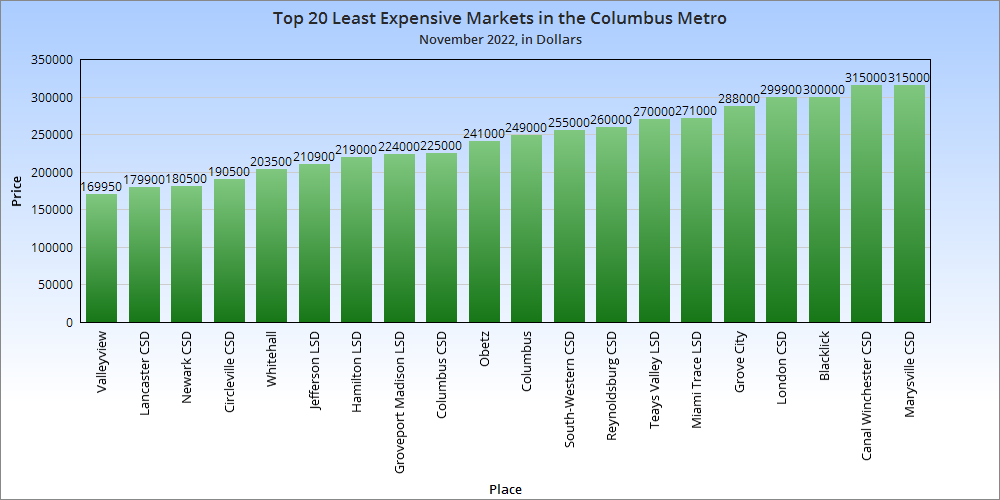
Only 3 markets had a median price below $200,000, 2 of which were within I-270.
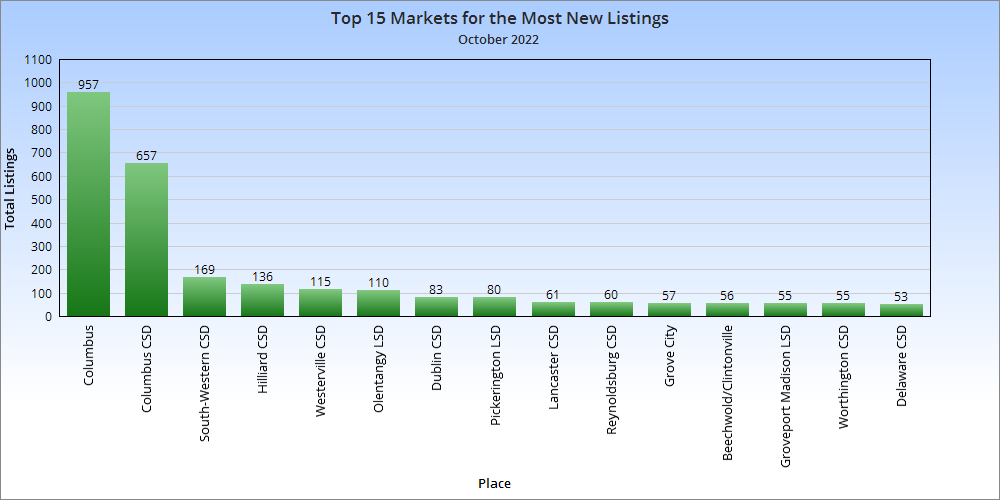
Most counties saw new listing totals drop year-over-year. This is one of the reasons prices remained higher despite large sales drops.
Total Metro New Listings in October, 2022: 2,401 Total Metro New Listings Change from October, 2021 to October, 2022: -497 Year-over-year, new listings were down yet again.
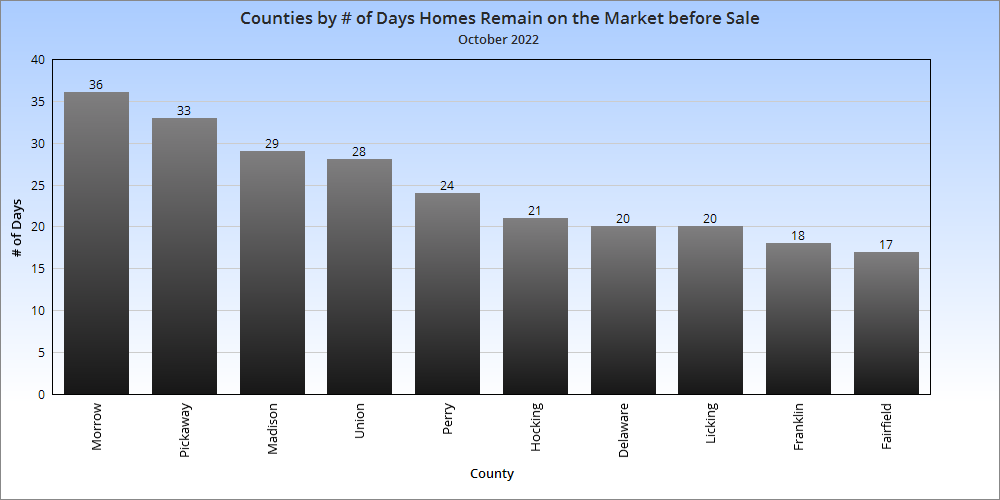
Average # of Days Homes Remain on the Market Before Sale for the Metro Overall in October, 2022: 24.6 # of Days Homes Remain on the Market Before Sale for the Metro October, 2021 vs. October, 2022: +8.2 Homes across the market sold more than a week more slowly year-over year in October.
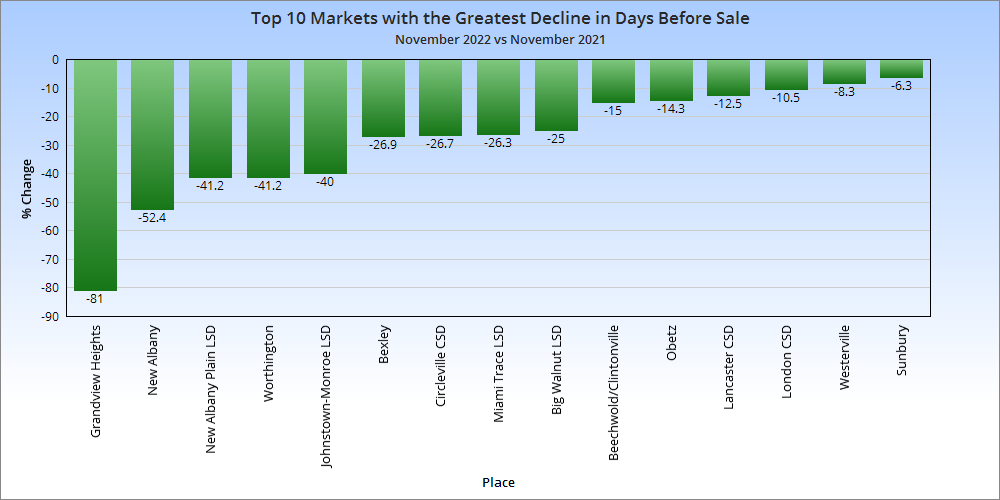
Aside from the half-dozen markets that saw declines, most saw fairly significantly increases in the number of days before sale year-over year.
Overall, the October housing market showed strong signs of a slowdown, but so far, this hasn’t prevented further price increases. Demand for homes seems to be continuing to outpace supply, but perhaps not quite to the level it was earlier in the year.
In this latest edition of the Housing Market Update May 2022, we see that home prices continue to reach record levels in the metro area, and houses are selling faster than ever. With rising mortgage interest rates, will the region eventually see a slowdown?
Note: LSD= Local School District, CSD= City School District. In both cases, school district boundaries differ from city boundaries.
Top 15 Most Expensive Locations By Median Sales Price in May 2022 1. New Albany: $789,900 2. New Albany Plain LSD: $650,000 3. Big Walnut LSD: $572,127 4. Powell: $565,000 5. Upper Arlington CSD: $558,000 6. Dublin: $555,000 7. Grandview Heights: $545,000 8. Granville CSD: $530,000 9. Dublin CSD: $515,000 10. Olentangy LSD: $505,000 11. Buckeye Valley LSD: $495,000 12. Worthington: $481,000 13. German Village: $475,000 14. Bexley: $470,000 15. Pickerington: $444,000 16. Canal Winchester CSD: $430,000 Several suburbs now have median prices at or above half a million dollars, with several others not too far behind.
Top 15 Least Expensive Locations by Median Sales Price in May 2022 1. Lancaster CSD: $175,000 2. Miami Trace LSD: $180,000 3. Newark CSD: $184,000 4. Circleville CSD: $187,500 5. Whitehall CSD: $205,000 6. Jefferson LSD: $220,000 7. London CSD: $227,450 8. Groveport Madison LSD: $243,000 9. Hamilton LSD: $256,700 10. Obetz: $256,700 11. Columbus CSD: $257,500 12. Columbus: $277,750 13. Reynoldsburg CSD: $280,500 14. Minerva Park: $291,500 15. South Western CSD: $295,450 On the opposite side of things, even some of the cheapest markets are approaching the $300K mark. Columbus itself remains *relatively* affordable in comparison to the market overall.
Overall Market Median Sales Price in May: $303,460 Based on the 10 Columbus Metro Area counties.
Top 15 Locations with the Highest Median Sales Price % Growth Between May 2021 and May 2022 1. Canal Winchester CSD: +65.4% 2. Big Walnut LSD: +50.4% 3. Whitehall: +48.6% 4. Northridge LSD: +42.6% 5. Groveport Madison LSD: +39.0% 6. Grandview Heights: +38.3% 7. Granville CSD: +31.7% 8. Gahanna: +27.6% 9. Teays Valley LSD: +26.4% 10. Pataskala: +26.3% 11. Pickerington: +25.1% 12. Downtown: +24.3% 13. Johnstown-Monroe LSD: +23.5% 14. Powell: +22.8% 15. Sunbury: +22.5%
Top 15 Locations with the Lowest Median Sales Price % Growth Between May 2021 and May 2022 1. German Village: -24.6% 2. Miami Trace LSD: -19.3% 3. Obetz: -14.0% 4. Bexley: -5.5% 5. Delaware CSD: -4.7% 6. New Albany: -2.5% 7. Minerva Park: -2.2% 8. Lancaster CSD: -0.6% 9. Newark CSD: -0.1% 10. Jonathan Alder LSD: 0.0% 11. Short North: 0.5% 12. London CSD: +1.1% 13. Westerville: +2.4% 14. Circleville CSD: +3.0% 15. Beechwold/Clintonville: +3.5% So far, the “Intel Effect” has yet to kick in in places like Newark and some Northeast Side communities. Only Johnstown is seeing a significant price increase. This may have to do with some of these places already being overvalued, especially New Albany.
Overall Market Median Sales Price % Change May 2022 vs. May 2021:+14.5% Based on 53 metro market locations.
Top 10 Locations with the Most New Listings in May 2022 1. Columbus: 1,337 2. Columbus CSD: 898 3. Olentangy LSD: 214 4. South Western CSD: 210 5. Hilliard CSD: 162 6. Dublin CSD: 146 7. Westerville CSD: 139 8. Worthington CSD: 94 9. Dublin: 90 10. Lancaster CSD: 88
Top 10 Locations with the Fewest New Listings in May 2022 1. Valleyview: 0 2. Lithopolis: 2 3. Minerva Park: 5 4. Obetz: 6 5. Jefferson LSD: 12 6. Northridge LSD: 14 7. Johnstown-Monroe LSD: 15 8. Miami Trace LSD: 18 9. Sunbury: 20 10. Granville CSD: 20 11. German Village: 21
Total New Listings in the Columbus Metro in May 2022:+3,362 Overall Metro New Listings % Change May 2022 vs May 2021:-3.1% New listings fell in May year-over-year even though the late spring is often a time when more homes go onto the market. Franklin County had one of the largest declines in inventory, dropping about 6.9%.
Top 10 Fastest-Selling Locations by # of Days Homes Remain on the Market Before Sale in May 2022 1. Grandview Heights: 3 2. Canal Winchester CSD: 4 3. Hilliard: 4 4. Miami Trace LSD: 4 5. Minerva Park: 4 6. Westerville: 4 7. Westerville CSD: 4 8. German Village: 5 9. Hilliard CSD: 5 10. Marsyville CSD: 5 11. Powell: 5 12. Reynoldsburg CSD: 5 13. Sunbury: 5 14. Worthington: 5 15. Worthington CSD: 5 16. Bexley: 6 17. Dublin: 6 18. Groveport Madison LSD: 6 19. Jefferson LSD: 6 20. Pickerington: 6 21. Hamilton LSD: 7 22. Lancaster CSD: 7 23. Newark CSD: 7 24. Pickerington LSD: 7 25. Upper Arlington CSD: 7 26. Whitehall: 7 27. Beechwold/Clintonville: 8 28. Gahanna: 8 29. Delaware CSD: 9 30. South Western CSD: 9 31. Blacklick: 10 32. Columbus: 10 33. Johnstown-Monroe LSD: 10 34. Gahanna Jefferson LSD: 12 35. Dublin CSD: 13 36. Grove City: 13
The “Top 10” became the Top 36 just given that most of the local markets are selling so similarly quickly. There is relatively little spread between the fastest and slowest-selling markets, with some obvious exceptions.
Top 10 Slowest-Selling Locations by # of Days Homes Remain on the Market Before Sale in May 2022 1. Northridge LSD: 84 2. Downtown: 75 3. New Albany: 29 4. Buckeye Valley LSD: 28 5. Granville CSD: 27 6. Teays Valley LSD: 27 7. London CSD: 26 8. Short North: 25 9. Jonathan Alder LSD: 22 10. Big Walnut LSD: 20 11. New Albany LSD: 19 12. Obetz: 19 13. Pataskala: 19
Top 10 Locations with the Greatest % Decline of # of Days on the Market Before Sale May 2022 vs. May 2021 1. Bexley: -76.0% 2. Jefferson LSD: -73.9% 3. Lancaster CSD: -72.0% 4. Dublin: -68.4% 5. Johnstown-Monroe LSD: -64.3% 6. Grandview Heights: -62.5% 7. Reynoldsburg CSD: -58.3% 8. Short North: -51.0% 9. Hamilton LSD: -50.0% 10. Hilliard: -50.0% 11. Westerville: -50.0% 12. Hilliard CSD: -44.4%
Top 10 Locations with the Lowest % Decline of # of Days on the Market Before Sale May 2022 vs. May 2021 1. Northridge LSD: +1,300.0% 2. Jonathan Alder LSD: +633.3% 3. Valleyview: +400.0% 4. London CSD: +188.9% 5. New Albany: +141.7% 6. New Albany LSD: +111.1% 7. Downtown: +92.3% 8. Granville CSD: +80.0% 9. Circleville CSD: +77.8% 10. Teays Valley LSD: +68.8%
% Change for the # of Days Homes Remain on the Market Before Sale Across the Metro Overall: 15.6 Overall Metro Days on Market % Change May 2022 vs May 2021: -1.3%
Columbus Realtors offers monthly housing reports and other data back several years.
All data for the Housing Market Update comes from Columbus Realtors.
Note: LSD= Local School District, CSD= City School District. In both cases, school district boundaries differ from city boundaries.
Top 15 Most Expensive Locations By Median Sales Price in April 2022 1. New Albany: $650,000 2. New Albany Plain LSD: $635,000 3. Powell: $605,663 4. Grandview Heights: $585,000 5. Upper Arlington CSD: $580,000 6. Granville CSD: $566,500 7. German Village: $565,000 8. Bexley: $562,000 9. Dublin: $547,500 10. Olentangy LSD: $508,900 11. Worthington: $507,500 12. Dublin CSD: $480,000 13. Big Walnut LSD: $463,178 14. Hilliard: $450,000 15. Sunbury: $427,500
Top 15 Least Expensive Locations by Median Sales Price in April 2022 1. Newark CSD: $175,000 2. Whitehall: $190,000 3. Lancaster CSD: $190,000 4. Circleville CSD: $200,000 5. Miami Trace LSD: $210,000 6. Hamilton LSD: $214,500 7. Obetz: $220,000 8. London CSD: $244,750 9. Columbus CSD: $247,000 10. Groveport Madison LSD: $253,500 11. Columbus: $263,000 12. South Western CSD: $275,000 13. Jefferson LSD: $285,000 14. Reynoldsburg CSD: $299,850 15. Gahanna: $310,000 Even the cheapest markets are mostly above $200K now.
Overall Market Median Sales Price in April: $300,875 Based on the 10 Columbus Metro Area counties. This price was slightly lower than in May.
Top 15 Locations with the Highest Median Sales Price % Growth Between April 2021 and April 2022 1. Minerva Park: +59.6% 2. Lithoplis: +44.1% 3. Jefferson LSD: +43.9% 4. Miami Trace LSD: +40.0% 5. Pataskala: +39.6% 6. Granville CSD: +38.2% 7. Sunbury: +37.7% 8. Canal Winchester CSD: +36.7% 9. New Albany Plain LSD: +35.3% 10. Grove City: +30.4% 11. Groveport Madison LSD: +29.3% 12. Worthington CSD: +27.8% 13. Reynoldsburg CSD: +26.0% 14. Newark CSD: +25.0% 15. Upper Arlington CSD: +24.7%
Top 15 Locations with the Lowest Median Sales Price % Growth Between April 2021 and April 2022 1. Jonathan Alder LSD: -21.6% 2. Short North: -18.6% 3. Buckeye Valley LSD: -17.6% 4. Lancaster CSD: -5.0% 5. New Albany: -4.1% 6. Obetz: -2.3% 7. German Village: -0.9% 8. Beechwold/Clintonville: +4.3% 9. Dublin: +6.5% 10. Bexley: +6.5% 11. Dublin CSD: +9.8% 12. Hamilton LSD: +9.9% 13. Westerville: +11.9% 14. Columbus CSD: +13.8% 15. Olentangy LSD: +14.0% 16. Columbus: +15.1% Columbus core neighborhoods and Columbus overall saw some of the smallest or even negative price changes.
Overall Market Median Sales Price % Change April 2022 vs. April 2021:+19.8%
Top 10 Locations with the Most New Listings in April 2022 1. Columbus: 1,260 2. Columbus CSD: 856 3. South Western CSD: 223 4. Olentangy LSD: 170 5. Westerville CSD: 161 6. Hilliard CSD: 136 7. Dublin CSD: 131 8. Pickerington LSD: 99 9. Grove City: 93 10. Worthington CSD: 91
Top 10 Locations with the Fewest New Listings in April 2022 1. Valleyview: 1 2. Lithopolis: 3 3. Jefferson LSD: 5 4. Minerva Park: 6 5. Grandview Heights: 7 6. Northridge LSD: 8 7. Obetz: 10 8. German Village: 10 9. Sunbury: 11 10. Jonathan Alder LSD: 12 11. Hamilton LSD: 15 12. Granville CSD: 15
Total New Listings in the Columbus Metro in April 2022:+3,194 Overall Metro New Listings % Change April 2022 vs April 2021:-1.7%
Top 10 Fastest-Selling Locations by # of Days Homes Remain on the Market Before Sale in April 2022 1. Gahanna: 3 2. Jefferson LSD: 3 3. Minerva Park: 3 4. Worthington: 3 5. Blacklick: 4 6. Canal Winchester CSD: 4 7. Gahanna Jefferson CSD: 4 8. Jonathan Alder LSD: 4 9. Obetz: 4 10. Big Walnut LSD: 5 11. Hilliard CSD: 5 12. Powell: 5 13. Sunbury: 5 14. Dublin: 6 15. Hilliard: 6 16. Lithopolis: 6 17. Reynoldsburg CSD: 6 18. Whitehall: 6 19. Worthington CSD: 6 20. Hamilton LSD: 7 21. Miami Trace LSD: 7 22. Westerville: 7 23. Dublin CSD: 8 24. Groveport Madison LSD: 8 25. Upper Arlington CSD: 8 26. Beechwold/Clintonville: 9 27. Westerville CSD: 9 28. Granville CSD: 10 29. Marysville CSD: 10 30. Pickerington LSD: 10 31. Bexley: 11 32. Columbus: 11 33. Delaware CSD: 11 34. German Village: 11 35. Johnstown-Monroe LSD: 11 36. Lancaster CSD: 11 37. Newark CSD: 11 38. Olentangy LSD: 11 39. Pickerington: 11 40. Circleville CSD: 13 41. Grandview Heights: 13
Top 10 Slowest-Selling Locations by # of Days Homes Remain on the Market Before Sale in April 2022 1. Northridge LSD: 58 2. Downtown: 40 3. Short North: 31 4. London CSD: 24 5. Buckeye Valley LSD: 23 6. Grove City: 22 7. Pataskala: 21 8. New Albany: 20 9. Teays Valley LSD: 15 10. Columbus CSD: 14 11. New Albany Plain LSD: 14 12. South Western CSD: 14
Top 10 Locations with the Greatest % Decline of # of Days on the Market Before Sale April 2022 vs. April 2021 1. Miami Trace LSD: -86.3% 2. Gahanna: -76.9% 3. Gahanna Jefferson CSD: -75.0% 4. Granville CSD: -74.4% 5. Blacklick: -71.4% 6. German Village: -71.1% 7. New Albany Plain LSD: -64.1% 8. Obetz: -63.6% 9. New Albany: -59.2% 10. Upper Arlington CSD: -55.6%
Top 10 Locations with the Lowest % Decline of # of Days on the Market Before Sale April 2022 vs. April 2021 1. Lithopolis: +200.0% 2. Northridge LSD: +176.2% 3. Grove City: +69.2% 4. Sunbury: +66.75 5. Pataskala: +61.5% 6. London CSD: +60.0% 7. South Western CSD: +55.6% 8. Downtown: +48.1% 9. Westerville: +40.0% 10. Delaware CSD: +37.5% 11. Johnstown-Monroe LSD: +37.5%
Total # of Days Homes Remain on the Market Before Sale Across the Metro Overall: 13.7 Overall Metro Days on Market % Change April 2022 vs April 2021: -35.7% Homes were selling on average almost 8 days after than a year ago.
In today’s cool link edition, we have a new study by the site Demographia that offers a housing affordability comparison for more than 90 markets across 8 different countries/places around the world. What is different about this study is that the comparison is done including a housing cost to income ratio, meaning that it takes into account local incomes versus housing prices. That makes it much more accurate in terms of an overall market comparison.
Columbus ranks fairly well, overall, along with Ohio’s other 2 main markets in Cincinnati and Cleveland. Despite all the local complaints about housing becoming unaffordable, relative to just about everywhere else in the US, Ohio markets are actually inexpensive. That doesn’t mean that housing costs aren’t rising quickly or that more and more people aren’t being priced out of buying and owning a home, because that’s definitely happening and certainly an increasing problem. It just means that the problem isn’t quite as bad locally as it is in most other places.