The US Census has released 2024 county and metro population estimates. The estimates generally show a further continuation of the post-pandemic recovery in the numbers. In fact, older estimates have also been revised upwards. Let’s break down the numbers.
Metro County
2020 Census
2023 Population
2024 Population
Delaware
214,123
232,732
237,966
Fairfield
158,920
165,630
167,762
Franklin
1,323,819
1,338,903
1,356,303
Hocking
28,056
27,567
27,429
Licking
178,517
183,540
184,898
Madison
43,848
44,668
45,531
Morrow
34,944
35,583
35,927
Perry
35,412
35,577
35,682
Pickaway
58,551
61,064
62,158
Union
62,790
69,765
71,721
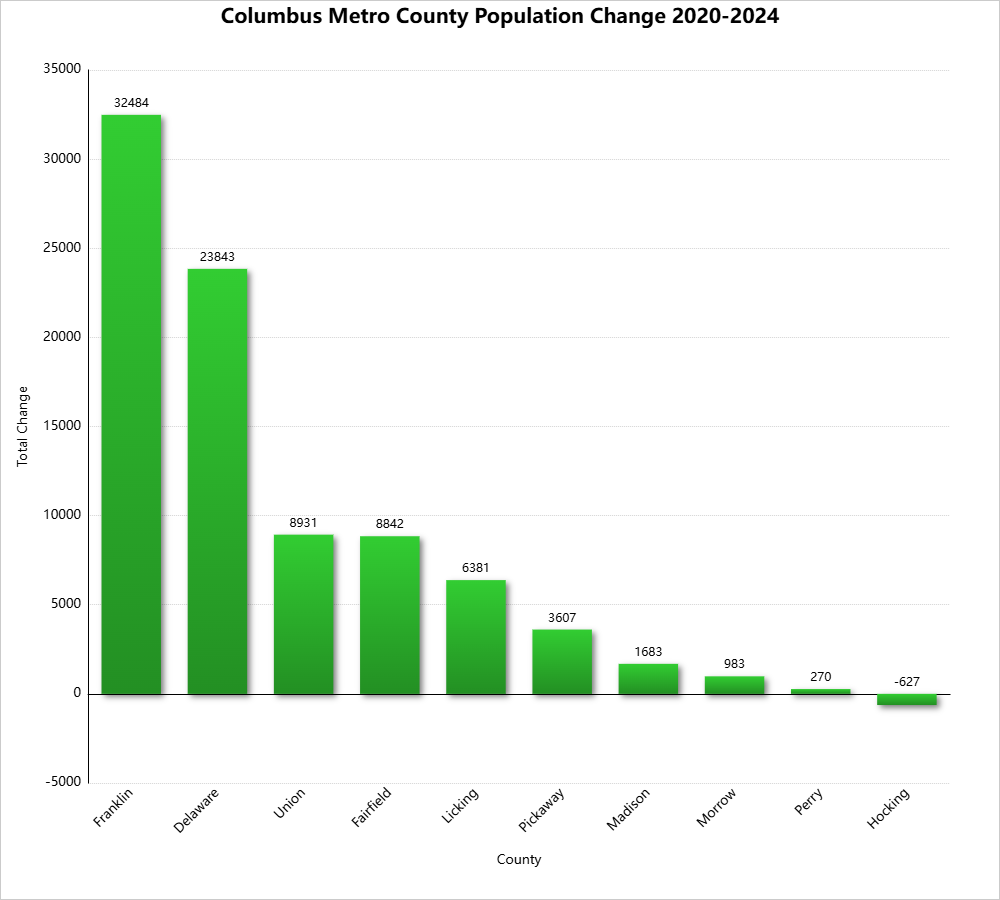
As you can see, all counties but Hocking grew in both the 2020-2024 and 2023-2024 periods. Most of the estimates were improvements over the 2023 version, as mentioned. For example, Franklin County’s estimates population in 2023 was 1,326,063, but the 2024 version for 2023 was revised to 1,338,903, indicating growth was significantly stronger than originally estimated.
Franklin County continued its very long run of being the top county in the metro for total growth.
Happy day! The 2020 Census data is finally beginning to be released after months of delays, including 2020 census state populations. Let’s take a look.
In many cases, the 2020 estimates had significant errors. New York was found to have more than 800,000 people above what the estimate was. The estimate assumed the state had lost population the past decade, but it had actually gained well over 800,000. Ohio was also undercounted by more than 106,000. In general, the Census estimates had Northern states with either too large losses/too slow growth than reality, while Southern states were generally estimated to have grown more than they really did. This has been a long-standing bias within the Census estimates program.
Total Change By Region Between 2000-2010 and 2010-2020 South: -2,571,014 Midwest: -475,772 Northeast: +531,490 West: -2,104,601
Ohio moved into the top 25 in total growth and was one of the top states for the biggest improvement between the 2000s and 2010s. However, because it was already one of the most-populated states in the nation, its total growth still wasn’t enough for it to not lose another House district. The state will have to keep improving if it wants to maintain its level of representation in Congress. Meanwhile, the fast-growing South and West regions clearly slowed down in growth the past decade. Combined, they added 4.675 million fewer people the past decade than they did during the 2000s. The Midwest was more of a mixed bag, with more states improving, but Illinois cancelling out all of that positive momentum. Only the Northeast managed to add more people the past decade than it did during the 2000s, mostly led by a huge improvement in New York.
The Census will release 2020 population numbers for counties, cities and other places over the next few months, and will be posted here when they are.
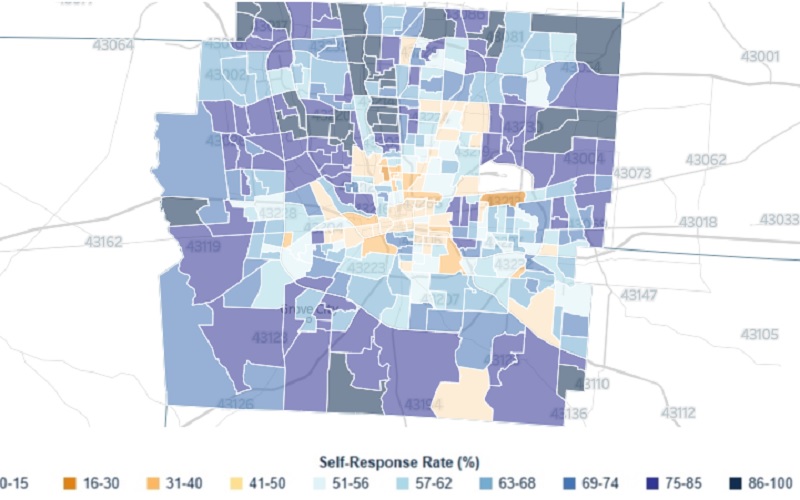
The 2020 US Census is currently winding down, perhaps somewhat earlier than planned, but wrapping up nonetheless. The accuracy of the Census relies heavily on enough people responding to the surveys. Because of the pandemic this year, the internet has played a bigger role in the response rates than normal, but there were still plenty of door to door workers doing surveys. How did Columbus, Central Ohio and other parts of the state do? Here are the Ohio census 2020 response rates.
First, let’s look at Ohio counties. These numbers are through September 2nd.
Top 10 counties for Census Response 1. Medina County: 81.9% 2. Delaware County: 79.7% 3. Geauga County, Warren County: 78.7% 4. Union County: 78.0% 5. Lake County: 77.4% 6. Auglaize County: 76.9% 7. Wayne County: 76.8% 8. Greene County: 76.0% 9. Miami County: 75.9% 10. Fulton County: 75.2%
Bottom 10 Counties for Census Response 1. Harrison County: 55.5% 2. Morgan County: 57.7% 3. Vinton County: 57.9% 4. Pike County: 58.5% 5. Monroe County: 58.8% 6. Lawrence County: 59.3% 7. Scioto County: 59.4% 8. Meigs County: 59.6% 9. Adams County: 59.9% 10. Ashtabula County, Athens County: 60.8%
Most of the high-reporting counties were large metro counties, while most of the low ones were Appalachia. This may be related to access to the internet, which again, played a crucial role this year.
Here are the counties that anchor Ohio’s largest metros Lucas County: 64.6% Cuyahoga County: 65.5% Franklin County: 66.7% Hamilton County: 66.7% Mahoning County: 67.4% Montgomery County: 68.0% Stark County: 74.3%
Columbus’ Franklin County was tied for 3rd worst.
Now let’s look at Central Ohio cities and towns. Minerva Park: 88.6% Worthington: 86.8% Upper Arlington: 85.7% Westerville: 83.2% Dublin: 82.7% Canal Winchester: 81.8% Grandview Heights: 81.8% Gahanna: 81.1% New Albany: 81.1% Bexley: 79.5% Grove City: 78.9% Groveport: 78.9% Pataskala: 77.4% Hilliard: 77.0% Valleyview: 76.5% Reynoldsburg: 75.3% Obetz: 72.7% Pickerington: 71.6% Columbus: 62.1% Whitehall: 58.5%
Generally, the more urban commmunities tended to do worse than the outer suburbs. This has implications on urban areas possibly being undercounted, though the response rates are generally similar to what they were in 2010, so that concern is probably overblown to some extent.
If your’e interested in taking a further look at Ohio’s and other states numbers, visit the following link, in which response rates are tracked all the way down to the Census Tract level: https://2020census.gov/en/response-rates/self-response.html
The Census has just released 2019 city population estimates. These estimates are good for July 1, 2019. Let’s take a look at how Columbus compares to other cities in Ohio.
In 2010, 4 Columbus metro communities were in the top 30. By last year, 6 were, with more poised to enter the list in the coming years. This represents the Columbus region’s growing influence in the state and how its share of the state’s population continues to increase.
2018 to 2019, Columbus had 12 cities in the top 30, a lower number than the average of the decade. This is not necessarily indicating a slowdown in growth within the metro, however. The final year before a decennial census, population estimates tend to be used for final adjustments. This means that if a city is thought to have been estimated too high or too low through the decade, the final estimate year is adjusted accordingly and not necessarily according to true growth. The point of estimates is to get a snapshot of the population at the time of the estimate, but they are constantly being changed every time a new estimate comes out. This usually leaves the final estimate year as showing the slowest growth. This was true for 2008-2009 as well.
Out of the 101 communities of any size in the Metro, 81 of them have either steady populations or estimated growth since 2010. Most of the 20 that have shown declines are very small communities in the Appalachia counties of Perry and Hocking, the furthest removed from Columbus’ influence.
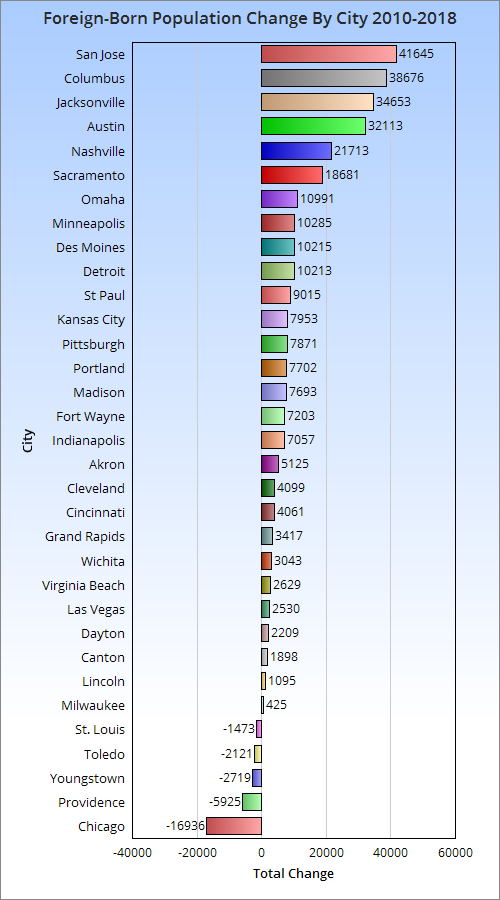
In the ongoing series discussing topics related to the 2018 Census demographic estimates, today I will update the foreign-born comparison. Beyond the simple comparison, I will also talk about the regions and countries that the foreign-born populations come from.
Total Foreign-Born Population Rank by City 2010 and 2018 2010————————————-——-2018 1. Chicago: 557,674—————1. Chicago: 540,738 2. San Jose: 366,194————-2. San Jose: 407,839 3. Austin: 148,431—————-3. Austin: 180,544 4. Las Vegas: 130,503———–4. Las Vegas: 133,033 5. Sacramento: 96,105———-5. Columbus: 125,339 6. Columbus: 86,663————-6. Sacramento: 114,786 7. Portland: 83,026—————7. Jacksonville: 111,798 8. Jacksonville: 77,145——–8. Nashville: 95,040 9. Indianapolis: 74,707——–9. Portland: 90,728 10. Nashville: 73,327———-10. Indianapolis: 81,764 11. Minneapolis: 57,846——11. Minneapolis: 68,131 12. Milwaukee: 57,222——–12. St. Paul: 59,381 13. Providence: 52,920——-13. Milwaukee: 57,647 14. St. Paul: 50,366———–14. Omaha: 50,279 15. Virginia Beach: 40,756—15. Providence ;46,995 16. Omaha: 39,288————16. Detroit: 44,520 17. Wichita: 39,128————17. Kansas City: 43,485 18. Kansas City: 35,532——18. Virginia Beach: 43,385 19. Detroit: 34,307————19. Wichita: 42,171 20. Madison: 24,929———20. Madison: 32,622 21. St. Louis: 23,011———-21. Des Moines: 31,013 22. Lincoln: 22,214———–22. Pittsburgh: 26,569 23. Des Moines: 20,798—–23. Lincoln: 23,309 24. Pittsburgh: 18,698——24. Fort Wayne: 22,489 25. Cleveland: 17,739——-25. Cleveland: 21,838 26. Grand Rapids: 16,615—26. St. Louis: 21,538 27. Cincinnati: 16,531——-27. Cincinnati: 20,592 28. Fort Wayne: 15,286—-28. Grand Rapids: 20,032 29. Toledo: 11,159———–29. Akron: 13,649 30. Akron: 8,524————30. Toledo: 9,038 31. Dayton: 5,102———–31. Dayton: 7,311 32. Youngstown: 3,695—-32. Canton: 3,241 33. Canton: 1,343———–33: Youngstown: 976
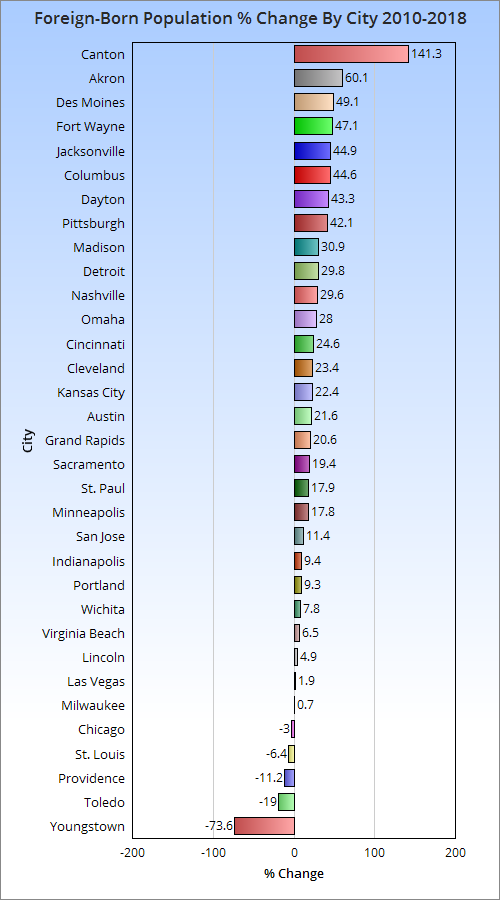
Here’s the 2010-2018 total change. And the 2010-2018 change by %.
Columbus has done very well in both total and % growth of its foreign-born population since 2010.
So now that we know how many foreign-born immigrants are arriving and how fast, let’s take a look at where they are coming from.
Total Foreign-Born Residents From Europe in 2000 and 2018 2000———————————————–2018 1. Chicago: 145,462———————1. Chicago: 91,397 2. San Jose: 21,904———————2. San Jose: 22,043 3. Portland: 17,572———————-3. Jacksonville: 18,808 4. Jacksonville: 10,883————4. Portland: 17,016 5. Las Vegas: 9,070—————-5. Austin: 11,981 6. Cleveland: 8,796—————-6. Las Vegas: 11,472 7. St. Louis: 8,543——————7. Columbus: 8,141 8. Sacramento: 8,204————-8. Nashville: 8,108 9. Milwaukee: 7,841—————9. Virginia Beach: 6,710 10. Austin: 7,474——————10. Sacramento: 6,275 11. Pittsburgh: 7,413————–11. Pittsburgh: 5,047 12. Columbus: 7,017————–12. Minneapolis: 5,031 13. Indianapolis: 6,543———–13. Omaha: 3,845 14. Virginia Beach: 6,333——–14. St. Louis: 4,711 15. Detroit: 5,600—————–15. Indianapolis: 4,199 16. Minneapolis: 5,409———–16. Omaha: 3,845 17. Providence: 5,126————-17. Milwaukee: 3,808 18. Nashville: 4,859—————18. Madison: 3,519 19. Cincinnati: 3,851————–19. Providence: 3,030 20. Grand Rapids: 3,396———20. Lincoln: 2,777 21. Omaha: 3,320—————–21. Cincinnati: 2,738 22. St. Paul: 3,255—————-22. St. Paul: 2,449 23. Des Moines: 3,216———–23. Grand Rapids: 2,336 24. Kansas City: 2,985———-24. Kansas City: 2,320 25. Madison: 2,871—————25. Fort Wayne: 2,235 26. Lincoln: 2,701—————-26. Wichita: 1,851 27. Akron: 2,687—————–27. Detroit: 1,767 28. Fort Wayne: 2076———–28. Akron: 1,580 29. Toledo: 2,020—————-29. Des Moines: 1,042 30. Wichita: 2,004————–30. Toledo: 496 31. Dayton: 901——————31. Canton: 347 32. Youngstown: 870———–32. Dayton: 347 33. Canton: 590—————–33. Youngstown: 337
Columbus had more European immigrants than most in 2000 and 2018, and was one of the relatively few cities that saw an increase by 2018.
Total Foreign-born Population from Asia 2000 and 2018 2000————————————————–2018 1. San Jose: 182,712—————————1. San Jose: 256,504 2. Chicago: 112,932—————————2. Chicago: 144,970 3. Sacramento: 40,253———————3. Austin: 59,711 4. Portland: 26,271—————————4. Sacramento: 56,084 5. Austin: 25,036——————————5. Columbus: 49,185 6. St. Paul: 23,245———————-6. Portland: 42,245 7. Columbus: 22,354——————-7. Jacksonville: 39,543 8. Jacksonville: 17,427—————–8. Las Vegas: 35,959 9. Minneapolis: 17,376—————–9. St. Paul: 34,246 10. Las Vegas: 17,062—————–10. Nashville: 28,142 11. Virginia Beach: 15,176————-11. Indianapolis: 24,992 12. Detroit: 15,114———————-12. Virginia Beach: 21,954 13. Nashville: 12,573——————-13. Milwaukee: 18,192 14. Milwaukee: 12,114——————14. Minneapolis: 17,929 15. Wichita: 10,826——————–15. Detroit: 17,474 16. Madison: 9,736——————–16. Madison: 17,021 17. Indianapolis: 9,190—————-17. Omaha: 14,582 18. Pittsburgh: 7,938—————–18. Wichita: 14,107 19. Providence: 7,871—————–19. Kansas City: 13,753 20. Kansas City: 7,312—————-20. Des Moines: 13,139 21. Lincoln: 6,691———————-21. Pittsburgh: 12,929 22. St. Louis: 6,425——————–22. Lincoln: 11,233 23. Omaha: 6,302 ———————23. Fort Wayne: 10,809 24. Cleveland: 6,213——————-24. Cleveland: 10,351 25. Des Moines: 5,239—————-25. St. Louis: 9,505 26. Cincinnati: 4,326——————26. Akron: 8,391 27. Toledo: 3,847———————-27. Providence: 7,744 28. Grand Rapids: 3,206————–28. Cincinnati: 5,599 29. Akron: 3,099———————–29. Toledo: 3,597 30. Fort Wayne: 2,792—————–30. Grand Rapids: 3,369 31. Dayton: 903————————-31. Dayton: 2,575 32. Youngstown: 338——————32. Canton: 542 33. Canton: 296————————33. Youngstown: 196
Columbus ranks even higher with its foreign-born Asian population.
Total Foreign-born Population from Africa 2000 and 2018 2000—————————————————2018 1. Minneapolis: 12,765——————–1. Columbus: 45,092 2. Chicago: 12,613————————-2. Minneapolis: 26,271 3. Columbus: 9,530———————–3. Chicago: 25,573 4. San Jose: 5,189————————-4. Nashville: 18,423 5. St. Paul: 4,697———————5. Indianapolis: 14,965 6. Nashville: 4,183——————-6. St. Paul: 13,594 7. Detroit:: 3,249———————7. Austin: 9,961 8. Providence: 3,138—————-8. Kansas City: 8,558 9. Indianapolis: 2,650—————9. San Jose: 8,546 10. Portland: 2,430—————–10. Cincinnati: 7,113 11. Austin 2,263———————11. Des Moines: 6,191 12. Kansas City: 2,192————–12. Omaha: 5,474 13. Cincinnati: 1,781—————-13. Grand Rapids: 3,932 14. Jacksonville: 1,719————-14. Portland: 3,899 15. St. Louis: 1,500—————–15. St. Louis: 3,777 16. Omaha: 1,497——————-16. Providence: 3,571 17. Milwaukee: 1,332—————17. Milwaukee: 3,552 18. Cleveland: 1,075—————-18. Jacksonville: 3,426 19. Sacramento: 1,051————-19. Lincoln: 2,942 20. Des Moines: 1,038————-20. Wichita: 2,752 21. Madison: 991——————–21. Madison: 2,599 22. Wichita: 946——————–22. Detroit: 2,081 23. Las Vegas: 916—————–23. Pittsburgh: 1,909 24. Pittsburgh: 905—————-24. Sacramento: 1,784 25. Virginia Beach: 840———–25. Virginia Beach: 1,783 26. Grand Rapids: 718————-26. Fort Wayne: 1,614 27. Toledo: 638——————–27. Dayton: 1,573 28. Lincoln: 637——————–28. Akron: 1,312 29. Dayton: 522——————–29. Las Vegas: 1,206 30. Fort Wayne: 384————–30. Cleveland: 622 31. Akron: 197———————-31. Toledo: 416 32. Canton: 89———————32. Youngstown: 277 33. Youngstown: 50—————33. Canton: 95
Columbus has claimed the number 1 spot in its foreign-born African population, passing previous top city Minneapolis.
And finally, the total foreign-born population from the Americas in 2000 and 2018 2000—————————————————-2018 1. Chicago: 357,235————————–1. Chicago: 277,742 2. San Jose: 117,989————————2. San Jose: 119,455 3. Austin: 73,935———————-3. Austin: 97,933 4. Las Vegas: 63,277——————4. Las Vegas: 83,782 5. Sacramento: 28,927—————5. Jacksonville: 49,339 6. Providence: 27,649—————-6. Sacramento: 42,722 7. Milwaukee: 24,781——————7. Nashville: 39,633 8. Detroit: 21,527———————-8. Indianapolis: 37,287 9. Portland: 20,939——————-9. Providence: 32,650 10. Minneapolis: 19,648————-10. Milwaukee: 31,917 11. Indianapolis: 17,530————–11. Omaha: 26,012 12. Nashville: 17,125——————12. Wichita: 23,429 13. Omaha: 14,467——————–13. Detroit: 23,198 14. Wichita:: 13,988——————14. Columbus: 22,469 15. Grand Rapids: 13,477————15. Portland: 20,407 16. Kansas City: 12,948————–16. Minneapolis: 18,765 17. Jacksonville: 11,881—————17. Kansas City: 18,170 18. St.Paul: 9,804———————18. Virginia Beach: 12,667 19. Columbus: 8,596—————–19. Des Moines: 10,675 20. Des Moines: 6,201—————20. Grand Rapids: 10,395 21. Virginia Beach: 5,754————21. Madison: 9,349 22. Cleveland: 5,192—————–22. St. Paul: 9,070 23. Madison: 5,080——————23. Fort Wayne: 7,831 24. Fort Wayne: 4,930————–24. Lincoln: 6,280 25. Lincoln: 3,106——————–25. Pittsburgh: 5,898 26. St. Louis: 2,961——————-26. Cleveland: 5,810 27. Toledo: 2,942———————27. Cincinnati: 4,901 28. Pittsburgh: 2,463—————-28. Toledo: 4,347 29. Cincinnati: 2,432—————–29. St. Louis: 3,545 30. Dayton: 919———————-30. Dayton: 2,816 31. Akron: 891————————31. Akron: 2,366 32. Canton: 347———————-32. Canton: 2,257 33. Youngstown: 333—————33. Youngstown: 166
Columbus does the worst with this group, but even here it moved up 5 spots in the rankings.
The rest of the foreign-born population is made up of small groups of people from Oceania- or basically island nations.

 [Source: U.S. Census Bureau]