Issue 1 was a contentious, controversial proposal to make it harder for Ohioans to make changes to the state constitution. After a short campaign season, it would go on to defeat by just over 14 points- 57.01% to 42.99%. I provided a state county map with the results on the new Special Issues page. But what were the Issue 1 results in Franklin County and its precincts, specifically?
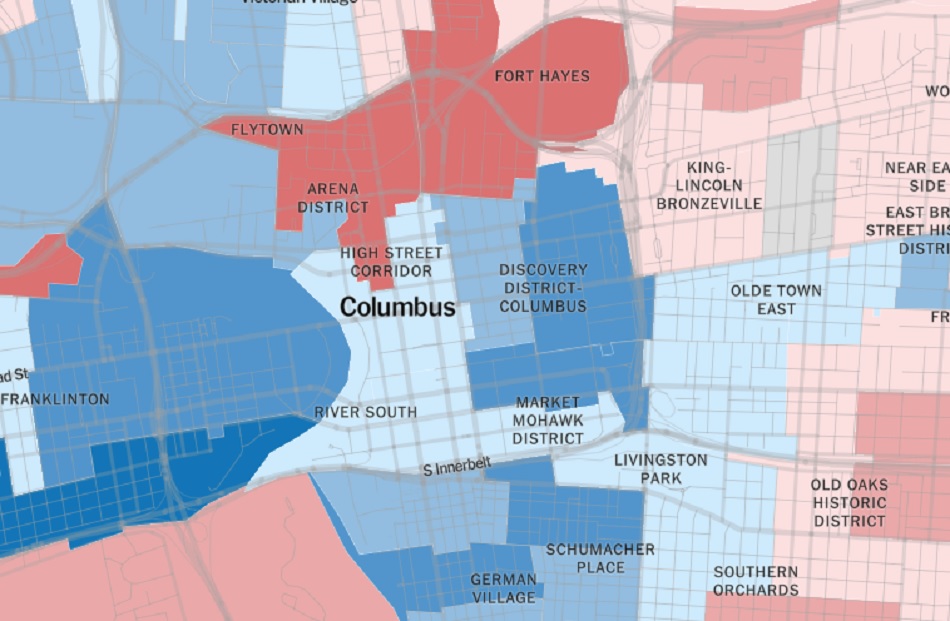
Today’s Cool Link provides the answer with a precinct map of the county. The map shows the results of Issue 1 for every single precinct, ward or city in Franklin County.
Based on the map, here were the overall margins for all the places in the county. Negative numbers are No wins, and positive numbers are Yes wins. 1. Bexley: -74.35 2. Grandview Heights: -71.19 3. Riverlea: -70.04 4. Marble Cliff: -69.02 5. Urbancrest: -64.16 6. Minerva Park: -63.1 7. Worthington: -61.94 8. Columbus: -61.8 9. Clinton Township: -58.32 10. Upper Arlington: -51.55 11. Sharon Township: -50.76 12. Mifflin Township: -46.54 13. Perry Township: -45.32 14. Whitehall: -43.97 15. Gahanna: -42.54 16. New Albany: -42.43 17. Hilliard: -41.09 18. Blendon Township: -39.79 19. Truro Township: -37.93 20. Reynoldsburg: -36.32 21. Jefferson Township: -36.29 22. Westerville: -36.0 23. Dublin: -35.71 24. Norwich Township: -27.9 25. Valleyview: -26.32 26. Canal Winchester: -18.14 27. Madison Township: -17.75 28. Groveport: -16.1 29. Obetz: -14.03 30. Grove City: -13.66 31. Prairie Township: -11.44 32. Plain Township: -9.12 33. Washington Township: -7.5 34. Franklin Township: -6.7 35. Brown Township: -2.58 36. Pleasant Township: +9.2 37. Jackson Township: +13.71 38. Hamilton Township: +15.04 As we can see, almost no part of the county voted Yes except for a few rural townships on the far south side. Not a single suburb voted yes, including in more conservative suburbs like Grove City and Canal Winchester. This suggests there was a lot of bipartisan opposition within the county.
The New York Times has released a national, interactive map of election results by precinct. You can view voting totals and percentages, as well as whether precincts moved further right or left 2016 to 2020.
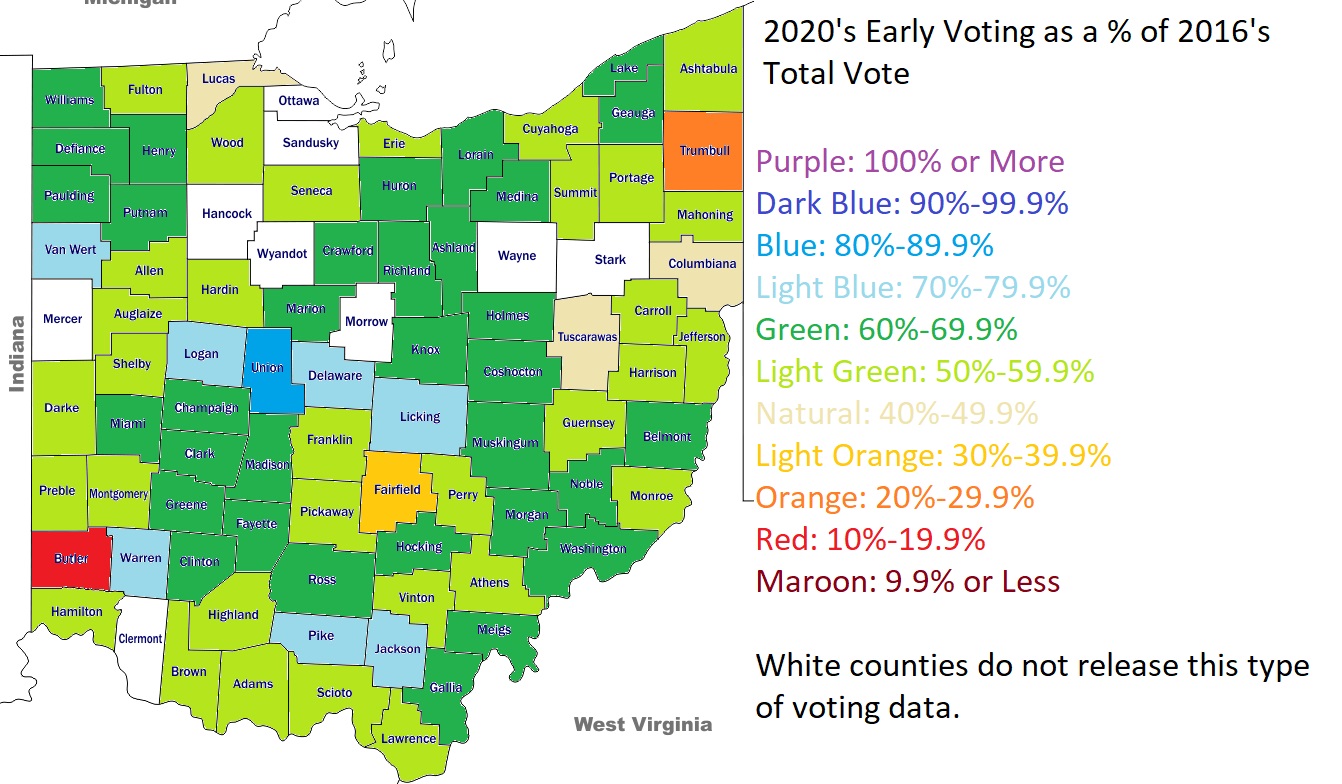
The early voting in Ohio was record-breaking, as it was in many parts of the US. More than 100.5 million people voted early, which includes absentee ballots and in-person voting. In Ohio, 3,411,463 people voted early, far outpacing 2016’s 1,798,277. The 2020 total represents nearly 62% of the ALL votes in 2016, a huge turnout. The state is now expecting full turnout to exceed 75% of registered voters, something that hasn’t happened since 1992’s record 77% turnout. Could this election exceed even that record? It’s certainly possible.
All data provided here is from the Secretary of State.
This post will update daily county voting data, where available, through the election. Numbers in parenthesis are from the previous day, for comparison. There are 8 counties without data, as those county board of elections do not post their statistics online.
**Last Updated: 11/2/2020- 10AM
Total Votes in Ohio Through 11/1: 2,909,171 (2,854,258)
County Average of the Return Rate for 2020 Absentee Ballots: 92.02% (91.09%)
Ohio does not register voters by party, but most counties do release the breakdown of how registered voters voted in previous elections and apply that breakdown to current early voting totals. These numbers are in no way any guarantee of how voters will actually vote in 2020, but they do provide at least some context as to *who* is voting so far. So which party’s past voters are ahead in the counties?
And here is a map of the net change of Democratic and Republican early votes between 2016 and 2020. Again, although we can’t be sure who these people voted for, it does appear that Democrats have made broad gains across most of the state.