Columbus’ Peer Foreign-Born Comparison


The Census just came out with 2015 demographic numbers for all places with at least 65,000 people. Given that half the decade is over, it’s a good point to look at where Columbus stands relative to its national/Midwest peers in a foreign-born comparison. A few days ago, I gave numbers for GDP. In the next few posts, I will look at the people that make up the populations of these places.

First up, let’s take a look at foreign-born populations. I have looked at this topic some in the past, but I have never done a full-scale comparison for this topic.

Total Foreign-Born Population Rank by City 2000, 2010 and 2015
2000—————————————-2010———————————-2015

1. Chicago, IL: 628,903———–1. Chicago: 557,674—————1. Chicago: 573,463
2. San Jose, CA: 329,750——–2. San Jose: 366,194————-2. San Jose: 401,493
3. San Antonio, TX: 133,675—-3. San Antonio: 192,741———-3. San Antonio: 208,046
4. Austin, TX: 109,006————4. Austin: 148,431——————4. Austin: 181,686
5. Las Vegas, NV: 90,656——-5. Las Vegas: 130,503————-5. Charlotte: 128,897
6. Sacramento, CA: 82,616—–6. Chalotte: 106,047—————6. Las Vegas: 127,609
7. Portland, OR: 68,976———7. Sacramento: 96,105————-7. Sacramento: 112,579
8. Charlotte, NC: 59,849——–8. Columbus: 86,663—————-8. Columbus: 101,129
9. Minneapolis, MN: 55,475—–9. Portland: 83,026—————–9. Nashville: 88,193
10. Columbus: 47,713———–10. Indianapolis: 74,407———–10. Portland: 86,041
11. Milwaukee, WI: 46,122—–11. Nashville: 73,327—————11. Indianapolis: 72,456
12. Detroit, MI: 45,541———–12. Minneapolis: 57,846———–12. Minneapolis: 70,769
13. Providence, RI: 43,947—–13. Milwaukee: 57,222————-13. Milwaukee: 58,321
14. Nashville, TN: 38,936——-14. Providence: 52,926————14. Providence: 53,532
15. Indianapolis, IN: 36,067—-15. Orlando: 43,747—————-15. Orlando: 50,558
16. Virginia Beach, VA: 28,276–16. Virginia Beach: 40,756—–16. Omaha: 48,263
17. Orlando, FL: 26,741———17. Omaha: 39,288—————–17. Detroit: 39,861
18. Omaha, NE: 25,687———18. Kansas City: 35,532———18. Virginia Beach: 38,360
19. Kansas City, MO: 25,632—19. Detroit: 34,307—————-19. Kansas City: 37,787
20. Cleveland: 21,372————20. St. Louis: 23,011————–20. Pittsburgh: 28,187
21. Grand Rapids, MI: 20,814–21. Pittsburgh: 18,698————21. St. Louis: 21,802
22. St Louis, MO: 19,542——-22. Cleveland: 17,739————-22. Grand Rapids: 19,176
23. Pittsburgh, PA: 18,874—–23. Grand Rapids: 16,615——–23. Cleveland: 18,830
24. Cincinnati: 12,461———–24. Cincinnati: 16,531————-24. Cincinnati: 16,896
25. Toledo: 9,475—————–25. Toledo: 11,559—————–25. Akron: 10,024
26. Akron: 6,911——————26. Akron: 8,524——————–26. Toledo: 9,257
27. Dayton: 3,245—————-27. Dayton: 5,102——————-27. Dayton: 7,381
28. Youngstown: 1,605———28. Youngstown: 3,695————28. Youngstown: 1,058

Here’s the 2000-2015 total change.
foreign-born comparison

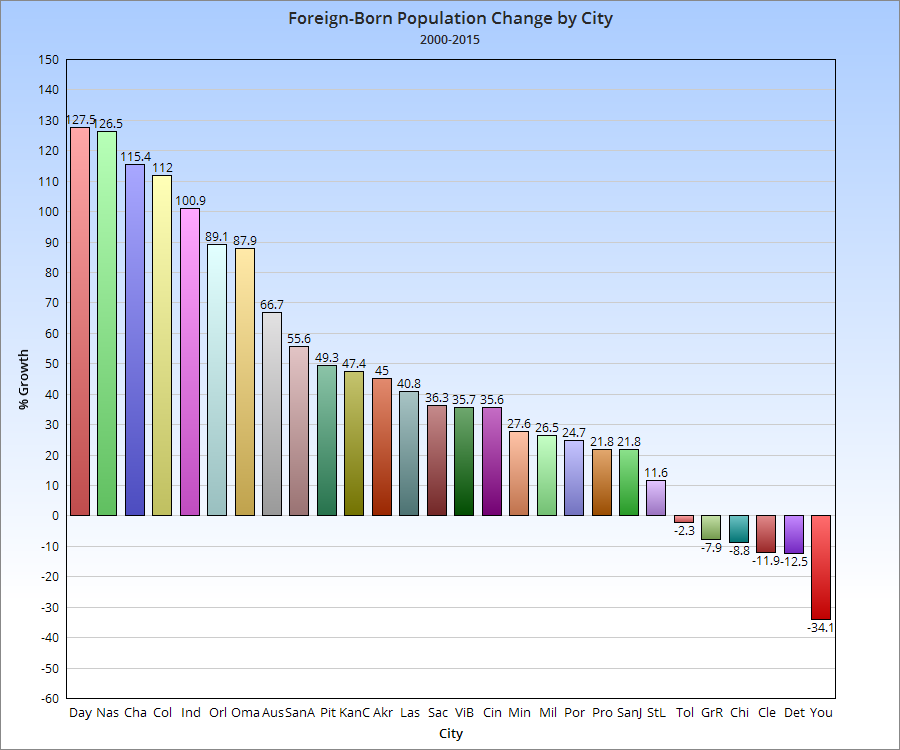
And the 2000-2015 change by %.

So Columbus has an above average total and growth compared to its peers nationally.


Peer and Columbus Metro GDP Comparison


Metro GDP comparison

This metro GDP comparison is based on information from the Bureau of Economic Analysis.

Rank of Major Midwest Metros and Columbus National Peers by GDP, 2001, 2010 and 2015
In Millions
2001——————————————–2010————————————-2015

1. Chicago, IL: $416,444————-1. Chicago: $533,825————–1. Chicago: $640,656
2. Detroit, MI: $190,921———–2. Minneapolis: $199,606——-2. Minneapolis: $248,779
3. Minneapolis, MN: $148,192—–3. Detroit: $197,973—————–3. Detroit: $245,607
4. San Jose, CA: $125,037———4. San Jose: $163,836———–4. San Jose: $235,222
5. St. Louis, MO: $102,385———5. Portland: $141,233————5. Portland: $158,770
6. Pittsburgh, PA: $88,769———-6. St. Louis: $133,888———6. St. Louis: $155,077
7. Cleveland: $87,796————-7. Pittsburgh: $117,895———-7. Charlotte: $152,447
8. Portland, OR: $80,753———8. Charlotte: $114,500————8. Pittsburgh: $138,873
9. Cincinnati: $79,638————-9. Indianapolis: $111,084——-9. Indianapolis: $134,081
10. Kansas City, MO: $79,544—-10. Cleveland: $109,365—–10. Cleveland: $128,448
11. Charlotte, NC $78,675———11. Kansas City: $107,265—11. Cincinnati: $127,057
12. Indianapolis, IN: $78,009——-12. Cincinnati: $104,314—-12. Kansas City: $125,618
13. Columbus: $74,172————-13. Orlando: $101,307——–13. Columbus: $124,381
14. Sacramento, CA: $66,696—–14. Columbus: $96,475——14. Orlando: $121,329
15. Orlando, FL: $66,644———–15. Sacramento: $96,015—-15. Austin: $119,949
16. Milwaukee, WI: $65,033——–16. Austin: $87,473———-16. Sacramento: $118,822
17. Nashville, TN: $58,245———17. Milwaukee: $86,569—–17. Nashville: $113,680
18. Las Vegas, NV: $57,035——-18. Las Vegas: $85,020—–18. San Antonio: $108,879
19. Virginia Beach, VA: $54,040—-19. Nashville: $84,804—19. Las Vegas: $103,343
20. Austin, TX: $53,915——20. Virginia Beach: $82,685—–20. Milwaukee: $102,209
21. San Antonio, TX: $53,248—21. San Antonio: $81,722—21. Virginia Beach: $95,680
22. Providence, RI: $49,997——-22. Providence: $67,754—-22. Providence: $78,694
23. Grand Rapids, MI: $35,248—-23. Omaha: $47,711——-23. Omaha: $59,090
24. Omaha, NE: $32,044——–24. Grand Rapids: $41,221–24. Grand Rapids: $53,949
25. Dayton: $29,658————–25. Dayton: $34,226————25. Dayton: $39,206
26. Toledo: $22,216————–26. Akron: $28,628————–26. Akron: $34,419
27. Akron: $21,684—————27. Toledo: $27,158————-27. Toledo: $34,019
28. Youngstown: $15,314——28. Youngstown: $17,293——28. Youngstown: $21,417

Rank by Total Change in Millions 2001-2015
1. Chicago: +$224,212
2. San Jose: +$110,185
3. Minneapolis: +$100,587
4. Portland: +$78,017
5. Charlotte: +$73,772
6. Austin: +$66,034
7. Indianapolis: +$56,072
8. San Antonio: +$55,631
9. Nashville: +$55,435
10. Detroit: +$54,686
11. Orlando: +$54,685
12. St. Louis: +$52,692
13. Sacramento: +$52,126
14. Columbus: +$50,209
15. Pittsburgh: +$50,104
16. Cincinnati: +$47,419
17. Las Vegas: +$46,308
18. Kansas City: +$46,074
19. Virginia Beach: +$41,640
20. Cleveland: +$40,652
21. Milwaukee: +$37,176
22. Providence: +$28,697
23. Omaha: +$27,046
24. Grand Rapids: +$18,701
25. Akron: +$12,735
26. Toledo: +$11,803
27. Dayton: +$9,548
28. Youngstown: +$6,103

Rank by Total Change in Millions 2010-2015
1. Chicago: +$106,831
2. San Jose: +$71,386
3. Minneapolis: +$49,173
4. Detroit: +$47,634
5. Charlotte: +$37,947
6. Austin: +$32,476
7. Nashville: $28,876
8. Columbus: +$27,906
9. San Antonio: +$27,157
10. Indianapolis +$22,997
11. Sacramento: +$22,807
12. Cincinnati: +$22,743
13. St. Louis: +$21,189
14. Pittsburgh: +$20,978
15. Orlando: +$20,022
16. Cleveland: +$19,083
17. Kansas City: +$18,353
18. Las Vegas: +$18,323
19. Portland: +$17,537
20. Milwaukee: +$15,640
21. Virginia Beach: +$12,995
22. Grand Rapids: +$12,728
23. Omaha: +$11,379
24. Providence: +$10,940
25. Toledo: +$6,861
26. Akron: +$5,791
27. Dayton: +$4,980
28. Youngstown: +$4,124

Total Rank by % Change 2001-2015
1. Austin: +122.48%
2. San Antonio: +104.48%
3. Portland: +96.61%
4. Nashville: +95.18%
5. Charlotte: +93.77%
6. San Jose: +88.12%
7. Omaha: +84.40%
8. Orlando: +82.06%
9. Las Vegas: +81.19%
10. Sacramento: +78.15%
11. Virginia Beach: +77.05%
12. Indianapolis: +71.88%
13. Minneapolis: +67.88%
14. Columbus: +67.69%
15. Cincinnati: +59.54%
16. Akron: +58.73%
17. Kansas City: +57.92%
18. Providence: +57.40%
19. Milwaukee: +57.16%
20. Pittsburgh: +56.44%
21. Chicago: +53.84%
22. Toledo: +53.13%
23. Grand Rapids: +53.06%
24. St. Louis: +51.46%
25. Cleveland: +46.30%
26. Youngstown: +39.85%
27. Dayton: +32.19%
28. Detroit: +28.64%

Total Rank by % Change 2010-2015
1. San Jose: +43.57%
2. Austin: +37.13%
3. Nashville: +34.05%
4. San Antonio: +33.23%
5. Charlotte: +33.14%
6. Grand Rapids: +30.88%
7. Columbus: +28.93%
8. Toledo: +25.26%
9. Minneapolis: +24.64%
10. Detroit: +24.06%
11. Omaha: +23.85%
12. Youngstown: +23.85%
13. Sacramento: +23.75%
14. Cincinnati: +21.80%
15. Las Vegas: +21.55%
16. Indianapolis: +20.70%
17. Akron: +20.23%
18. Chicago: +20.01%
19. Orlando: +19.76%
20. Milwaukee: +18.07%
21. Pittsburgh: +17.79%
22. Cleveland: +17.45%
23. Kansas City: +17.11%
24. Providence: +16.15%
25. St. Louis: +15.83%
26. Virginia Beach: +15.72%
27. Dayton: +14.55%
28. Portland: +12.42%

Finally, let’s take a look at per-capita GDP and income.

Rank of Metros by Per-Capita GDP in Dollars, 2015
1. San Jose: $112,851
2. Minneapolis: $63,474
3. Portland: $62,229
4. Chicago: $59,688
5. Indianapolis: $59,479
6. Milwaukee: $58,219
7. Omaha: $57,334
8. Cleveland: $56,013
9. Nashville: $55,841
10. Charlotte: $55,610
11. Pittsburgh: $55,335
12. Austin: $55,323
13. Columbus: $55,005
14. Kansas City: $54,097
15. Cincinnati: $52,649
16. Detroit: $51,428
17. Virginia Beach: $49,606
18. Toledo: $49,428
19. St. Louis: $49,258
20. Sacramento: $46,697
21. Grand Rapids: $46,677
22. Orlando: $45,756
23. Akron: $44,246
24. Dayton: $43,748
25. Providence: $43,744
26. Las Vegas: $43,476
27. San Antonio: $42,169
28. Youngstown: $34,960

Total Growth 2001-2015 by Rank, in Dollars
1. San Jose: +$40,677
2. Portland: +$18,225
3. Pittsburgh: +$10,064
4. Austin: +$9,925
5. Toledo: +$7,414
6. Virginia Beach: +$7,256
7. Nashville: +$7,071
8. Cleveland: +$6,767
9. Milwaukee: +$6,744
10. Omaha: +$6,581
11. Akron: +$6,167
12. Minneapolis: +$5,900
13. Providence: +$5,560
14. Chicago: +4,663
15. San Antonio: +$4,652
16. Cincinnati: +$4,426
17. Youngstown: +$4,391
18. Sacramento: +$3,210
19. Columbus: +$3,182
20. Indianapolis: +$2,984
21. Grand Rapids: +$2,971
22. Charlotte: +$2,880
23. Kansas City: +$2,770
24. St. Louis: +$2,699
25. Detroit: +$2,011
26. Dayton: +$162
27. Orlando: -$1,630
28. Las Vegas: -$5,041

Total Per-Capita GDP Growth 2010-2015, in Dollars
1. San Jose: +$23,814
2. Toledo: +$6,242
3. Pittsburgh: +$6,172
4. Nashville: +$5,643
5. Detroit: +$5,459
6. Austin: +$5,307
7. Grand Rapids: +$5,158
8. Youngstown: +$4,987
9. San Antonio: +$4,878
10. Columbus: +$4,864
11. Minneapolis: +$4,644
12. Charlotte: +$4,578
13. Chicago: +$4,004
14. Cleveland: +$3,992
15. Cincinnati: +$3,986
16. Akron: +$3,774
17. Milwaukee: +$2,913
18. Omaha: +$2,863
19. Sacramento: +$2,680
20. Providence: +$1,902
21. St. Louis: +$1,884
22. Dayton: +$1,439
23. Kansas City: +$1,270
24. Indianapolis: +$1,186
25. Virginia Beach: +$998
26. Las Vegas: +$206
27. Portland: -$992
28. Orlando: -$1,345

What the numbers suggest is that Columbus was performing at a middle-mediocre level in the first half of the 2001-2015 period, and has generally been performing significantly better in the latter half. In Ohio, Columbus is poised to become Ohio’s largest metro economy over the next few years.


Young Professionals and the City: A Comparison


young professionals

Millennials- those born roughly between 1981 and 2001- are big news these days. They are the largest generation ever in terms of total numbers (exceeding 76 million), and their choices are already having big impacts on everything from housing to the economy. I wanted to look at Columbus and its peers to see where it ranks in terms of attracting these young professionals.

For the comparison, I looked at metro areas of 1.5-2.5 million as well as major Midwest metros and then used their core cities to get the numbers. I used the age group of 25-34 specifically, as that is usually the number most often cited in the news.

Rank of Total Population Aged 25-34
2005_______________________2010___________________2014

1. Chicago: 463,236_______1. Chicago: 510,042_______1. Chicago: 525,381
2. San Antonio: 180,981_____2. San Antonio: 200,645____2. San Antonio: 226,711
3. Austin: 137,523_________3. Austin: 162,247_________3. Austin: 199,838
4. San Jose, CA: 133,144___4. Columbus: 147,584______4. Columbus: 170,759
5. Columbus: 131,641______5. San Jose, CA: 142,551___5. San Jose, CA: 153,690
6. Indianapolis: 114,532_____6. Indianapolis: 133,088____6. Charlotte, NC: 141,869
7. Detroit: 110,759_________7. Charlotte, NC: 127,539___7. Indianapolis: 140,491
8. Charlotte, NC: 100,025____8. Portland, OR: 113,210___8. Portland, OR: 116,109
9. Portland, OR: 90,023_____9. Milwaukee: 97,359______9. Milwaukee: 100,205
10. Las Vegas: 84,418______10. Detroit: 85,023________10. Minneapolis: 90,662
11. Milwaukee: 82,060______11. Minneapolis: 81,532____11. Las Vegas: 90,441
12. Sacramento, CA: 75,497___12. Las Vegas: 81,212____12. Detroit: 89,843
13. Minneapolis: 74,208___13. Sacramento, CA: 78,527__13. Sacramento, CA: 84,013
14. Kansas City, MO: 68,060__14. Kansas City: 73,872__14. Kansas City, MO: 79,262
15. Virginia Beach: 60,749__15. Virginia Beach: 67,614__15. Virginia Beach: 75,543
16. Omaha, NE: 56,248____16. Omaha, NE: 62,396_____16. Omaha, NE: 71,040
17. Wichita, KS: 52,426____17. St. Louis: 57,627_______17. Pittsburgh: 62,473
18. Cleveland: 50,558_____18. Wichita, KS: 56,737_____18. St. Louis: 61,718
19. St. Louis: 48,137______19. Cleveland: 54,428______19. Wichita, KS: 58,334
20. Cincinnati: 44,945_____20. Pittsburgh: 51,109______20. Cleveland: 56,134
21. Toledo: 43,134_______21. St. Paul, MN: 50,107_____21. St. Paul, MN: 54,464
22. Orlando: 40,846______22. Cincinnati: 49,067_______22. Orlando: 54,395
23. St. Paul, MN: 39,676__23. Orlando: 48,102________23. Cincinnati: 54,247
24. Lincoln, NE: 38,893___24. Madison, WI: 44,662_____24. Madison, WI: 44,835
25. Madison, WI: 38,826___25. Lincoln, NE: 42,034_____25. Toledo: 43,661
26. Pittsburgh: 38,744____26. Toledo: 41,580_________26. Lincoln, NE: 40,071
27. Grand Rapids: 35,287__27. Fort Wayne, IN: 35,193__27: Grand Rapids: 38,922
28. Des Moines: 32,640__28. Providence, RI: 31,044__28. Fort Wayne, IN: 37,741
29. Fort Wayne, IN: 31,738__29. Grand Rapids: 30,963__29. Des Moines: 33,857
30. Akron: 30,436_______30. Des Moines: 30,376_____30. Providence, RI: 31,902
31. Providence, RI: 29,307__31. Akron: 27,446________31. Akron: 28,207
32. Dayton: 18,591_______32. Dayton: 20,278________32. Dayton: 21,096
33. Youngstown: 8,505____33. Youngstown: 8,484_____33. Youngstown: 8,468

So Columbus ranks highly among total population in the 25-34 age group. But what about growth?

Total Growth Rank in 25-34 Population 2005-2014
1. Austin, TX: 62,315
2. Chicago: 62,145
3. San Antonio, TX: 45,730
4. Charlotte, NC: 41,844
5. Columbus: 39,118
6. Portland, OR: 26,086
7. Indianapolis: 25,959
8. Pittsburgh: 23,729
9. San Jose, CA: 20,546
10. Milwaukee, WI: 18,145
11. Minneapolis, MN: 16,454
12. Virginia Beach, VA: 14,794
13. St. Paul, MN: 14,788
14. Omaha, NE: 14,612
15. St. Louis, MO: 13,581
16. Orlando, FL: 13,549
17. Kansas City, MO: 11,202
18. Cincinnati: 9,302
19. Sacramento, CA: 8,516
20. Las Vegas, NV: 6,023
21. Madison, WI: 6,009
22. Fort Wayne, IN: 6,003
23. Wichita, KS: 5,908
24. Cleveland: 5,576
25. Grand Rapids, MI: 3,635
26. Providence, RI: 2,595
27. Dayton: 2,505
28. Des Moines, IA: 1,217
29. Lincoln, NE: 1,178
30. Toledo: 527
31. Youngstown: -37
32. Akron: -2,229
33. Detroit: -20,736

Again, Columbus ranks near the top during this period. What about more recently, since 2010?

Total Growth Rank of 25-34 Population 2010-2014
1. Austin: 37,591
2. San Antonio: 26,066
3. Columbus: 23,175
4. Chicago: 15,339
5. Charlotte: 14,330
6. Pittsburgh: 11,364
7. San Jose: 11,139
8. Las Vegas: 9,229
9. Minneapolis: 9,130
10. Omaha: 8,644
11. Grand Rapids: 7,959
12. Virginia Beach: 7,929
13. Indianapolis: 7,403
14. Orlando: 6,293
15. Sacramento: 5,486
16. Kansas City: 5,390
17. Cincinnati: 5,180
18. Detroit: 4,820
19. St. Paul: 4,357
20. St. Louis: 4,091
21. Des Moines: 3,481
22. Portland: 2,899
23. Milwaukee: 2,846
24. Fort Wayne: 2,548
25. Toledo: 2,081
26. Cleveland: 1,706
27. Wichita: 1,597
28. Providence: 858
29. Dayton: 818
30. Akron: 761
31. Madison: 173
32. Youngstown: -16
33. Lincoln: -1,963

So Columbus is doing even better since 2010 than it did in the earlier period and attracts significantly more Millennials in the 25-34 age group than cities often cited for this very metric.

Next, let’s look at percentage growth, as city size can affect this.

Total Percent Growth 2005-2014 in 25-34 Population
1. Pittsburgh: +61.25%
2. Austin: +45.31%
3. Charlotte: +41.83%
4. St. Paul: +37.27%
5. Orlando: +33.17%
6. Columbus: +29.72%
7. Portland: +28.98%
8. St. Louis: +28.21%
9. Omaha: +25.89%
10. San Antonio: +25.27%
11. Virginia Beach: +24.35%
12. Indianapolis: +22.67%
13. Minneapolis: +22.17%
14. Milwaukee: +22.11%
15. Cincinnati: +20.70%
16. Fort Wayne: +18.91%
17. Kansas City: +16.46%
18. Madison: +15.48%
19. San Jose: +15.43%
20. Dayton: +13.47%
21. Chicago: +13.42%
22. Sacramento: +11.28%
23. Wichita: +11.27%
24. Cleveland: +11.03%
25. Grand Rapids: +10.30%
26. Providence: +8.85%
27. Las Vegas: +7.13%
28. Des Moines: +3.73%
29. Lincoln: +3.03%
30. Toledo: +1.22%
31. Youngstown: -0.44%
32. Akron: -7.32%
33. Detroit: -18.75%

So Columbus again performs well in percentage growth, despite having one of the largest populations in the age group. It performs even better in the period since 2010, coming in at 3rd place.

Finally, now that we know the totals and the growth, what is the % of total city population that the 25-34 age group makes up?

25-34 % of Total City Population 2014
1. Minneapolis: 22.27%
2. Austin: 21.89%
3. Orlando: 20.73%
4. Pittsburgh: 20.45%
5. Columbus: 20.42%
6. Grand Rapids: 20.08%
7. St. Louis: 19.44%
8. Chicago: 19.30%
9. Portland: 18.74%
10. St. Paul: 18.30%
11. Madison: 18.25%
12. Cincinnati: 18.19%
13. Providence: 17.81%
14. Charlotte: 17.52%
15. Sacramento: 17.32%
16. Kansas City: 16.84%
17. Virginia Beach: 16.75%
18. Milwaukee: 16.71%
19. Indianapolis: 16.50%
20. Des Moines: 16.19%
21. Omaha: 15.91%
22. San Antonio: 15.78%
23. Toledo: 15.54%
24. San Jose: 15.13%
25. Wichita: 15.02%
26. Dayton: 14.96%
27. Fort Wayne: 14.74%
28. Las Vegas: 14.74%
29. Lincoln: 14.68%
30. Cleveland: 14.41%
31. Akron: 14.26%
32. Detroit: 13.21%
33. Youngstown: 13.02%

And here’s a simple % of population projection for just 4 years from now, 2018, provided the 25-34 population grows the same between 2014-2018 as it did 2010-2014.
1. Pittsburgh: 24.18%
2. Grand Rapids: 23.71%
3. Austin: 23.38%
4. Minneapolis: 23.27%
5. Columbus: 22.16%
6. Orlando: 21.34%
7. St. Louis: 20.82%
8. Cincinnati: 19.85%
9. Chicago: 19.70%
10. St. Paul: 19.05%
11. Providence: 18.20%
12. Portland: 18.14%
13. Virginia Beach: 18.1%
14. Sacramento: 17.84%
15. Charlotte: 17.67%
16. Kansas City: 17.64%
17. Des Moines: 17.50%
18. Madison: 17.40%
19. Milwaukee: 17.07%
20. Indianapolis: 16.85%
21. Omaha: 16.61%
22. Toledo: 16.59%
23. San Antonio: 16.52%
24. Fort Wayne: 15.61%
25. Las Vegas: 15.59%
26. Dayton: 15.27%
27. San Jose: 15.24%
28. Wichita: 15.23%
29. Cleveland: 15.08%
30. Akron: 14.73%
31. Detroit: 14.48%
32. Youngstown: 13.35%
33. Lincoln: 13.13%

Columbus has an existing large population of the 25-34 age demographic, and looks to be one of the strongest performers into the near future.
Some would ask why that would be considering that Columbus transit is woefully lacking and has a reputation (very undeservedly, in my opinion) of being suburban- characteristics that Millennials supposedly almost universally reject. Perhaps the bottom line is that economics trump all other desires. Cost of living and employment tend to be higher up the list than rail lines, and Columbus has both a strong economy and relatively low COL. Whatever the case may be, Columbus seems to be doing something right. Continue this look at this population in Part 2.


Midwest Cities Historic Population and Density


Midwest cities historic population and density

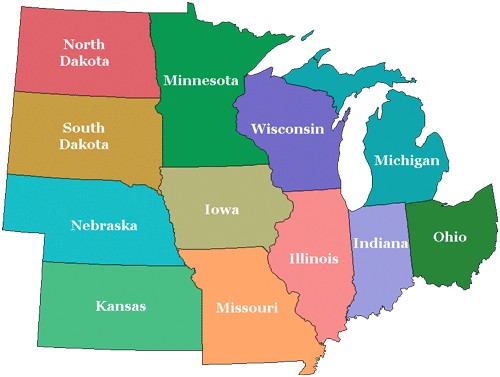
I’ve compared Columbus to peer cities nationally in terms of density and population, but I’ve never made a Midwest cities historic population and density comparison overall. For the following, I used the top 15 largest Midwest cities as of 2014.

Red indicates a fallen ranking while blue indicates a rise. Black is no change.

Historic Population Rankings
1840

1. Cincinnati: 46,338
2. St. Louis: 16,469
3. Detroit: 9,102
4. Cleveland: 6,071
5. Columbus: 6,048
6. Chicago: 4,470
7. Indianapolis: 2,695
8. Milwaukee: 1,700
9. Toledo: 1,222
10. Kansas City: Not incorporated.
11. Lincoln: Not incorporated.
12. Minneapolis: Not incorporated.
13. Omaha: Not incorporated.
14. St. Paul: Not incorporated.
15. Wichita: Not incorporated.

1850
1. Cincinnati: 115,435
2. St. Louis: 77,860
3. Chicago: 29,963
4. Detroit: 21,019
5. Milwaukee: 20,061
6. Columbus: 17,882
7. Cleveland: 17,034
8. Indianapolis: 8,091
9. Toledo: 3,829
10. St. Paul: 1,112
11. Kansas City: Not incorporated.
12. Lincoln: Not incorporated.
13. Minneapolis: Not incorporated.
14. Omaha: Not incorporated.
15. Wichita: Not incorporated.

1860
1. Cincinnati: 161,044
2. St. Louis: 160,773
3. Chicago: 112,172
4. Detroit: 45,619
5. Milwaukee: 45,246
6. Cleveland: 43,417
7. Indianapolis: 18,611
8. Columbus: 18,554
9. Toledo: 13,768
10. St. Paul: 10,401
11. Minneapolis: 5,809
12. Kansas City: 4,418
13. Omaha: 1,883
14. Lincoln: Not incorporated.
15. Wichita: Not incorporated.

1870
1. St. Louis: 310,864
2. Chicago: 298,977
3. Cincinnati: 216,239
4. Cleveland: 92,829
5. Detroit: 79,577
6. Milwaukee: 71,440
7. Indianapolis: 48,244
8. Kansas City: 32,260
9. Toledo: 31,584
10. Columbus: 31,274
11. St. Paul: 20,030
12. Omaha: 16,083
13. Minneapolis: 13,066
14. Lincoln: 2,441
15. Wichita: 689

1880
1. Chicago: 503,185
2. St. Louis: 350,518
3. Cincinnati: 255,139
4. Cleveland: 160,146
5. Detroit: 116,340
6. Milwaukee: 115,587
7. Indianapolis: 75,056
8. Kansas City: 55,785
9. Columbus: 51,647
10. Toledo: 50,137
11. Minneapolis: 46,887
12. St. Paul: 41,473
13. Omaha: 30,518
14. Lincoln: 13,003
15. Wichita: 4,911

1890
1. Chicago: 1,099,850
2. St. Louis: 451,770
3. Cincinnati: 296,908
4. Cleveland: 261,353
5. Detroit: 205,877
6. Milwaukee: 204,468
7. Minneapolis: 164,738
8. Omaha: 140,452
9. St. Paul: 133,156
10. Kansas City: 132,716
11. Indianapolis: 105,436
12. Columbus: 88,150
13. Toledo: 81,434
14. Lincoln: 55,164
15. Wichita: 23,853

1900
1. Chicago: 1,698,575
2. St. Louis: 575,238
3. Cleveland: 381,768
4. Cincinnati: 325,902
5. Detroit: 285,704
6. Milwaukee: 285,315
7. Minneapolis: 202,718
8. Indianapolis: 169,164
9. Kansas City: 163,752
10. St. Paul: 163,065
11. Toledo: 131,822
12. Columbus: 125,560
13. Omaha: 102,555
14. Lincoln: 40,169
15. Wichita: 24,671

1910
1. Chicago: 2,185,283
2. St. Louis: 687,029
3. Cleveland: 560,663
4. Detroit: 465,766
5. Milwaukee: 373,857
6. Cincinnati: 363,591
7. Minneapolis: 301,408
8. Kansas City: 248,381
9. Indianapolis: 233,650
10. St. Paul: 214,744
11. Columbus: 181,511
12. Toledo: 168,497
13. Omaha: 124,096
14. Wichita: 52,450
15. Lincoln: 43,973

1920
1. Chicago: 2,701,705
2. Detroit: 993,678
3. Cleveland: 796,841
4. St. Louis: 772,897
5. Milwaukee: 457,147
6. Cincinnati: 401,247
7. Minneapolis: 380,582
8. Kansas City: 324,410
9. Indianapolis: 314,194
10. Toledo: 243,164
11. Columbus: 237,031
12. St. Paul: 234,698
13. Omaha: 191,061
14. Wichita: 72,217
15. Lincoln: 54,948

1930
1. Chicago: 3,376,438
2. Detroit: 1,568,662
3. Cleveland: 900,429
4. St. Louis: 821,960
5. Milwaukee: 578,249
6. Minneapolis: 464,356
7. Cincinnati: 451,160
8. Kansas City: 399,746
9. Indianapolis: 364,161
10. Toledo: 290,718
11. Columbus: 290,564
12. St. Paul: 271,606
13. Omaha: 214,006
14. Wichita: 111,110
15. Lincoln: 75,933

1940
1. Chicago: 3,396,808
2. Detroit: 1,623,452
3. Cleveland: 878,336
4. St. Louis: 816,048
5. Milwaukee: 587,472
6. Minneapolis: 492,370
7. Cincinnati: 455,610
8. Kansas City: 400,178
9. Indianapolis: 386,972
10. Columbus: 306,087
11. St. Paul: 287,736
12. Toledo: 282,349
13. Omaha: 223,844
14. Wichita: 114,966
15. Lincoln: 81,984

1950
1. Chicago: 3,620,962
2. Detroit: 1,849,568
3. Cleveland: 914,808
4. St. Louis: 856,796
5. Milwaukee: 637,392
6. Minneapolis: 521,718
7. Cincinnati: 503,998
8. Kansas City: 456,622
9. Indianapolis: 427,173
10. Columbus: 375,901
11. St. Paul: 311,349
12. Toledo: 303,616
13. Omaha: 251,117
14. Wichita: 168,279
15. Lincoln: 98,884

1960
1. Chicago: 3,550,404
2. Detroit: 1,670,144
3. Cleveland: 876,050
4. St. Louis: 750,026
5. Milwaukee: 741,324
6. Cincinnati: 502,550
7. Minneapolis: 482,872
8. Indianapolis: 476,258
9. Kansas City: 475,539
10. Columbus: 471,316
11. Toledo: 318,003
12. St. Paul: 313,411
13. Omaha: 301,598
14. Wichita: 254,698
15. Lincoln: 128,521

1970
1. Chicago: 3,366,957
2. Detroit: 1,514,063
3. Cleveland: 750,903
4. Indianapolis: 744,624
5. Milwaukee: 717,099
6. St. Louis: 622,236
7. Columbus: 539,677
8. Kansas City: 507,087
9. Cincinnati: 452,525
10. Minneapolis: 434,400
11. Toledo: 383,818
12. Omaha: 346,929
13. St. Paul: 309,980
14. Wichita: 276,554
15. Lincoln: 149,518

1980
1. Chicago: 3,005,072
2. Detroit: 1,203,368
3. Indianapolis: 700,807
4. Milwaukee: 636,212
5. Cleveland: 573,822
6. Columbus: 564,871
7. St. Louis: 452,801
8. Kansas City: 448,159
9. Cincinnati: 385,460
10. Minneapolis: 370,951
11. Toledo: 354,635
12. Omaha: 313,939
13. Wichita: 279,272
14. St. Paul: 270,230
15. Lincoln: 171,932

1990
1. Chicago: 2,783,726
2. Detroit: 1,027,974
3. Indianapolis: 731,327
4. Columbus: 632,910
5. Milwaukee: 628,088
6. Cleveland: 505,616
7. Kansas City: 435,146
8. St. Louis: 396,685
9. Minneapolis: 368,383
10. Cincinnati: 364,040
11. Omaha: 335,795
12. Toledo: 332,943
13. Wichita: 304,011
14. St. Paul: 272,235
15. Lincoln: 191,972

2000
1. Chicago: 2,896,016
2. Detroit: 951,270
3. Indianapolis: 781,926
4. Columbus: 711,470
5. Milwaukee: 596,974
6. Cleveland: 478,403
7. Kansas City: 441,545
8. Omaha: 390,007
9. Minneapolis: 382,618
10. St. Louis: 348,189
11. Wichita: 344,284
12. Cincinnati: 331,285
13. Toledo: 313,619
14. St. Paul: 287,151
15. Lincoln: 225,581

2010
1. Chicago: 2,695,598
2. Indianapolis: 829,445
3. Columbus: 787,033
4. Detroit: 713,777
5. Milwaukee: 594,833
6. Kansas City: 459,787
7. Omaha: 408,958
8. Cleveland: 396,815
9. Minneapolis: 382,578
10. Wichita: 382,368
11. St. Louis: 319,294
12. Cincinnati: 296,945
13. Toledo: 287,208
14. St. Paul: 285,068
15. Lincoln: 258,379

2014
1. Chicago: 2,722,389
2. Indianapolis: 848,788
3. Columbus: 835,957
4. Detroit: 680,250
5. Milwaukee: 599,642
6. Kansas City: 470,800
7. Omaha: 446,559
8. Minneapolis: 407,207
9. Cleveland: 389,521
10. Wichita: 388,413
11. St. Louis: 317,419
12. Cincinnati: 298,165
13. St. Paul: 297,640
14. Toledo: 281,031
15. Lincoln: 272,996

2020 Projection based on recent estimates.
1. Chicago: 2,736,032
2. Columbus: 905,875
3. Indianapolis: 873,774
4. Detroit: 646,682
5. Milwaukee: 606,730
6. Kansas City: 494,731
7. Omaha: 460,487
8. Minneapolis: 445,321
9. Wichita: 395,751
10. Cleveland: 380,149
11. St. Louis: 308,348
12. St. Paul: 306,448
13. Cincinnati: 302,288
14. Lincoln: 297,136
15. Toledo: 270,837

Columbus seems poised to take the #2 spot from Indianapolis around or just after 2020. Also, 11 of 15 would’ve seen growth 2010-2020. Cleveland, Toledo, St. Louis and Detroit would be the only cities that still lost.

2014 Density
1. Chicago: 11,634.1
2. Minneapolis: 6,972.7
3. Milwaukee: 6,188.3
4. St. Paul: 5,296.1
5. St. Louis: 4,809.4
6. Detroit: 4,760.3
7. Cleveland: 4,721.5
8. Omaha: 3,755.8
9. Columbus: 3,747.0
10. Cincinnati: 3,745.8
11. Lincoln: 3,620.6
12. Toledo: 3,246.1
13. Wichita: 2,374.2
14. Indianapolis: 2,306.5
15. Kansas City: 1,475.9

2020 Projected density using recent estimates.
1. Chicago: 11,692.4
2. Minneapolis: 7,625.4
3. Milwaukee: 6,261.4
4. St. Paul: 5,452.8
5. St. Louis: 4,671.9
6. Cleveland: 4,607.9
7. Detroit: 4,525.4
8. Columbus: 4,060.4
9. Lincoln: 3,940.8
10. Omaha: 3,872.9
11. Cincinnati: 3,797.6
12. Toledo: 3,220.4
13. Wichita: 2,419.0
14. Indianapolis: 2,374.4
15. Kansas City: 1,550.9

The Census is a great source if you are interested in seeing other cities that are not listed above.


Metro Population by Distance from Downtown


Metro population by distance from downtown

One of the more interesting things the Census measures is the population from “City Hall”, or basically the metro population by distance from downtown. The metric measure population at every mile out from the center of each city’s downtown area. Since city boundaries come in all different sizes, this is a good way to compare urban populations.

I looked at the 15 largest Midwest metros for these numbers.

First, here is a breakdown of aggregate population at each mile marker in 2010. Aggregate means that with each mile added, the population within all previous miles are added together.

Mile 0
1. Chicago: 63,120
2. Minneapolis: 31,036
3. Milwaukee: 21,587
4. Cincinnati: 17,681
5. St. Louis: 17,359
6. Grand Rapids: 16,099
7. Omaha: 15,582
8. Indianapolis: 14,058
9. Kansas City: 13,709
10. Akron: 12,479
11. Cleveland: 9,471
12. Dayton: 9,182
13. Detroit: 8,709
14. Toledo: 8,304
15. Columbus: 7,416

This is a pretty bad showing in this list. In 2010, Columbus had the lowest downtown population, or population at Mile 0, of any of the largest 15 Midwest metros.

Mile 1
1. Chicago: 181,714
2. Minneapolis: 123,526
3. Milwaukee: 86,261
4. Grand Rapids: 75,613
5. Cincinnati: 65,264
6. Omaha: 56,244
7. Toledo: 55,739
8. Akron: 53,715
9. Columbus: 49,667
10. Indianapolis: 45,079
11. Dayton: 41,053
12. St. Louis: 40,184
13. Kansas City: 32,900
14. Detroit: 32,810
15. Cleveland: 32,193

By Mile 1, Columbus starts to move up rapidly, however.

Mile 2
1. Chicago: 318,522
2. Minneapolis: 228,927
3. Milwaukee: 208,776
4. Cincinnati: 138,235
5. Columbus: 134,826
6. Grand Rapids: 127,535
7. Akron: 122,395
8. Omaha: 113,044
9. Indianapolis: 102,412
10. Dayton: 101,817
11. Toledo: 94,058
12. St. Louis: 94,038
13. Kansas City: 77,388
14. Cleveland: 64,721
15. Detroit: 64,046

Mile 3
1. Chicago: 508,949
2. Minneapolis: 325,198
3. Milwaukee: 319,111
4. Columbus: 221,466
5. Cincinnati: 205,624
6. Grand Rapids: 184,887
7. Akron: 177,674
8. Omaha: 168,724
9. Toledo: 166,569
10. Indianapolis: 166,266
11. St. Louis: 160,117
12. Kansas City: 155,802
13. Dayton: 152,789
14. Cleveland: 139,945
15. Detroit: 109,104

Mile 4
1. Chicago: 764,400
2. Minneapolis: 448,499
3. Milwaukee: 438,629
4. Cincinnati: 315,665
5. Columbus: 314,557
6. Omaha: 253,723
7. St. Louis: 251,432
8. Grand Rapids: 247,473
9. Indianapolis: 240,970
10. Akron: 227,825
11. Cleveland: 227,309
12. Kansas City: 216,483
13. Dayton: 214,614
14. Toledo: 213,529
15. Detroit: 198,341

Mile 5
1. Chicago: 1,067,434
2. Minneapolis: 585,588
3. Milwaukee: 552,064
4. Columbus: 404,642
5. Cincinnati: 400,254
6. Cleveland: 361,475
7. St. Louis: 336,573
8. Indianapolis: 320,919
9. Omaha: 311,189
10. Grand Rapids: 305,307
11. Akron: 296,787
12. Detroit: 282,986
13. Toledo: 271,187
14. Kansas City: 269,936
15. Dayton: 262,069

So while Columbus’ downtown is down at the bottom in this list to start, it ends up being a top 5 within just a few miles. Clearly, though, the city needs to do better at getting people in the center.

What about further out? Let’s keep going.

Mile 10
1. Chicago: 2,763,025
2. Minneapolis: 1,312,640
3. Detroit: 1,053,920
4. Columbus: 993,957
5. Milwaukee: 944,415
6. Cleveland: 918,511
7. Indianapolis: 871,050
8. St. Louis: 864,336
9. Cincinnati: 862,932
10. Kansas City: 797,442
11. Omaha: 588,484
12. Dayton: 586,178
13. Akron: 502,710
14. Grand Rapids: 482,599
15. Toledo: 454,859

Mile 20
1. Chicago: 4,738,903
2. Detroit: 2,663,489
3. Minneapolis: 2,542,565
4. St. Louis: 1,878,365
5. Kansas City: 1,618,823
6. Cincinnati: 1,592,905
7. Cleveland: 1,549,799
8. Indianapolis: 1,511,675
9. Columbus: 1,432,067
10. Milwaukee: 1,317,062
11. Omaha: 788,498
12. Dayton: 757,623
13. Akron: 673,654
14. Grand Rapids: 602,220
15. Toledo: 558,219

Columbus seems to hold its own from Mile 2 through about Mile 15 or 16, and then begins to fall back as full metro populations begin to take shape.

So now we know the exact populations by distance, but what about how those are changing over time? Here are the same miles and their total change from 2000 to 2010.

Aggregate Change 2000-2010
By Mile 1

1. Chicago: 48,288
2. Minneapolis: 7,969
3. St. Louis: 5,881
4. Cleveland: 3,174
5. Milwaukee: 2,250
6. Kansas City: 1,009
7. Omaha: -53
8. Columbus: -1,049
9. Detroit: -3,601
10. Indianapolis: -4,739
11. Grand Rapids: -5,236
12. Cincinnati: -6,112
13. Akron: -8,916
14. Toledo: -10,118
15. Dayton: -10,165

By Mile 2
1. Chicago: 31,824
2. Minneapolis: 3,462
3. Omaha: 408
4. St. Louis: -1,523
5. Milwaukee: -2,399
6. Cleveland: -3,388
7. Kansas City: -4,807
8. Columbus: -6,004
9. Grand Rapids: -9,279
10. Detroit: -11,019
11. Indianapolis: -15,532
12. Cincinnati: -15,749
13. Akron: -15,874
14. Toledo: -16,771
15. Dayton: -20,826

By Mile 3
1. Chicago: 13,414
2. Minneapolis: 257
3. Omaha: -28
4. Milwaukee: -4,550
5. Columbus: -8,509
6. Grand Rapids: -8,818
7. St. Louis: -12,153
8. Kansas City: -14,528
9. Akron: -18,107
10. Toledo: -21,469
11. Cleveland: -23,287
12. Indianapolis: -23,973
13. Cincinnati: -24,548
14. Dayton: -27,652
15. Detroit: -29,905

By Mile 4
1. Minneapolis: 2,381
2. Omaha: 1,376
3. Milwaukee: -4,943
4. Grand Rapids: -8,612
5. Columbus: -9,650
6. Chicago: -12,130
7. Kansas City: -17,813
8. Akron: -18,533
9. Toledo: -22,039
10. St. Louis: -22,415
11. Indianapolis: -27,912
12. Dayton: -31,173
13. Cincinnati: -32,342
14. Cleveland: -41,948
15. Detroit: -61,209

By Mile 5
1. Omaha: 1,800
2. Minneapolis: 1,798
3. Milwaukee: -4,090
4. Columbus: -7,924
5. Grand Rapids: -8,112
6. Akron: -19,405
7. Kansas City: -21,986
8. Toledo: -26,094
9. Indianapolis: -28,401
10. Dayton: -33,066
11. St. Louis: 35,038
12. Cincinnati: -38,698
13. Chicago: -48,898
14. Cleveland: -70,067
15. Detroit: -89,973

By Mile 10
1. Columbus: 59,873
2. Indianapolis: 37,721
3. Omaha: 25,330
4. Grand Rapids: 10,284
5. Minneapolis: -1,544
6. Milwaukee: -2,369
7. Akron: -6,207
8. Dayton: -17,223
9. Kansas City: -19,048
10. Toledo: -21,636
11. Cincinnati: -39,767
12. St. Louis: -58,549
13. Cleveland: -120,862
14. Chicago: -172,571
15. Detroit: -239,616

By Mile 20
1. Indianapolis: 213,270
2. Columbus: 183,014
3. Kansas City: 144,634
4. Minneapolis: 141,652
5. Omaha: 97,813
6. Cincinnati: 46,813
7. Milwaukee: 27,876
8. Grand Rapids: 24,505
9. Akron: 8,625
10. Dayton: -7,484
11. Toledo: -9,112
12. St. Louis: -21,917
13. Cleveland: -88,522
14. Chicago: -215,802
15. Detroit: -291,258

Metro Area Demographics provides a greater picture of the Columbus metro’s population and demographic data.