Cool Link- Issue 1 Results in Franklin County

Issue 1 Results

Issue 1 was a contentious, controversial proposal to make it harder for Ohioans to make changes to the state constitution. After a short campaign season, it would go on to defeat by just over 14 points- 57.01% to 42.99%. I provided a state county map with the results on the new Special Issues page. But what were the Issue 1 results in Franklin County and its precincts, specifically?

Today’s Cool Link provides the answer with a precinct map of the county. The map shows the results of Issue 1 for every single precinct, ward or city in Franklin County.

Based on the map, here were the overall margins for all the places in the county. Negative numbers are No wins, and positive numbers are Yes wins.
1. Bexley: -74.35
2. Grandview Heights: -71.19
3. Riverlea: -70.04
4. Marble Cliff: -69.02
5. Urbancrest: -64.16
6. Minerva Park: -63.1
7. Worthington: -61.94
8. Columbus: -61.8
9. Clinton Township: -58.32
10. Upper Arlington: -51.55
11. Sharon Township: -50.76
12. Mifflin Township: -46.54
13. Perry Township: -45.32
14. Whitehall: -43.97
15. Gahanna: -42.54
16. New Albany: -42.43
17. Hilliard: -41.09
18. Blendon Township: -39.79
19. Truro Township: -37.93
20. Reynoldsburg: -36.32
21. Jefferson Township: -36.29
22. Westerville: -36.0
23. Dublin: -35.71
24. Norwich Township: -27.9
25. Valleyview: -26.32
26. Canal Winchester: -18.14
27. Madison Township: -17.75
28. Groveport: -16.1
29. Obetz: -14.03
30. Grove City: -13.66
31. Prairie Township: -11.44
32. Plain Township: -9.12
33. Washington Township: -7.5
34. Franklin Township: -6.7
35. Brown Township: -2.58
36. Pleasant Township: +9.2
37. Jackson Township: +13.71
38. Hamilton Township: +15.04
As we can see, almost no part of the county voted Yes except for a few rural townships on the far south side. Not a single suburb voted yes, including in more conservative suburbs like Grove City and Canal Winchester. This suggests there was a lot of bipartisan opposition within the county.


How We Should Develop Around Intel


how we should develop around Intel Columbus, Ohio

Intel’s big project northeast of New Albany is now well-known. People are both excited and cynical about all the potential impacts that will come with it. But what is not discussed nearly as much- and is arguably just as important long-term- is what happens to all the land around it.
Rumors are already flying about developers scrambling to snatch up as much land as they can for housing, and that is no doubt true. The land is largely a blank slate, so what happens to it from this point is entirely up to the cities, towns and townships that the land sits within. Without a coordinated effort and plan, the area will almost certainly become a nightmarish cluster**** of low-density sprawl and endless traffic, which would be to the detriment of all.

So what can be done? How we should develop around Intel is not really the open question some might think. The answer, it seems, is pretty obvious once you get into the details of what types of development provide the most economic and social benefits.

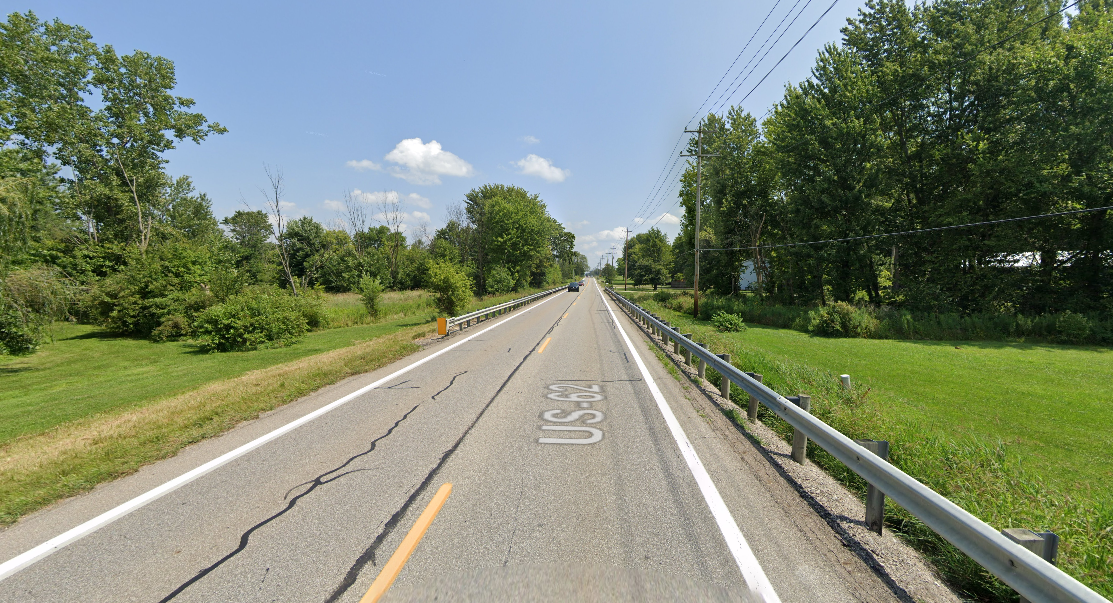
The Area Today
The main Intel site is bounded by Green Chapel Road, Mink Street, Miller Road and Clover Valley Road, encompassing about 1,000 acres, but a larger expansion area is about 3x that size, as shown by the map below.
This area is largely rural and almost entirely made up of farms. There is very little organized development between New Albany and Johnstown, which this site sits between. 2-lane Rt. 62, otherwise known as Johnstown-Utica Road, is the main connection between the two and runs just north of the Intel site.

How we should develop around Intel

How Rt. 62 looks today.

How we should develop around Intel

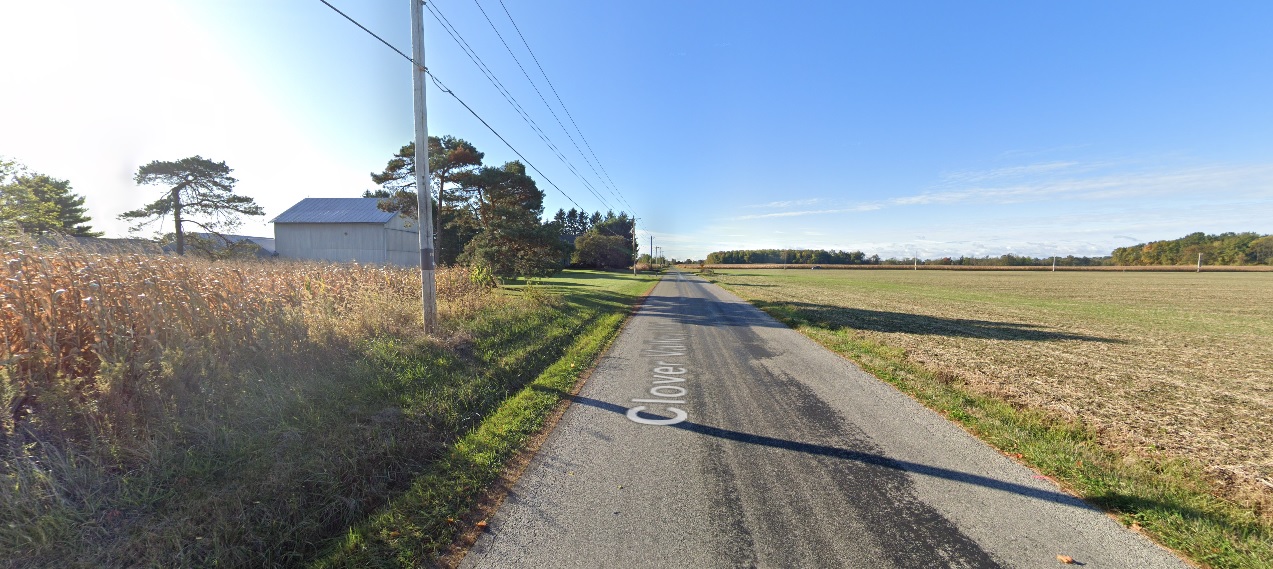
Clover Valley Road adjacent to the Intel site.

Planned/Ongoing Infrastructure Changes
2022-2023
-Jug Street between Beech Road and Clover Valley Road is being widened to 3 lanes.
-Jug Street between Clover Valley Road and Mink Street will be widened, but still be 2 lanes.
-Green Chapel Road between Rt. 62 and Clover Valley Road will be widened to 3 lanes.
-Green Chapel Road between Clover Valley Road and Mink Street will be widened to 5 lanes.
-Mink Street between 161 and Green Chapel Road will be widened to 5 lanes.
2024-2025
-Harrison Road between Clover Valley Road and Mink Street will be widened to 3 lanes and will be extended between Clover Valley Road and Jug Street.
-Clover Valley Road will be widened to 3 lanes between Jug Street and Green Chapel Road.
-Beech Road between Innovation Corridor Way and Jug Street will be widened to 5 lanes.
-Beech Road between Jug Street and Rt. 62 will be widened to 3 lanes.
-Miller Road between Beech Road and Clover Valley Road will be widened to 3 lanes.

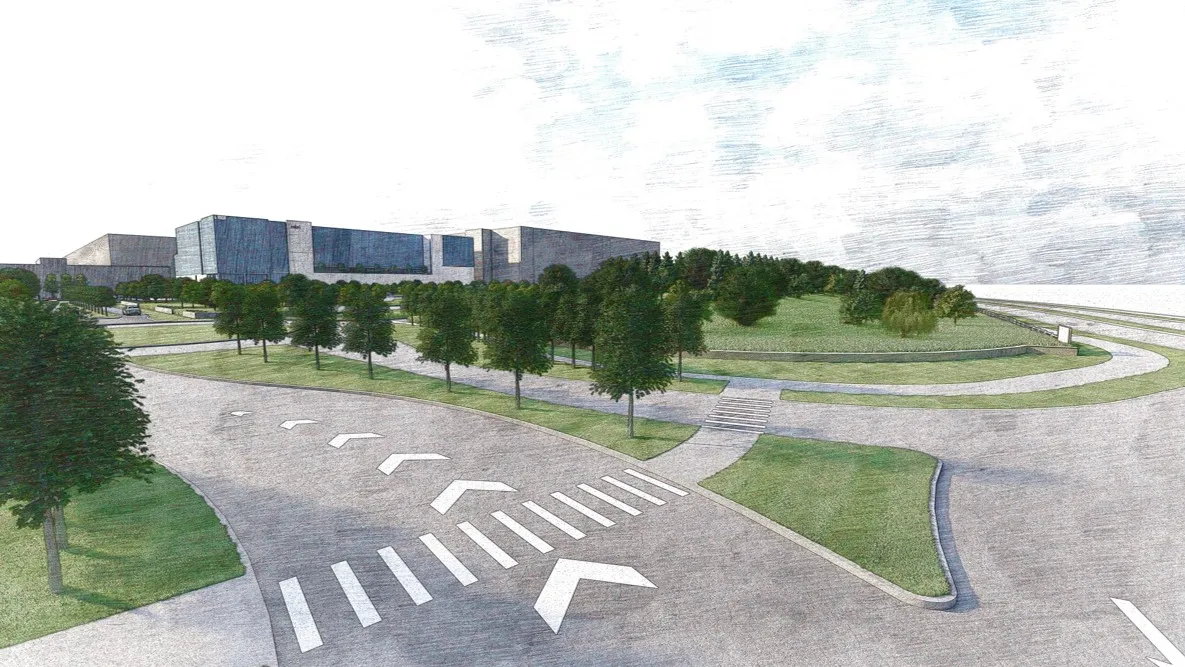
Beyond these road changes, little of anything else is planned. Where Intel has made a presence in other communities in other states, unregulated sprawl seemed to be what mainly happened, but that doesn’t have to happen here. Here is a general outline of what could be.

Map Highlights
-Rt. 62 becomes a mixed-use commercial, retail, restaurant and residential corridor along a tree-line boulevard capable of handling either bike or transit lanes (or both). Several other roads around the area also become boulevards. A “town center” of sorts could be created at the 4-way intersection in red, with mixed-use corridors in all 4 directions. South of 62, medium to high-density residential on a street grid would be the best use, while north of 62 would be more of a mixed-density residential development on a street grid. In both cases, the residential areas would be dotted with parks and playgrounds, corner shops, cafes and other amenities.
The Intel site and surrounding area itself is already basically spoken for, with several areas of planned expansion, while further to the south, New Albany’s business park could see gradual expansion as well.

Now, none of this is more than a thought experiment. There is likely to be heavy NIMBY opposition by locals to any major development, let alone what would be considered a more urban and dense style. However, development is going to happen with or without local approval. The demand will be incredible and far too strong for it to be killed off entirely. All that opposition is likely to accomplish is to create all of the problems they think they’re trying to prevent. There are reasons to go with density and grids over not. Here are just a few of the advantages of a street-grid-based higher density plan:

1. Higher land values. Gridded street layouts tend to haver higher land values than sprawl.
2. Taxes. Gridded streets allow for the creation of higher densities, and as mentioned, higher land values. Cities and towns therefore get a much greater tax return than they would with sprawl.
3. Lower traffic. Gridded streets allow more connectivity between one street and another, and therefore provide more routes to choose from when attempting to avoid traffic. This allows for more traffic dispersal across the board.
4. Lower infrastructure costs. Higher densities allow infrastructure costs to be divided among a greater population, creating a lower general financial burden for residents, as well as local and state entities.
5. More adaptability. It is much easier and cheaper to rebuild along gridded streets than it is the winding streets in the average sprawled neighborhood. The infrastructure doesn’t need to be rebuilt to change development patterns. So low-density housing can be built on a grid initially and then gradually replaced with higher density residential or mixed-use depending on demand.
6. Better transit access. It is very difficult to build transit systems within a sprawled area. Winding roads prevent higher travel speeds for transit, making them inefficient and slow. These systems are also rarely, if ever, built during the initial creation of sprawled neighborhoods. Sprawl is not very adaptable to adding them later if the population density becomes significant enough in the future to support them.
7. Safer for pedestrians. Because gridded streets do such a better job at traffic dispersal, they can be narrower than say, your typical American stroad. As such, narrower streets tend to slow down traffic, lowering the risk of harm to pedestrians and bikers.

So the benefits are pretty clear, but will anyone see them? Johnstown’s government is currently a hot mess, New Albany- which at least has a bit of a track record in planning- doesn’t own any of the land, and neither have hinted whatsoever that they’d even be interested in coming up with a plan. Few, if any, of the developers buying up property have any sort of track record outside of sprawl.
Enormous changes are coming for this area, and for Central Ohio as a whole. It’s going to take forward-thinking leadership to step up- and soon- before it’s too late.


2017 County Population Estimates


2017 county population estimates

Early this morning, the Census released the most recent population figures for counties, Metropolitan Statistical Areas and Consolidated Statistical Areas. The 2017 county population estimates, among others, cover the year from July 1, 2016 to July 1, 2017.


Here are Ohio’s 88 counties and their population Census 2010, July 1, 2016 and July 1, 2017.

Census 2010——————————July 1, 2016————————-July 1, 2017
1. Cuyahoga: 1,280,122———–1. Franklin: 1,269,998———–1. Franklin: 1,291,981
2. Franklin: 1,163,414————2. Cuyahoga: 1,253,454——–2. Cuyahoga: 1,248,514
3. Hamilton: 802,374 ————–3. Hamilton: 810,087————-3. Hamilton: 813,822
4. Summit: 541,781—————-4. Summit: 540,394—————4. Summit: 541,228
5. Montgomery: 535,153——5. Montgomery: 531,395——–5. Montgomery: 530,604
6. Lucas: 441,815——————6. Lucas: 432,562—————–6. Lucas 430,887
7. Stark: 375,586——————-7. Butler: 377,933——————7. Butler: 380,604
8. Butler: 368,130——————8. Stark: 373,528——————8. Stark: 372,542
9. Lorain: 301,356—————–9. Lorain: 306,590——————9. Lorain: 307,924
10. Mahoning: 238,823———10. Mahoning: 230,169————10. Lake: 230,117
11. Lake: 230,041—————–11. Lake: 229,270——————11. Mahoning: 229,796
12. Warren: 212,693————-12. Warren: 226,476—————12. Warren: 228,882
13. Trumbull: 210,312———–13. Clermont: 203,016————13. Clermont: 204,214
14. Clermont: 197,363———–14. Trumbull: 201,701————-14. Delaware: 200,464
15. Delaware: 174,214———–15. Delaware: 196,777————15. Trumbull: 200,380
16. Medina: 172,332————-16. Medina: 176,903—————16. Medina: 178,371
17. Licking: 166,492————–17. Licking: 171,822—————17. Licking: 173,448
18. Greene: 161,573————–18. Greene: 165,109—————-18. Greene: 166,752
19. Portage: 161,419————-19. Portage: 162,162—————19. Portage: 162,277
20. Fairfield: 146,156————20. Fairfield: 152,681—————-20. Fairfield: 154,733
21. Clark: 138,333—————–21. Clark: 134,621——————–21. Clark: 134,557
22. Wood: 125,488—————22. Wood: 129,704——————-22. Wood: 130,492
23. Richland: 124,475————23. Richland: 121,167—————-23. Richland: 120,589
24. Wayne: 114,520————–24. Wayne: 116,422——————24. Wayne: 116,038
25. Columbiana: 107,841——-25. Miami: 104,382——————–25. Miami: 105,122
26. Allen: 106,331—————-26. Columbiana: 103,744————26. Allen: 103,198
27. Miami: 102,506————–27. Allen: 103,626——————27. Columbiana: 103,077
28. Ashtabula: 101,497———28. Ashtabula: 98,169————–28. Ashtabula: 97,807
29. Geauga: 93,389————-29. Geauga: 93,848—————–29. Geauga: 93,918
30. Tuscarawas: 92,582——–30. Tuscarawas: 92,485————30. Tuscarawas: 92,297
31. Muskingum: 86,074———31. Muskingum: 85,929————-31. Muskingum: 86,149
32. Scioto: 79,499—————-32. Ross: 76,910———————32. Ross: 77,313
33. Ross: 78,064—————–33. Scioto: 76,240——————–33. Scioto: 75,929
34. Erie: 77,079——————34. Hancock: 75,590—————–34. Hancock: 75,754
35. Hancock: 74,782————35. Erie: 74,944———————–35. Erie: 74,817
36. Belmont: 70,400————-36. Belmont: 68,568—————–36. Belmont: 68,029
37. Jefferson: 69,709————37. Jefferson: 66,914—————37. Athens: 66,597
38. Marion: 66,501—————38. Athens: 66,320——————38. Jefferson: 66,359
39. Athens: 64,757—————39. Marion: 65,334——————39. Marion: 64,967
40. Lawrence: 62,450———–40. Knox: 60,832———————40. Knox: 61,261
41. Washington: 61,778———41. Lawrence: 60,729————–41. Washington: 60,418
42. Sandusky: 60,944————42. Washington: 60,535———–42. Lawrence: 60,249
43. Knox: 60,921——————43. Sandusky: 59,281————–43. Sandusky: 59,195
44. Huron: 59,626—————–44. Huron: 58,391——————-44. Huron: 58,494
45. Seneca: 56,745—————45. Pickaway: 57,530—————45. Pickaway: 57,830
46. Pickaway: 55,698————-46. Union: 55,456——————-46. Union: 56,741
47. Ashland: 53,139—————47. Seneca: 55,357—————–47. Seneca: 55,243
48. Darke: 53,139—————–48. Ashland: 53,417—————–48. Ashland: 53,628
49. Union: 52,300——————49. Darke: 51,636——————-49. Darke: 51,536
50. Shelby: 49,423—————–50. Shelby: 48,726—————–50. Shelby: 48,759
51. Auglaize: 45,949————–51. Auglaize: 45,797—————-51. Auglaize: 45,778
52. Logan: 45,858—————–52. Logan: 45,171——————-52. Logan: 45,325
53. Brown: 44,846—————–53. Holmes: 43,832—————–53. Madison: 44,036
54. Crawford: 43,784————-54. Brown: 43,644——————-54. Holmes: 43,957
55. Highland: 43,589————-55. Madison: 43,354—————–55. Brown: 43,576
56. Madison: 43,435————-56. Highland: 42,993—————–56. Highland: 42,971
57. Fulton: 42,698—————-57. Fulton: 42,325——————–57. Fulton: 42,289
58. Holmes: 42,366————–58. Crawford: 42,037—————–58. Clinton: 42,009
59. Preble: 42,270—————-59. Clinton: 41,881——————-59. Crawford: 41,746
60. Clinton: 42,040—————60. Preble: 41,105——————–60. Preble: 41,120
61. Ottawa: 41,428—————61. Mercer: 40,710——————-61. Mercer: 40,873
62. Mercer: 40,814—————62. Ottawa: 40,495——————-62. Ottawa: 40,657
63. Champaign: 40,097———63. Guernsey: 39,200—————63. Guernsey: 39,093
64. Guernsey: 40,087———–64. Champaign: 38,737————-64. Champaign: 38,840
65. Defiance: 39,037————65. Defiance: 38,121—————–65. Defiance: 38,156
66. Williams: 37,642————66. Williams: 36,921——————66. Williams: 36,784
67. Coshocton: 36,901———-67. Coshocton: 36,644————-67. Coshocton: 36,544
68. Perry: 36,058—————–68. Perry: 36,019——————–68. Perry: 36,024
69. Morrow: 34,827————–69. Morrow: 34,827——————69. Morrow: 34,994
70. Putnam: 34,499————–70. Putnam: 34,016—————–70. Putnam: 33,878
71. Jackson: 33,225————-71. Jackson: 32,534—————–71. Jackson: 32,449
72. Hardin: 32,058—————72. Hardin: 31,407——————-72. Hardin: 31,364
73. Gallia: 30,934—————-73. Gallia: 29,996———————73. Gallia: 29,973
74. Hocking: 29,380————-74. Fayette: 28,662——————74. Fayette: 28,752
75. Fayette: 29,030————–75. Hocking: 28,386—————–75. Hocking: 28,474
76. Carroll: 28,836—————76. Pike: 28,237———————–76. Pike: 28,270
77. Van Wert: 28,744————77. Van Wert: 28,166—————-77. Van Wert: 28,217
78. Pike: 28,709——————-78. Adams: 27,832——————-78. Adams: 27,726
79. Adams: 28,550—————79. Carroll: 27,637——————–79. Carroll: 27,385
80. Henry: 28,215—————-80. Henry: 27,269———————80. Henry: 27,185
81. Meigs: 23,770—————-81. Meigs: 23,177———————81. Meigs: 23,080
82. Wyandot: 22,615————-82. Wyandot: 22,042—————-82. Wyandot: 22,029
83. Paulding: 19,614————83. Paulding: 18,839——————83. Paulding: 18,845
84. Harrison: 15,864————-84. Harrison: 15,257——————84. Harrison: 15,216
85. Morgan: 15,054————–85. Morgan: 14,762——————-85. Morgan: 14,709
86. Noble: 14,645—————–86. Noble: 14,443———————86. Noble: 14,406
87. Monroe: 14,642————–87. Monroe: 14,097——————–87. Monroe: 13,946
88. Vinton: 13,435—————-88. Vinton: 13,021———————88. Vinton: 13,092

Columbus’ counties tended to move up in the rankings 2010-2017.


Let’s now take a look at total growth for the periods July 1, 2016-July 1, 2017 and Census 2010 to July 1, 2017.
Census 2010-July 1, 2017————————-July 1, 2016-July 1, 2017

1. Franklin: +128,452—————————–1. Franklin: +21,983
2. Delaware: +26,275—————————–2. Hamilton: +3,735
3. Warren: +16,049——————————–3. Delaware: +3,687
4. Butler: +12,474———————————-4. Butler: +2,671
5. Hamilton: +11,435——————————5. Warren: +2,406
6. Fairfield: +8,556——————————–6. Fairfield: +2,052
7. Licking: +6,956———————————7. Greene: +1,643
8. Clermont: +6,862——————————-8. Licking: +1,626
9. Lorain: +6,555———————————–9. Medina: +1,468
10. Medina: +6,038——————————-10. Lorain: +1,334
11. Greene: +5,178——————————-11. Union: +1,285
12. Wood: +5,003———————————12. Clermont: +1,198
13. Union: +4,482———————————13. Lake: +847
14. Miami: +2,621———————————14. Summit: +834
15. Pickaway: +2,152—————————–15. Wood: +788
16. Athens: +1,833——————————–16. Miami: +740
17. Holmes: +1,593——————————–17. Madison: +682
18. Wayne: +1,522———————————18. Knox: +429
19. Hancock: +965———————————19. Ross: +403
20. Portage: +856———————————-20. Pickaway: +300
21. Madison: +598———————————21. Athens: +277
22. Geauga: +508———————————-22. Muskingum: +220
23. Ashland: +489———————————23. Ashland: +211
24. Knox: +331————————————-24. Hancock: +164
25. Morrow: +167———————————25. Mercer: +163
26. Lake: +67————————————–26. Ottawa: +162
27. Muskingum: +63—————————–27. Logan: +154
28. Mercer: +59———————————-28. Montgomery: +147
29. Perry: -15————————————-29. Clinton: +128
30. Clinton: -28———————————–30. Holmes: +125
31. Auglaize: -171——————————-31. Portage: +115
32. Noble: -239———————————–32. Champaign: +103
33. Fayette: -273——————————–33. Huron: +103
34. Tuscarawas: -285————————–34. Fayette: +90
35. Vinton: -338———————————35. Hocking: +88
36. Morgan: -347——————————-36. Vinton: +71
37. Coshocton: -354—————————37. Geauga: +70
38. Fulton: -409———————————38. Van Wert: +51
39. Pike: -432———————————–39. Morrow: +40
40. Van Wert: -526—————————-40. Defiance: +35
41. Logan: -529———————————41. Pike: +33
42. Summit: -554——————————-42. Shelby: +33
43. Wyandot: -586——————————43. Preble: +15
44. Putnam: -618——————————-44. Paulding: +6
45. Highland: -629—————————–45. Perry: +5
46. Harrison: -646——————————46. Wyandot: -13
47. Shelby: -659——————————–47. Auglaize: -19
48. Meigs: -687———————————48. Highland: -22
49. Hardin: -696——————————–49. Gallia: -23
50. Monroe: -696——————————-50. Fulton: -36
51. Ross: -752———————————-51. Noble: -37
52. Paulding: -770——————————52. Harrison: -41
53. Jackson: -777——————————53. Hardin: -43
54. Ottawa: -777——————————-54. Morgan: -53
55. Adams: -826——————————-55. Clark: -64
56. Williams: -864—————————–56. Brown: -68
57. Defiance: -875—————————-57. Henry: -84
58. Hocking: -899—————————–58. Jackson: -85
59. Gallia: -973——————————–59. Sandusky: -86
60. Guernsey: -998————————–60. Meigs: -97
61. Henry: -1,030—————————–61. Coshocton: -100
62. Huron: -1,131—————————–62. Darke: -100
63. Preble: -1,139—————————-63. Adams: -106
64. Champaign: -1,253———————64. Guernsey: -107
65. Brown: -1,267—————————-65. Seneca: -114
66. Washington: -1,360———————66. Washington: -117
67. Darke: -1,433—————————-67. Erie: -127
68. Carroll: -1,451—————————68. Williams: -137
69. Seneca: -1,499————————-69. Putnam: -138
70. Marion: -1,534————————–70. Monroe: -151
71. Sandusky: -1,751———————-71. Tuscarawas: -188
72. Crawford: -2,039———————–72. Carroll: -252
73. Lawrence: -2,199———————-73. Crawford: -291
74. Erie: -2,249—————————–74. Scioto: -311
75. Belmont: -2,373————————75. Ashtabula: -362
76. Stark: -3,050—————————-76. Marion: -367
77. Allen: -3,128—————————-77. Mahoning: -373
78. Jefferson: -3,350———————-78. Wayne: -384
79. Scioto: -3,568————————–79. Allen: -428
80. Montgomery: -3,634——————80. Lawrence: -480
81. Ashtabula: -3,681———————81. Belmont: -539
82. Clark: -3,790—————————82. Jefferson: -555
83. Richland: -3,887———————-83. Richland: -578
84. Columbiana: -4,764——————84. Columbiana: -667
85. Mahoning: -9,011———————85. Stark: -986
86. Trumbull: -9,938———————-86. Trumbull: -1,321
87. Lucas: -10,928————————87. Lucas: -1,675
88. Cuyahoga: -31,595——————88. Cuyahoga: -4,940

Finally, let’s examine the components of population change, but top 15 only.

Top 15 Counties with the Most Births Census 2010-July 1, 2017 and July 1, 2016-July 1, 2017
Census 2010-July 1, 2017——————————–July 1, 2016-July 1, 2017

1. Franklin: +134,9580———————————–1. Franklin: +19,039
2. Cuyahoga: +107,949———————————-2. Cuyahoga: +14,637
3. Hamilton: +79,087————————————-3. Hamilton: +10,787
4. Montgomery: +48,275——————————–4. Montgomery: +6,576
5. Summit: +44,151—————————————5. Summit: +5,945
6. Lucas: +40,874—————————————–6. Lucas: +5,494
7. Butler: +32,888—————————————–7. Butler: +4,531
8. Stark: +30,188——————————————8. Stark: +4,163
9. Lorain: +24,497—————————————-9. Lorain: +3,329
10. Warren: +17,492————————————-10. Mahoning: +2,382
11. Mahoning: +17,312———————————11. Warren: +2,376
12. Clermont: +16,980———————————-12. Clermont: +2,307
13. Lake: +16,465—————————————–13. Lake: +2,244
14. Delaware: +15,662———————————-14. Delaware: +2,146
15. Trumbull: +15,153———————————–15. Trumbull: +2,059

Top 15 Counties with the Fewest Births Census 2010-July 1, 2017 and July 1, 2016-July 1, 2017
Census 2010-July 1, 2017——————————–July 1, 2016-July 1, 2017

1. Noble: +1,020——————————————-1. Noble: +131
2. Morgan: +1,050—————————————–2. Monroe: +135
3. Vinton: +1,051——————————————-3. Morgan: +139
4. Monroe: +1,083—————————————–4. Vinton: +144
5. Harrison: +1,150—————————————-5. Harrison: +149
6. Paulding: +1,595—————————————-6. Paulding: +213
7. Meigs: +1,762——————————————-7. Meigs: +228
8. Wyandot: +1,849—————————————8. Wyandot: +240
9. Carroll: +2,011—————————————–9. Carroll: +271
10. Hocking: +2,282————————————-10. Henry: +291
11. Henry: +2,295—————————————–11. Hocking: +309
12. Van Wert: +2,373————————————-12. Adams: +322
13. Adams: +2,431—————————————-13. Pike: +328
14. Ottawa: +2,489—————————————-14. Van Wert: +328
15. Pike: +2,504——————————————–15. Ottawa: +334

Top 15 Counties with the Most Deaths Census 2010-July 1, 2017 and July 1, 2016-July 1, 2017
Census 2010-July 1, 2017——————————–July 1, 2016-July 1, 2017

1. Cuyahoga: -98,692———————————–1. Cuyahoga: -13,439
2. Franklin: -65,458————————————–2. Franklin: -9,542
3. Hamilton: -56,157————————————-3. Hamilton: -7,768
4. Montgomery: -42,353——————————-4. Montgomery: -5,883
5. Summit: -40,895————————————–5. Summit: -5,735
6. Lucas: -31,778—————————————-6. Lucas: -4,465
7. Stark: -29.531—————————————–7. Stark: -4,077
8. Butler: -22,747—————————————-8. Butler: -3,347
9. Mahoning: -22,021———————————–9. Lorain: -2,947
10. Lorain: -21,265————————————-10. Mahoning: -2,920
11. Trumbull: -18,189———————————-11. Trumbull: -2,459
12. Lake: -17,265—————————————-12. Lake: -2,444
13. Clark: -12,267—————————————-13. Warren: -1,785
14. Clermont: -11,924———————————-14. Clermont: -1,706
15. Warren: -11,411————————————-15. Clark: -1,680

Top 15 Counties with the Fewest Deaths Census 2010-July 1, 2017 and July 1, 2016-July 1, 2017
Census 2010-July 1, 2017——————————–July 1, 2016-July 1, 2017

1. Noble: -916————————————————1. Noble: -131
2. Vinton: -1,025———————————————2. Vinton: -147
3. Morgan: -1,215——————————————-3. Morgan: -152
4. Monroe: -1,260——————————————-4. Harrison: -186
5. Paulding: -1,405—————————————–5. Paulding: -186
6. Harrison: -1,449——————————————6. Monroe: -189
7. Wyandot: -1,756—————————————–7. Wyandot: -246
8. Meigs: -2,004———————————————8. Henry: -249
9. Henry: -2,007———————————————9. Carroll: -289
10. Hocking: -2,131—————————————10. Meigs: -290
11. Putnam: -2,153—————————————–11. Hocking: -294
12. Carroll: -2,191—————————————–12. Putnam: -303
13. Holmes: -2,191—————————————–13. Van Wert: -306
14. Van Wert: -2,275—————————————14. Morrow: -308
15. Hardin: -2,284——————————————-15. Fayette: -318

Top 15 Counties with the Highest Natural Increase (Births vs. Deaths) Census 2010-July 1, 2017 and July 1, 2016-July 1, 2017
Census 2010-July 1, 2017——————————–July 1, 2016-July 1, 2017

1. Franklin: +69,500————————————-1. Franklin: +9,497
2. Hamilton: +22,930————————————2. Hamilton: +3,019
3. Butler: +10,141—————————————-3. Cuyahoga: +1,198
4. Cuyahoga: +9,257————————————4. Butler: +1,184
5. Lucas: +9,096——————————————5. Lucas: +1,029
6. Delaware: +8,339————————————-6. Delaware: +1,013
7. Warren: +6,081—————————————-7. Montgomery: +693
8. Montgomery: +5,922——————————–8. Clermont: +601
9. Clermont: +5,056————————————-9. Warren: +591
10. Holmes: +3,410————————————–10. Holmes: +445
11. Fairfield: +3,380————————————-11. Guernsey: +414
12. Wayne: +3,313—————————————12. Licking: +408
13. Summit: +3,256————————————-13. Wayne: +406
14. Lorain: +3,232—————————————14. Lorain: +382
15. Licking: +3,173————————————–15. Fairfield: +378

Top 15 Counties with the Lowest Natural Increase (Births vs. Deaths) Census 2010-July 1, 2017 and July 1, 2016-July 1, 2017
Census 2010-July 1, 2017——————————–July 1, 2016-July 1, 2017

1. Mahoning: -4,709—————————————1. Mahoning: -538
2. Trumbull: -3,036—————————————-2. Trumbull: -400
3. Jefferson: -2,097—————————————–3. Jefferson: -276
4. Belmont: -1,370——————————————4. Lake: -200
5. Erie: -990————————————————–5. Belmont: -197
6. Ottawa: -977———————————————-6. Ottawa: -171
7. Columbiana: -891—————————————7. Washington: -134
8. Washington: -829—————————————8. Erie: -132
9. Lake: -800———————————————–9. Columbiana: -130
10. Clark: -694———————————————10. Clark: -119
11. Scioto: -493——————————————–11. Scioto: -68
12. Crawford: -363—————————————-12. Lawrence: -67
13. Ashtabula: -354—————————————13. Meigs: -62
14. Harrison: -299—————————————–14. Monroe: -54
15. Lawrence: -285—————————————15. Harrison: -37

Top 15 Counties with the Most Domestic Migration Census 2010-July 1, 2017 and July 1, 2016-July 1, 2017
Census 2010-July 1, 2017——————————–July 1, 2016-July 1, 2017

1. Franklin: +18,270———————————-1. Franklin: +5,861
2. Delaware: +15,671———————————2. Delaware: +2,346
3. Warren: +6,996————————————-3. Fairfield: +1,491
4. Fairfield: +4,106————————————4. Warren: +1,332
5. Licking: +3,332————————————-5. Licking: +1,137
6. Medina: +2,900————————————-6. Medina: +1,058
7. Union: +1,953—————————————7. Union: +871
8. Pickaway: +1,489———————————-8. Greene: +763
9. Wood: +1,447—————————————9. Lake: +748
10. Clermont: +1,372——————————–10. Butler: +668
11. Miami: +1,293————————————-11. Madison: +639
12. Ottawa: +224————————————–12. Miami: +547
13. Madison: +177————————————13. Clermont: +515
14. Morgan: -186————————————–14. Ross: +379
15. Lorain: -271—————————————-15. Ottawa: +337

Top 15 Counties with the Least Domestic Migration Census 2010-July 1, 2017 and July 1, 2016-July 1, 2017
Census 2010-July 1, 2017——————————–July 1, 2016-July 1, 2017

1. Cuyahoga: -65,672————————————-1. Cuyahoga: -10,087
2. Hamilton: -25,292—————————————2. Lucas: -3,249
3. Lucas: -23,401——————————————-3. Montgomery: -1,656
4. Montgomery: -16,752———————————-4. Hamilton: -1,533
5. Summit: -10,630—————————————–5. Stark: -1,232
6. Trumbull: -6,852—————————————–6. Trumbull: -923
7. Mahoning: -6,113—————————————7. Wayne: -897
8. Allen: -4,673———————————————–8. Allen: -618
9. Stark: -4,510———————————————-9. Richland: -613
10. Richland: -4,240—————————————-10. Columbiana: -528
11. Columbiana: -3,802————————————11. Portage: -425
12. Ashtabula: -3,779—————————————12. Ashtabula: -412
13. Scioto: -3,267——————————————–13. Lawrence: -392
14. Clark: -3,198———————————————14. Marion: -389
15. Portage: -2,797—————————————–15. Tuscarawas: -382

Top 15 Counties with the Most International Migration Census 2010-July 1, 2017 and July 1, 2016-July 1, 2017
Census 2010-July 1, 2017——————————–July 1, 2016-July 1, 2017

1. Franklin: +40,914—————————————1. Franklin: +6,584
2. Cuyahoga: +24,799————————————2. Cuyahoga: +3,961
3. Hamilton: +14,063————————————–3. Hamilton: +2,288
4. Montgomery: +7,418————————————4. Montgomery: +1,131
5. Summit: +7,132——————————————5. Summit: +1,101
6. Butler: +5,226——————————————–6. Butler: +839
7. Lorain: +3,810——————————————–7. Lorain: +641
8. Greene: +3,443——————————————8. Portage: +546
9. Portage: +3,281—————————————–9. Lucas: +539
10. Lucas: +3,247——————————————10. Warren: +499
11. Warren: +3,140—————————————-11. Greene: +473
12. Delaware: +2,178————————————-12. Delaware: +336
13. Athens: +2,081—————————————–13. Athens: +326
14. Mahoning: +1,917————————————-14. Mahoning: +326
15. Lake: +1,740——————————————–15. Lake: +314

Top 15 Counties with the Least International Migration Census 2010-July 1, 2017 and July 1, 2016-July 1, 2017
Census 2010-July 1, 2017——————————–July 1, 2016-July 1, 2017

1. Lawrence: -168——————————————1. Lawrence: -19
2. Belmont: -113——————————————–2. Belmont: -18
3. Jefferson: -108——————————————-3. Jefferson: -16
4. Columbiana: -44—————————————–4. Columbiana: -7
5. Williams: -40———————————————-5. Williams: -6
6. Brown: -39————————————————6. Brown: -4
7. Holmes: -16———————————————–7. Holmes: -3
8. Monroe: -5————————————————8. Monroe: -1
9. Vinton: -2————————————————–9. Van Wert: -1
10. Meigs: 0————————————————10. Harrison: 0
11. Trumbull: +2——————————————-11. Ottawa: 0
12. Harrison: +4——————————————-12. Vinton: 0
13. Adams: +7———————————————13. Meigs: +1
14. Van Wert: +10—————————————-14. Noble: +1
15. Noble: +10——————————————–15. Pike: +1
16. Morgan: +10

Top 15 Counties with the Most Net Migration Census 2010-July 1, 2017 and July 1, 2016-July 1, 2017
Census 2010-July 1, 2017——————————–July 1, 2016-July 1, 2017

1. Franklin: +59,184—————————————1. Franklin: +12,445
2. Delaware: +17,849————————————–2. Delaware: +2,682
3. Warren: +10,136—————————————-3. Warren: +1,831
4. Fairfield: +5,274—————————————–4. Fairfield: +1,686
5. Licking: +3,928——————————————5. Butler: +1,507
6. Lorain: +3,539——————————————–6. Greene: +1,236
7. Medina: +3,492——————————————-7. Licking: +1,225
8. Wood: +2,720———————————————8. Medina: +1,142
9. Butler: +2,527——————————————–9. Lake: +1,062
10. Union: +2,415—————————————–10. Lorain: +969
11. Greene: +2,038—————————————-11. Union: +952
12. Clermont: +1,975————————————-12. Hamilton: +755
13. Miami: +1,662——————————————-13. Madison: +679
14. Pickaway: +1,556————————————-14. Summit: +649
15. Athens: +1,285——————————————15. Clermont +609

Top 15 Counties with the Least Net Migration Census 2010-July 1, 2017 and July 1, 2016-July 1, 2017
Census 2010-July 1, 2017——————————–July 1, 2016-July 1, 2017

1. Cuyahoga: -40,873————————————1. Cuyahoga: -6,126
2. Lucas: -20,154——————————————2. Lucas: -2,710
3. Hamilton: -11,229————————————–3. Stark: -1,061
4. Montgomery: -9,334———————————–4. Trumbull: -918
5. Trumbull: -6,850—————————————-5. Wayne: -794
6. Allen: -4,504———————————————6. Allen: -596
7. Mahoning: -4,196————————————–7. Richland: -587
8. Richland: -4,087—————————————-8. Columbiana: -535
9. Columbiana: -3,846————————————9. Montgomery: -525
10. Summit: -3,496—————————————-10. Lawrence: -411
11. Stark: -3,408——————————————-11. Marion: -379
12. Ashtabula: -3,327————————————-12. Belmont: -341
13. Scioto: -3,064——————————————13. Ashtabula: -336
14. Clark: -3,032——————————————–14. Tuscarawas: -326
15. Huron: -2,359——————————————-15. Holmes: -319

So there you have it for counties. Visit here for the 2017 metro statistics.


Franklin County Home Values and Gentrification

Home values are, in part, tied to how well a neighborhood is performing. In the case of urban neighborhoods, how home values change over time may be a good indication of how that neighborhood is revitalizing. I looked at median home values by census tract for the years 2000 and 2010. Here is the map of how values changed during that period.
Franklin County home values
What the different colors indicate are different levels of performance, obviously. Yellow and oranges indicate decline, which few areas experienced. Light green, which makes up quite a bit of the suburban areas in and outside 270, indicates mostly stability or slow growth (but below average) in home values. Dark green is average to a bit above average growth. Blues and purple are high growth areas.

What the map shows it that the strongest growth in median home values occurred in the urban core neighborhoods, especially along the High Street corridor. Pockets of strong growth also occurred around Easton and sporadically in some suburban areas. What this says, particularly for the urban core, is that quite a few neighborhoods are on the rise. Grandview, Upper Arlington, the Short North, Campus, Clintonville, German and Merion Villages, the western half of Weinland Park, Downtown, and the Near East Side around Franklin Park were some of the best performing areas. This would seem to indicate that strong gentrification is taking place.