Worst Winters of All Time


As summer slowly approaches its inevitable end, thoughts of winter have started to creep into our minds. The last two winters seemed particularly harsh, and questions were often asked as to their historic status as well as whether another bad winter was on the way. Ask any older person in Ohio, and the winters between 1976 and 1979 will often come up. But do they really deserve their reputations? To find out, I came up with a ranking system for meteorological winter only- December through February0- to rank the worst winters of all time. Here was the criteria:

Temperature: # of 32 or Below Highs, # of 32 or Below Lows, # of 0 or Below Highs, # of 0 or Below Lows: Each earned the winter a point for each day that featured these conditions.
# of 60 or Above Highs and # of 50 or Above Lows meant a point was removed for each occurrence.

Precipitation: # of Days with Measurable Snowfall, # of 1″+ Snow Days, # of 2.5″+ Snow Days, # of 5″+ Snow Days, # of 10″+ Snow Days as well as # of Measurable Precipitation Days all counted as 1 point for each occurrence.

I then added the temperature and precipitation points together to come up with a ranking for how miserable each winter really was.

Here are the 30 worst winters of all time and their total points.
1. 1976-1977: 240
2. 1977-1978: 238
3. 1969-1970: 230
4. 2002-2003: 228
5. 1978-1979: 226
6. 1880-1881: 225
7. 1917-1918: 223
8. 1935-1936: 220
9. 2013-2014: 219
10. 1892-1893, 1962-1963: 218
11. 1909-1910: 217
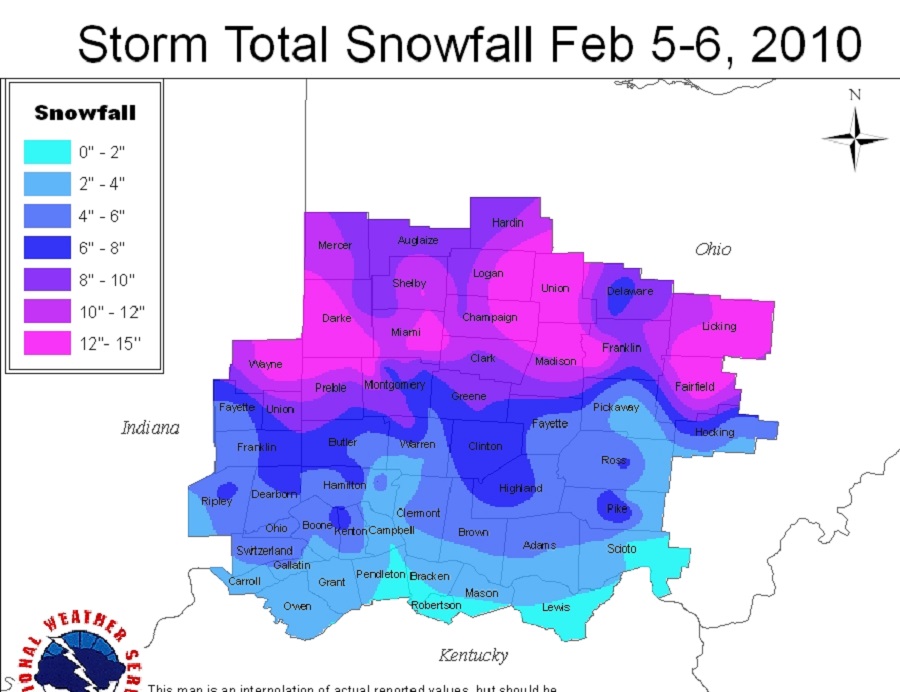
12. 1995-1996, 2009-2010: 208
13. 2010-2011: 207
14. 1903-1904: 204
15. 1981-1982: 202
16. 1911-1912, 1963-1964: 197
17. 1886-1887, 1919-1920: 196
18. 1904-1905: 195
19. 1984-1985: 194
20. 1916-1917: 193
21. 1894-1895: 191
22. 1883-1884: 189
23. 2000-2001: 188
24. 1947-1948, 1961-1962: 187
25. 1993-1994: 186
26. 1884-1885, 1939-1940: 185
27. 1983-1984, 1987-1988: 183
28. 1902-1903, 2014-2015: 182
29. 1954-1955: 180
30. 1878-1879, 1882-1883, 1960-1961, 1985-1986, 2003-2004, 2008-2009: 179

Do any of these surprise you? Both 2013-2014 and 2014-2015 are in the top 30 worst, but only 2013-2014 is in the top 10. In fact, other recent winters like 2000-2001, 2002-2003, 2009-2010 and 2010-2011 are all ranked worse than last winter. There have been a surprising number of recent winters in the top 30, however. There have been 8 total since 2000. No other similar time frame has produced as many.

And here are the 30 best winters (if you like warm, snowless, dry winters, that is).
1. 1931-1932: 74
2. 1889-1890: 75
3. 1879-1880: 86
4. 1997-1998: 102
5. 1881-1882, 1943-1944: 111
6. 2001-2002: 112
7. 1996-1997: 115
8. 1948-1949, 1953-1954: 118
9. 1941-1942, 1982-1983: 120
10. 1918-1919: 122
11. 1936-1937: 123
12. 1932-1933, 1991-1992: 124
13. 1930-1931: 125
14. 1905-1906, 1972-1973: 126
15. 1949-1950: 128
16. 1897-1898, 1986-1987: 129
17. 2011-2012: 130
18. 1938-1939: 131
19. 1937-1938: 134
20. 1908-1909, 1920-1921, 2005-2006: 135
21. 1924-1925: 137
22. 1896-1897: 138
23. 1927-1928, 1929-1930, 1940-1941, 1990-1991: 139
24. 1952-1953: 140
25. 1921-1922, 1945-1946, 1998-1999: 141
26. 1988-1989: 143
27. 1891-1892: 144
28. 1946-1947, 1971-1972: 145
29. 1912-1913, 1934-1935: 147
30. 1923-1924, 1992-1993: 148

Look how many of the warmest/least snowy occur between 1920 and 1945. Historically, this period had the fewest number of cold and/or snowy winters on record of any such 25-year period.

And what about winter 2015-2016? Well, that remains to be seen. However, the developing strong El Nino suggests a warmer than average winter. However, factors such as its position (west or east-based) as well as the PDO could throw some wrenches into that standard El Nino forecast. Either way, it will likely not be a top 30 worst.

January 1879 Arctic Outbreak


January 1879 arctic outbreak

After a generally cold December, the January 1879 arctic outbreak would begin the new year, leading to Columbus’ 2nd coldest temperature ever officially recorded. The outbreak began on January 2nd, when a strong cold front moved in from the northwest in the early afternoon hours. The temperature fell rapidly during the evening, reaching a low of -13 on the 2nd for a total drop that day of 42 degrees. The core of the cold air moved across Ohio during the day of the 3rd, so temperatures warmed very little. Highs across the state were in the single digits south to below zero across the norther 2/3rds. Columbus had a rare below zero high of -4, which is the 2nd coldest January high on record and the 3rd coldest high of any month. The low on the 3rd was a frigid -20. This low stood as the coldest temperature in Columbus for 115 years, only being surpassed during the great arctic outbreak of January 1994, during which the temperature fell to -22.

The strong front was very moisture starved, and only a few tenths to an inch to an inch of snow fell with its passage.

Temperatures remained in the single digits for two more days before a gradual warming commenced. By the 8th temperatures went above freezing. The rest of January 1879 was fairly tame. 16 days after the 8th had highs of 35 or greater.

Of note is that the temperature of -20 occurred two more times before the end of the 19th century, in January 1884 and February 1899.

The 1901 Mega Cold Front


1901 mega cold front

The 1901 mega cold front was a massive wake-up call after a relatively tranquil, if not cool, fall. Temperatures through November and early December 1901 had been persistently below normal. 24 days in November had been below normal, and but for a few days very early in December, this pattern continued. However, beginning on December 11th, temperatures began to rise ahead of an approaching weather system. By the 13th, temperatures reached record highs in Columbus when they spiked at 65 degrees. The following day started equally warm with a record high of 65. However, a change was coming.

To the northwest of Ohio, temperatures were plunging rapidly as a deep, cold high pressure system was being pulled south. Dispatch headlines warned of the record-breaking cold.

A powerful cold front would move through late on the 14th, and temperatures began to plummet. By midnight, the temperature had dropped all the way down to just 14 degrees, a single day drop of 51 degrees! A driving rain accompanied the frontal passage, but quickly changed over to heavy snow that accumulated 3″-5″ across the area.

On the 15th, the temperature continued to fall, albeit more slowly, and by midnight the reading was -4. This mega-cold front had produced a 69-degree total drop in Columbus, which made it one of the strongest cold fronts ever to move through the Ohio region.

The weather map on December 14, 1901, as the front began pushing through Ohio.

The front would bring a major pattern change. Every day from the 15th-21st featured highs in the teens, which set many daily low maximum records, some of which still stand more than 100 years later.

The winter of 1901-02 was generally cold and snowy in the Ohio Valley, but no future front that winter would come close to December 14-15th of 1901.

To view more local and current weather, visit: Wilmington National Weather Service
And for more historic December records, check out: December Weather Records


The February 5-6, 2010 Snowstorm


The winter of 2009-2010 will go down as one of the best ever (if you like winter, that is). The biggest reason for that is February 2010 and its cascade of significant winter storms that placed the month as one of the snowiest of all time. The February 5-6, 2010 snowstorm event was one of the capping events of the month and winter as a whole.

The first event started in the morning on February 5th. Forecasts in the days leading up to this event were mixed. Models were showing a lot of precipitation, but also a strong push of upper-level warm air into Ohio. How far north this warm layer reached was the point of contention. In most years, the WTOD, or the “Warm Tongue of Death” as some Ohio weather enthusiasts like to refer to it, is a constant threat each and every winter. When a storm is moving north or northeast south of the state, they tend to pull warm air north, and the Appalachian Mountains act like a funnel directing this warm air straight into Ohio. During winter events, it presents itself as a layer of warm air above the surface, often turning snow to ice, sleet or just plain rain, even if the surface itself is relatively cold. It’s a constant source of frustration for winter weather lovers. It was this phenomenon that was predicted to strike again and the dividing line, as it so often is, was predicted to be along I-70/I-71. North of there, mostly or all snow was predicted, while south was more mix, ice and rain. The I-70 corridor, including Columbus, was to be the northern extent of this mixing, limiting snowfall accumulations. Still, even with the mix predicted, a solid 4″-6″ was predicted, which is a decent event by itself and typically the largest snow event of any given winter.

Precipitation began as snow across southern counties by dawn and spread north, reaching the Columbus area between 9AM and 9:30AM. It started out as flurries, but the flakes were already fairly large. Within 15 minutes, the flurries had turned to very heavy, wet snow. Flakes were as large as quarters at times and stayed large, accumulating quickly despite the above freezing temperatures. Visibility quickly dropped to a half mile or less at times, and traffic quickly snarled with accidents as plows could not keep up with the pace of the inch-per-hour snowfall rates. Between 4PM and 5PM, there was a respite as snowfall lightened and there was a mix of sleet and ice pellets, but all snow resumed once heavier precipitation moved in, concluding the only and very short period of mixing I-70 had. Snow continued through the night of the 5th and into the 6th, finally ending before noon.

Snowfall totals were impressive, especially along and north of I-70, where little mixing took place, but also in pockets to the southeast of Columbus, like Lancaster. For Columbus, the 9.9″ that fell was good enough to be a top 15 largest snowstorm for the city. It would not, however, be the largest snowfall of the month.

Some snow totals across Ohio from February 5-6, 2010
Greenville: 14.8″
Lancaster: 13.0″
Akron: 12.1″
Bellefontaine: 12.0″
Urbana: 12.0″
Westerville: 11.4″
Dayton: 11.1″
Springfield: 11.0″
Columbus: 9.9″
Youngstown: 8.4″
Delaware: 8.0″
Cleveland: 5.9″
Cincinnati: 4.5″
Circleville: 3.0″
Toledo: 3.0″

The February 5-6, 2010 snowstorm Columbus, Ohio

Snow totals for the NWS Wilmington area.

This event was the only the beginning of what would be a trio of consecutive snowstorms that would strike the area over the course of 11 days, including the February 9-10, 2010 Snowstorm, which occurred just a few days later.

The Wilmington National Weather Service, meanwhile, is a great source if you want to know the current weather in the area.