Is North Linden the Best Neighborhood for a Starter Home?


Is North Linden the best neighborhood for a starter home in Columbus? For many local residents, when they hear “Linden”, they may only think of negatives such as crime and neighborhood condition. Like many other parts of urban Columbus, the area is changing as development forces and population growth have begun pushing in from all sides, however.

With the Columbus market on fire, supply low and prices skyrocketing due to heavy demand, Linden homes are being looked at with a new perspective. Linden homes are some of the most affordable anywhere in Columbus, and while the neighborhood can be hit or miss to say the least, North Linden has begun to emerge as a destination for first-time home buyers.

Although the southern part of Linden was constructed before WWII, the vast majority of the remaining area was built in the 1950s and 1960s as former soldiers looked to start new lives.
Because of the era in which many of the homes were built, most are single-story ranches or Cape Cod style cottages. The square footage of many of these homes tends to be around 1000 square feet or less. Until recently, the small relative size, among other issues, kept buyers away. The aforementioned tight real-estate market has given these homes potential new life.

North Linden is generally the part of the neighborhood that is to the between I-71 and Cleveland Avenue west to east and between Hudson Avenue and Cooke Road south to north. Let’s take a look at some of the homes currently on the market in this area to get a feel for what is available there.

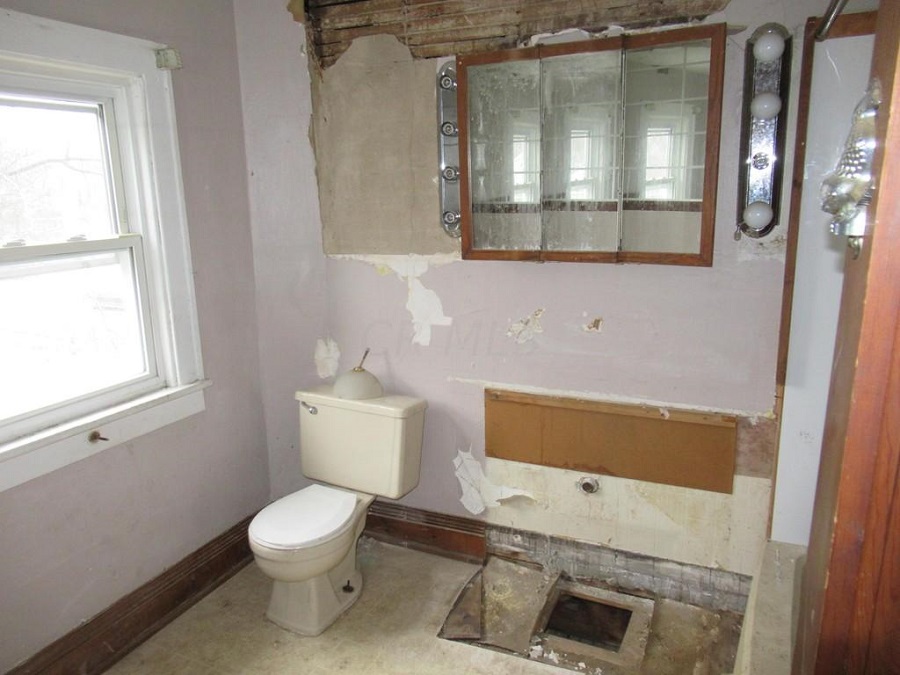
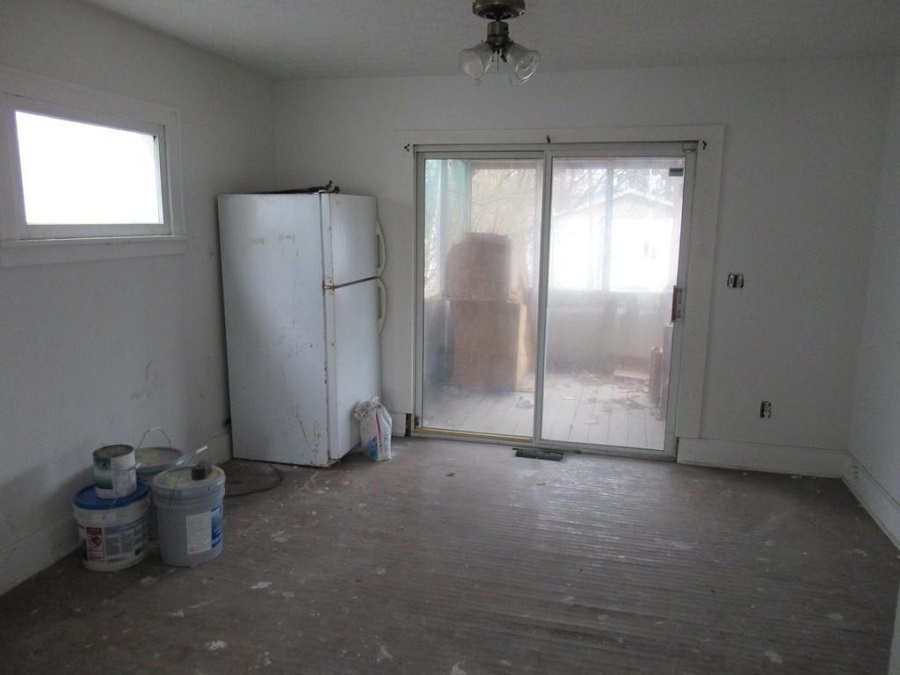
1541 Genessee Avenue: $25,000
Square Footage: 1,056
This pre-WWII home is an example of many in the area that need some level of renovations- in this home’s case- major renovations. For those willing to take on a challenge, these types of inexpensive purchases could be a consideration.
Best neighborhood for a starter home 1541 Gennessee Avenue

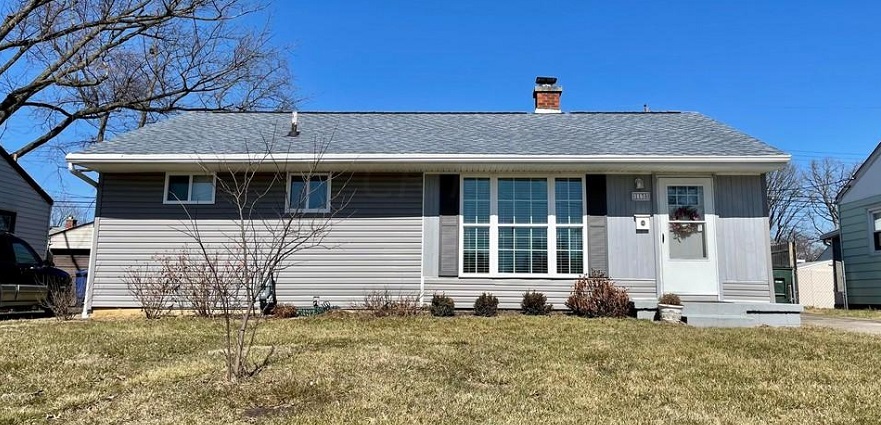
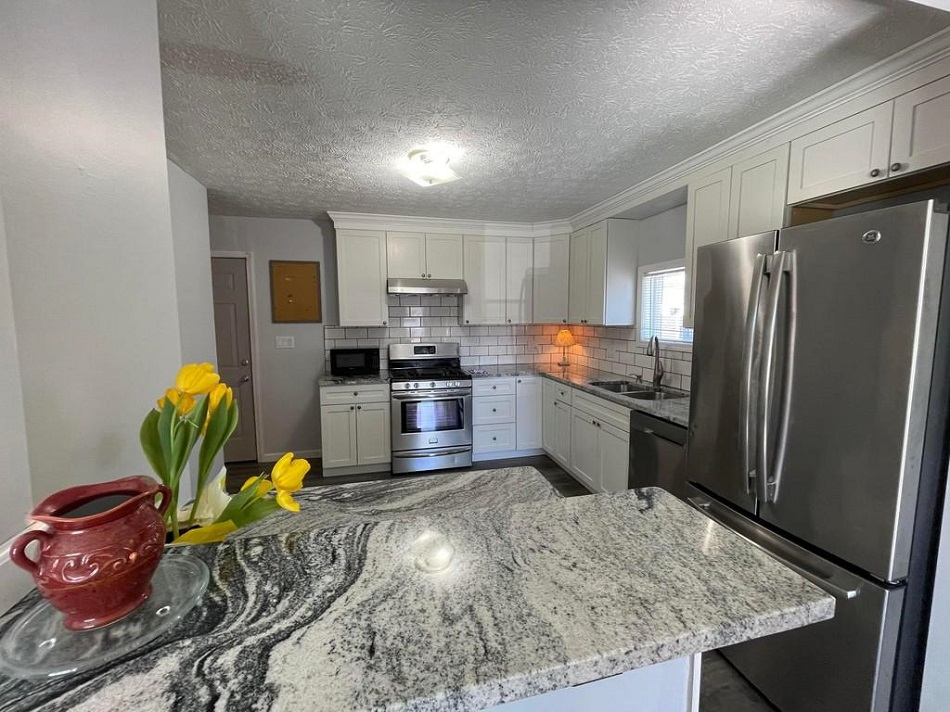
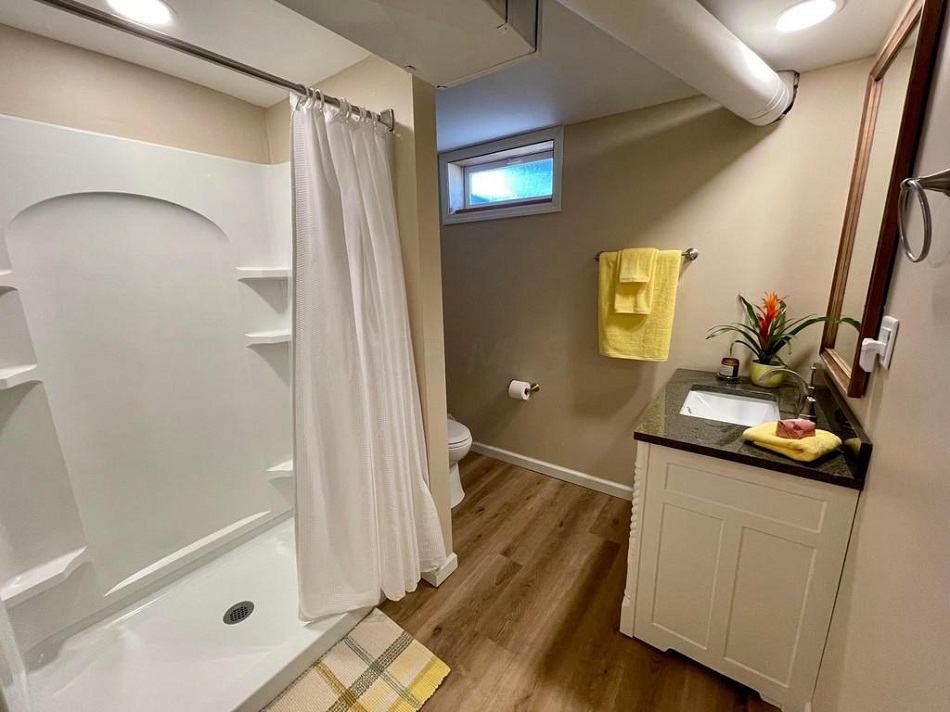
1130 Pauline Avenue: $185,000
Square Footage: 1,412
Built in 1955, this home is much more typical of the housing stock that exists within the neighborhood, but on the larger side. Unlike the home above, this one has been fully renovated and shows the potential of what they can become. This type of home represents the top of the market in terms of price in the neighborhood, showing just how affordable the area really is.
https://www.realtor.com/realestateandhomes-detail/1130-Pauline-Ave_Columbus_OH_43224_M37110-45745


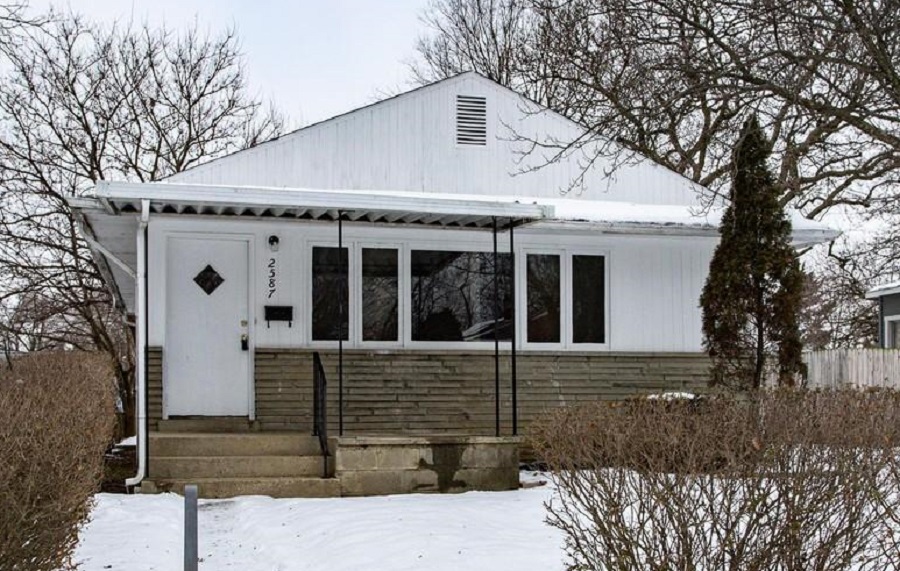
2587 Azelda Street: $119,900
Square Footage: 1,045
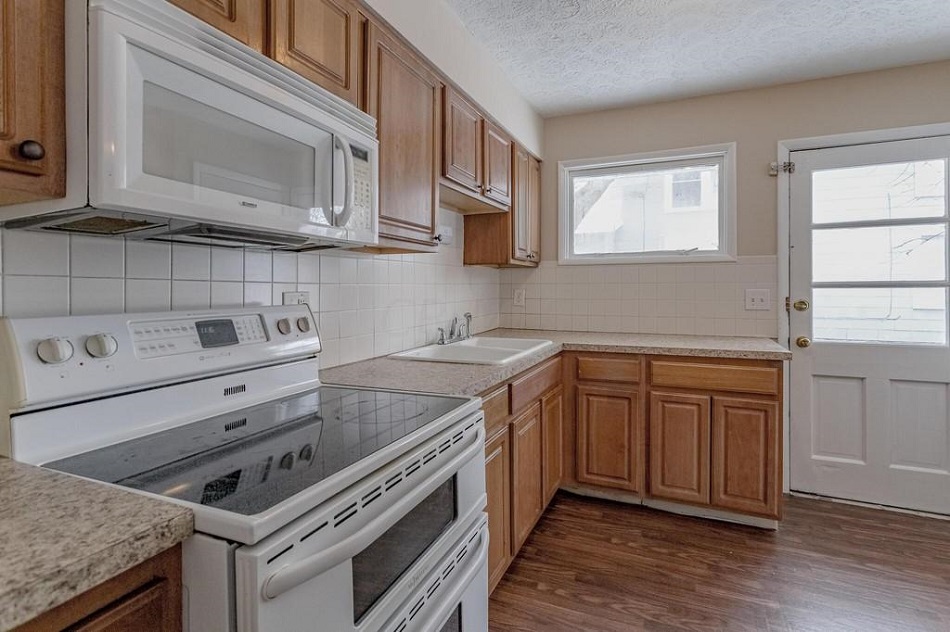
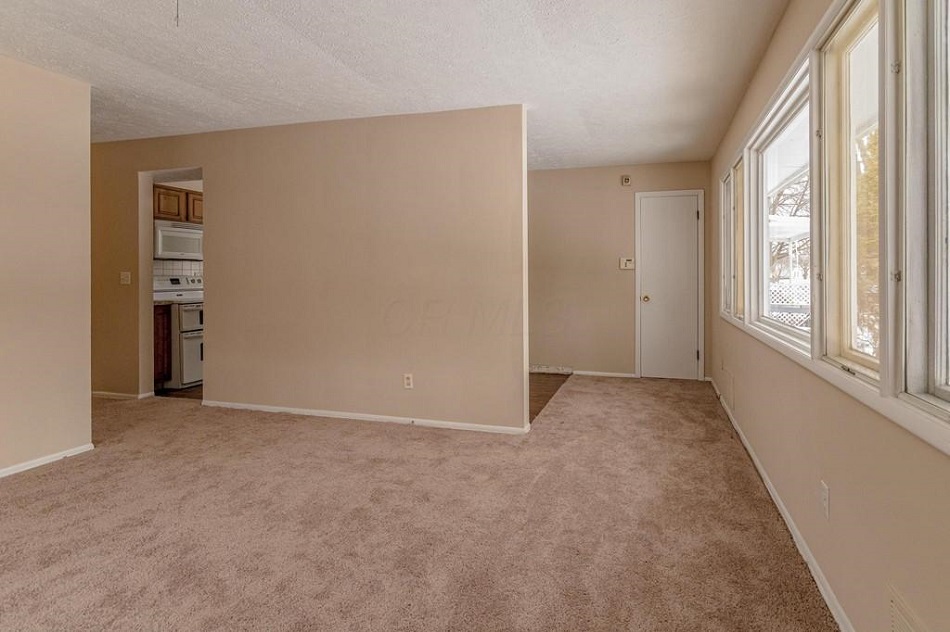
This 1956 home is typical of many in the area. It doesn’t necessarily have a brand new renovation, but has been kept updated and maintained over the years, so it is in great condition for an individual or small family.
https://www.realtor.com/realestateandhomes-detail/2587-Azelda-St_Columbus_OH_43211_M49757-14142


Beyond the less expensive prices and variety of quality fixer-uppers and renovated starter homes, North Linden is also well-situated near popular areas such as Easton, Clintonville, OSU Campus and the Morse corridor, which is rich in locally-owned restaurants and markets that specialize in foods and products from Asia, Africa and the Middle East.
While there are many positives, some negatives might be higher crime in some spots- particularly closer to Cleveland Avenue- lack of walkability to amenities, and lower ranked schools within the Columbus district. As with any neighborhood, prospective residents must weigh the pros and cons according to their own lifestyles and needs. If one is a current Columbus resident looking to downsize, or a new family to Columbus looking to purchase their first home in an extremely difficult market to break into, North Linden does offer some opportunities that other neighborhoods do not.

The North Linden Area Commission and the
Linden Neighborhood links provide additional news and information on this up and coming area of Columbus.


Housing Market Update January 2017


housing market update January 2017 Columbus, Ohio

The recent housing market update January 2017 edition information comes from Columbus Realtors.

Note: LSD= Local School District, CSD= City School District. In both cases, school district boundaries differ from city boundaries.

Top 15 Most Expensive Locations By Median Sales Price in January 2017
1. New Albany: $535,000
2. New Albany Plain LSD: $397,450
3. German Village: $376,000
4. Powell: $354,950
5. Dublin: $343,600
6. Granville CSD: $330,000
7. Bexley: $325,000
8. Upper Arlington CSD: $319,500
9. Olentangy LSD: $315,000
10. Big Walnut LSD: $306,250
11. Dublin CSD: $271,500
12. Worthington: $270,000
13. Buckeye Valley LSD: $259,000
14. Sunbury: $253,000
15. Downtown: $243,750

Top 15 Least Expensive Locations by Median Sales Price in January 2017
1. Obetz: $80,100
2. Hamilton LSD: $80,100
3. Whitehall: $85,950
4. Newark CSD: $86,900
5. Lancaster CSD: $103,000
6. Jefferson LSD: $123,000
7. London CSD: $124,000
8. Groveport Madison LSD: $125,900
9. Reynoldsburg CSD: $125,950
10. Columbus CSD: $129,900
11. South-Western CSD: $131,000
12. Columbus: $140,026
13. Jonathan Alder LSD: $150,000
14. Minerva Park: $159,500
15. Grove City: $160,950

Overall Market Median Sales Price in January 2017: $160,368
Median Sales Price Change January 2016-January 2016: +$3,172

Top 15 Locations with the Highest Median Sales Price % Growth Between January 2016 and January 2017
1. Whitehall: +69.5%
2. Circleville CSD: +64.9%
3. Sunbury: +63.0%
4. Jefferson LSD: +53.5%
5. Big Walnut LSD: +44.1%
6. Canal Winchester CSD: +40.9%
7. Westerville: +29.8%
8. Westerville CSD: +27.3%
9. Powell: +25.4%
10. Pataskala: +24.0%
11. Olentangy LSD: +23.5%
12. Gahanna Jefferson CSD: +21.8%
13. Grandview Heights: +21.2%
14. Granville CSD: +20.0%
15. Pickerington: +17.7%

Top 15 Locations with the Lowest Median Sales Price % Growth Between January 2016 and January 2017
1. London CSD: -53.5%
2. Obetz: -38.3%
3. Hamilton LSD: -27.1%
4. Jonathan Alder LSD: -25.2%
5. Buckeye Valley LSD: -23.0%
6. Reynoldsburg CSD: -18.7%
7. Hilliard: -17.7%
8. Lancaster CSD: -17.6%
9. Grove City: -15.3%
10. Dublin CSD: -12.8%
11. Johnstown-Monroe LSD: -10.8%
12. Upper Arlington CSD: -8.5%
13. Newark CSD: -8.1%
14. Dublin: -7.1%
15. South-Western CSD: -6.4%

Overall Market Median Sales Price % Change January 2016-January 2017: +2.0%

Top 10 Locations with the Most New Listings in January 2017
1. Columbus: 829
2. Columbus CSD: 544
3. South-Western CSD: 136
4. Olentangy LSD: 122
5. Westerville CSD: 100
6. Hilliard CSD: 94
7. Dublin CSD: 89
8. Worthington CSD: 66
9. Dublin: 64
10. Pickerington LSD: 60

Top 10 Locations with the Fewest New Listings in January 2017
1. Valleyview: 0
2. Lithopolis: 1
3. Minerva Park: 2
4. Sunbury: 2
5. Obetz: 3
6. Johnstown Monroe LSD: 5
7. Jefferson LSD: 8
8. Jonathan Alder LSD: 8
9. German Village: 8
10. Hamilton LSD: 8
11. Northridge LSD: 9

Total New Listings in the Columbus Metro in January 2017: 2,002
Overall Metro New Listings % Change January 2016-January 2017: -1.9%

Top 10 Fastest-Selling Locations by # of Days Homes Remain on the Market Before Sale in January 2017
1. Obetz: 18
2. Sunbury: 21
3. Pataskala: 22
4. Jefferson LSD: 26
5. Gahanna: 28
6. Minerva Park: 28
7. Delaware CSD: 29
8. Bexley: 31
9. Hilliard CSD: 31
10. Pickerington: 31
11. Worthington CSD: 31

Top 10 Slowest-Selling Locations by # of Days Homes Remain on the Market Before Sale in January 2017
1. Dublin: 96
2. New Albany: 93
3. Dublin CSD: 82
4. Powell: 80
5. Granville CSD: 79
6. Olentangy LSD: 78
7. Downtown: 77
8. Grandview Heights: 76
9. New Albany Plain LSD: 68
10. Canal Winchester CSD: 67
11. New Albany CSD: 65
12. Upper Arlington CSD: 62
13. Circleville CSD: 61
14. Johnstown Monroe LSD: 61
15. Hamilton LSD: 60

# of Days For-Sale Homes Remain on the Market Before Sale Across the Metro Overall: 51.6
Change in # of Days Before Sale January 2016-January 2017: -22.0


Top 10 Locations with the Greatest % Decline of # of Days on the Market Before Sale January 2016-January2017
1. Obetz: -89.2%
2. Pataskala: -64.5%
3. Whitehall: -64.3%
4. Circleville CSD: -56.1%
5. Gahanna: -53.3%
6. Grove City: -49.2%
7. Delaware CSD: -44.2%
8. Bexley: -40.4%
9. Pickerington LSD: -39.7%
10. Worthington CSD: -38.0%

Top 10 Locations with the Lowest % Decline of # of Days on the Market Before Sale January 2016-January 2017
1. German Village: +161.1%
2. Worthington: +123.8%
3. Powell: +77.8%
4. Grandview Heights: +46.2%
5. Big Walnut LSD: +41.5%
6. Minerva Park: +40.0%
7. Jonathan Alder LSD: +37.8%
8. Canal Winchester CSD: +31.4%
9. Marysville CSD: +28.3%
10. Johnstown Monroe LSD: +27.1%

% Change for the # of Days Homes Remain on the Market Before Sale Across the Metro Overall: -29.9%


Housing Market Update March 2013


housing market update March 2013

This Columbus housing market update for March 2013 includes an expansion of data, specifically the time it takes for homes to sell on the current market.

Note: LSD= Local School District, CSD= City School District. In both cases, school district boundaries differ from city boundaries.

Top 15 Most Expensive Locations By Median Sales Price in March 2013
1. New Albany: $471,000
2. Dublin: $330,000
3. Powell: $317,000
4. New Albany Plain LSD: $316,000
5. Upper Arlington CSD: $302,450
6. Olentangy LSD: $291,250
7. Granville CSD: $282,050
8. Downtown: $269,000
9. German Village: $267,250
10. Dublin CSD: $266,500
11. Hilliard: $250,000
12. Big Walnut LSD: $245,000
13. Buckeye Valley LSD: $243,000
14. Johnstown Monroe LSD: $207,250
15. Bexley: $205,000

Top 15 Least Expensive Locations by Median Sales Price in March 2013
1. Whitehall: $45,250
2. Obetz: $56,450
3. Groveport Madison LSD: $63,625
4. Hamilton LSD: $66,750
5. Columbus CSD: $85,000
6. Lancaster CSD: $89,550
7. Newark CSD: $89,900
8. South-Western CSD: $100,000
9. Columbus: $103,250
10. Sunbury: $106,900
11. Reynoldsburg CSD: $115,000
12. Jefferson LSD: $122,000
13. Blacklick: $123,500
14. London CSD: $128,000
15. Grandview Heights: $136,000

Whitehall was the cheapest market yet again, though its median prices have been going up slowly.

Overall Market Median Sales Price in March 2013: $139,028

Top 15 Locations with the Highest Median Sales Price % Growth Between March 2012 and March 2013
1. Minerva Park: +223.8%
2. Jonathan Alder LSD: +99.0%
3. Circleville CSD: +63.3%
4. Buckeye Valley LSD: +59.3%
5. Johnstown Monroe LSD: +53.5%
6. Reynoldsburg CSD: +47.4%
7. Hilliard: +47.1%
8. Downtown: +34.6%
9. Big Walnut LSD: +31.5%
10. Westerville CSD: +28.3%
11. Powell: +28.1%
12. Gahanna: +22.0%
13. Olentangy LSD: +18.4%
14. Marysville CSd: +14.8%
15. Worthington: +13.9%

Downtown continued to do well, but otherwise few places inside 270 did.

Top 15 Locations with the Lowest Median Sales Price % Growth Between March 2012 and March 2013
1. Grandview Heights: -43.7%
2. Sunbury: -42.6%
3. Obetz: -29.3%
4. Whitehall: -24.3%
5. Bexley: -21.1%
6. Lithopolis: -20.1%
7. Hamilton LSD: -15.8%
8. Blacklick: -12.0%
9. Pataskala: -9.2%
10. Delaware CSD: -5.3%
11. Gahanna Jefferson CSD: -5.1%
12. Beechwold/Clintonville: -4.1%
13. South-Western CSD: -2.9%
14. London CSD: -1.9%
15. Columbus CSD: -1.0%

Overall Market Median Sales Price % Change March 2012 vs. March 2013: +9.9%

Top 10 Locations with the Most New Listings in March 2013
1. Columbus: 1,309
2. Columbus CSD: 811
3. South-Western CSD: 221
4. Olentangy LSD: 197
5. Hilliard CSD: 195
6. Westerville CSD: 185
7. Dublin CSD: 140
8. Pickerington LSD: 100
9. Worthington CSD: 97
10. Dublin: 93

Top 10 Locations with the Fewest New Listings in March 2013
1. Valleyview: 1
2. Lithopolis: 2
3. Minerva Park: 4
4. Jefferson LSD: 6
5. Johnstown Monroe LSD: 8
6. Jonathan Alder LSD: 9
7. Obetz: 10
8. Hamilton LSD: 13
9. Grandview Heights: 14
10. Sunbury: 17
11. Circleville CSD: 17

Total New Listings in the Columbus Metro in March 2013: 3,222
Overall Metro New Listings % Change March 2012-March 2013: +0.2%

Prices were up almost 10% year over year for the month despite a small increase in overall supply.

Top 10 Fastest-Selling Locations by # of Days Homes Remain on the Market Before Sale in March 2013
1. Minerva Park: 3
2. Worthington: 29
3. Granville CSD: 35
4. Jonathan Alder LSD: 36
5. Upper Arlington CSD: 51
6. Downtown: 54
7. Pickerington: 54
8. Pickerington LSD: 60
9. Dublin CSD: 61
10. Grandview Heights: 63
11. Groveport Madison LSD: 63
12. Reynoldsburg CSD: 63
13. South-Western CSD: 63
14. Grove City: 65
15. Powell: 65

Top 10 Slowest-Selling Locations by # of Days Homes Remain on the Market Before Sale in March 2013
1. Bexley: 188
2. Circleville CSD: 168
3. Sunbury: 163
4. Lancaster CSD: 140
5. Big Walnut LSD: 129
6. Hilliard: 125
7. Lithopolis: 121
8. Newark CSD: 120
9. Obetz: 119
10. Gahanna: 117

The Columbus Realtors provides market condition reports going back many years.


Housing Market Update January 2013


housing market update January 2013

Columbus housing market update January 2013

We’re starting a new year in this edition of the Columbus Housing Market Update, with new January 2013 data now available!

Note: LSD= Local School District, CSD= City School District. In both cases, school district boundaries differ from city boundaries.

Top 15 Most Expensive Locations By Median Sales Price in January 2013
1. New Albany: $447,500
2. Powell: $342,500
3. Upper Arlington CSD: $320,000
4. New Albany Plain LSD: $314,400
5. Dublin: $284,00
6. Bexley: $269,950
7. Olentangy LSD: $250,101
8. German Village: $241,618
9. Worthington: $228,938
10. Grandview Heights: $223,000
11. Downtown: $210,000
12. Granville CSD: $207,000
13. Dublin CSD: $190,450
14. Big Walnut LSD: $187,000
15. Marysville CSD: $182,000

New Albany continued to be the most expensive market.

Top 15 Least Expensive Locations by Median Sales Price in January 2013
1. Whitehall: $29,750
2. Hamilton LSD: $54,500
3. Columbus CSD: $68,500
4. Groveport Madison LSD: $70,000
5. Lancaster CSD: $71,250
6. Valleyview: $79,850
7. Newark CSD: $84,500
8. Reynoldsburg CSD: $94,500
9. Columbus: $95,000
10. Jefferson LSD: $95,000
11. South-Western CSD: $103,000
12. Circleville CSD: $109,000
13. Canal Winchester CSD: $112,000
14. Pataskala: $120,000
15. London CSD: 122,000

Whitehall was by far the cheapest market to buy into this month.

Overall Market Median Sales Price in January 2013: $120,885

Top 15 Locations with the Highest Median Sales Price % Growth Between January 2012 and January 2013
1. Newark CSD: +83.3%
2. Valleyview: +76.5%
3. Lithopolis: +71.1%
4. Circleville CSD: +61.4%
5. Groveport Madison LSD: +60.9%
6. Marysville CSD: +38.8%
7. London CSD: +34.8%
8. New Albany: +29.7%
9. Columbus CSD: +28.0%
10. Grandview Heights: +27.4%
11. Columbus: +26.7%
12. Upper Arlington CSD: +24.3%
13. Downtown: +19.3%
14. Sunbury: +18.4%
15. South-Western CSD: +16.1%

Downtown and Columbus overall made the top markets for appreciation in the past year.

Top 15 Locations with the Lowest Median Sales Price % Growth Between January 2012 and January 2013
1. Granville CSD: -50.7%
2. Jonathan Alder LSD: -33.0%
3. Westerville: -29.2%
4. Dublin CSD: -23.3%
5. Hamilton LSD: -21.6%
6. Jefferson LSD: -20.8%
7. Big Walnut LSD: -19.7%
8. Bexley: -17.6%
9. Gahanna: -17.0%
10. Johnstown Monroe LSD: -16.2%
11. Westerville CSD: -14.8%
12. Worthington CSD: -12.5%
13. German Village: -10.5%
14. Grove City: -6.4%
15. Whitehall: -4.9%

Overall Market Median Sales Price % Change January 2012 vs. January 2013: +8.6%

Top 10 Locations with the Most New Listings in January 2013
1. Columbus: 957
2. Columbus CSD: 605
3. South-Western CSD: 210
4. Olentangy LSD: 146
5. Hilliard CSD: 126
6. Westerville CSD: 109
7. Dublin CSD: 94
8. Pickerington LSD: 81
9. Grove City: 66
10. Groveport Madison LSD: 65

Top 10 Locations with the Fewest New Listings in January 2013
1. Valleyview: 1
2. Minerva Park: 1
3. Lithopolis: 2
4. Jefferson LSD: 3
5. Obetz: 6
6. Jonathan Alder LSD: 8
7. Grandview Heights: 9
8. Sunbury: 10
9. Johnstown Monroe LSD: 10
10. Hamilton LSD: 12
11. Whitehall: 15

Total New Listings in the Columbus Metro in January 2013: 2,388
Overall Metro New Listings % Change January 2012-January 2013: -3.7%

This month, prices increased as overall supply slipped.

For more information on the local market, go here: Columbus Realtors