The Columbus metro has never been Ohio’s largest job market, but that seems to be changing over time.
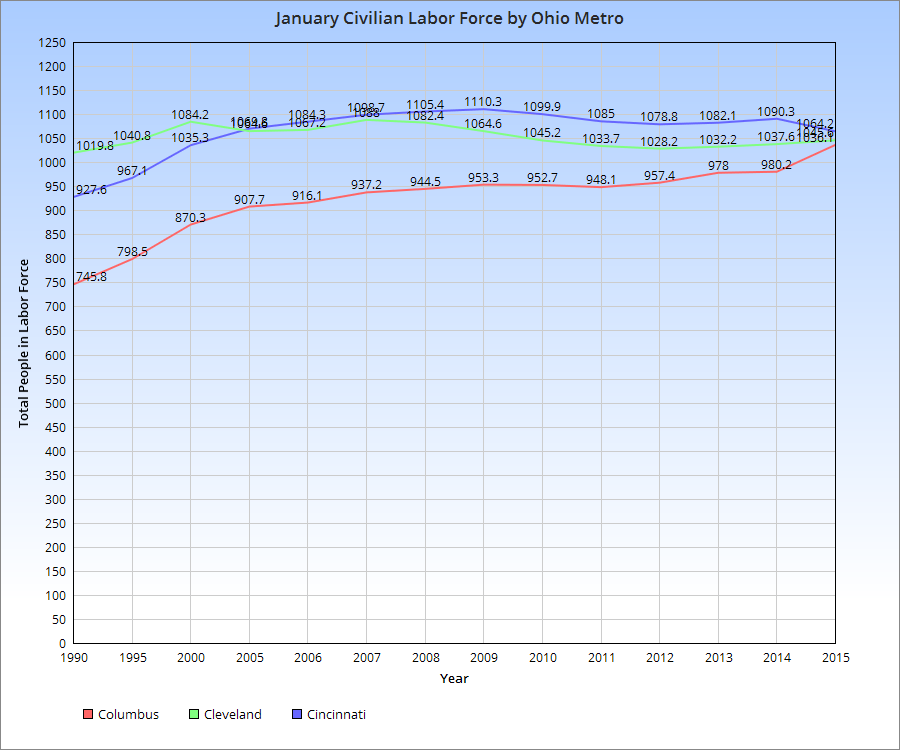
The January 2015 labor force jumped to a record high, and if trends hold, may pass the other 2 Cs by the end of the year.

The Columbus metro has never been Ohio’s largest job market, but that seems to be changing over time.
The January 2015 labor force jumped to a record high, and if trends hold, may pass the other 2 Cs by the end of the year.

The March-May 2014 review continues the look back on a very busy year in and around Columbus.
Development News
March
-Plans were announced to redevelop Poindexter Village with 350 residential units, as well as community center and park space.
http://www.columbusunderground.com/poindexter-plan-calls-for-350-multi-family-units-urban-farm-bw1
-A new brewery announced it would be moving into space on West Town Street in Franklinton.
http://www.bizjournals.com/columbus/blog/2014/03/land-grant-brewing-finally-finds-home.html
-A new 42-unit residential development was announced for Downtown Dublin.
http://www.bizjournals.com/columbus/blog/2014/03/crawford-hoying-planning-42-luxury.html
-101 residential units were proposed for 991 Dennison Avenue in Victorian Village.
http://www.columbusunderground.com/new-five-story-101-unit-apartment-building-proposed-for-victorian-village
-Columbus announced plans to use $2.5 billion to build infrastructure to reduce runoff and pollution issues, including creating water gardens and new parks across the city.
http://www.columbusunderground.com/green-infrastructure-and-neighborhood-pocket-parks-part-of-blueprint-columbus-plan-bw1
-Reeb Elementary on the South Side was announced to be turned into a community center.
http://www.dispatch.com/content/stories/local/2014/03/21/south-side-community-center-gets-go-ahead.html
-New caps, similar to the existing retail cap on High Street over I-670 were announced to be in the works as part of the 70/71 rebuild. The caps would replace the highway bridges on S. High and S. Third between Downtown and German Village.
http://www.columbusunderground.com/caps-planned-for-high-and-third-street-bridges-south-of-downtown-bw1
April
-A vacant 1880s building a 140 N. Grant was announced to be renovated into mixed-use and residential.
http://www.bizjournals.com/columbus/news/2014/04/10/former-inkling-printing-building-on-east-long-to.html
-40 units of affordable housing was proposed for vacant buildings at Long and Front Downtown.
http://www.columbusunderground.com/forums/topic/affordable-housing-development-proposed-at-long-front-downtown
-Plans to renovate the Citizens Building at the southwest corner of Gay and High Downtown were announced, as well as building a new mixed-use building on the northwest corner.
http://www.columbusunderground.com/edwards-communities-contemplates-infill-at-gay-and-high
-Plans were also announced to renovate hundreds of apartments in the Metro West complex behind Westland Mall.
http://www.bizjournals.com/columbus/blog/2014/04/mitt-romney-affiliate-buys-most-of-metro-west.html
May
-The Short North Donatos announced plans to rebuild into a new restaurant with 2nd floor patio and additional spaces for more retail.
http://www.columbusunderground.com/forums/topic/short-north-donatos-demolition-and-new-build
-The Byers Chevrolet site on West Broad Street in Franklinton was purchased by Nationwide Reality for a potential mixed-use project.
http://www.columbusunderground.com/nri-to-redevelop-byers-chevrolet-site-in-franklinton
-Casto announced plans for a 152-unit residential complex overlooking the Scioto River near Hayden Road.
http://www.bizjournals.com/columbus/blog/2014/05/casto-to-build-apartments-overlooking-scioto-river.html
-41 new homes were coming to N. Grant Avenue in Weinland Park.
http://www.bizjournals.com/columbus/blog/2014/05/wagenbrenner-adding-market-rate-homes-in-weinland.html
-A small condo development was proposed for Summit in Italian Village.
http://www.columbusunderground.com/condos-proposed-for-first-and-summit-in-italian-village-bw1
-Children’s Hospital announced plans for 2 new buildings on Livingston Avenue.
http://www.dispatch.com/content/stories/local/2014/05/28/Nationwide-Childrens-Hospital-plans-expansion.html
-The Stoddart Block, a historic residential building, would be renovated into micro apartments.
http://www.columbusunderground.com/forums/topic/stoddart-block-affordable-housing-downtown
Economic News
-Home sales declined in all 3 months of March-May, as demand far outpaced supply.
-The unemployment rate continued to fall to multi-year lows.
http://www.dispatch.com/content/stories/business/2014/05/20/regional-central-ohio-unemployment-falls-april.html
-Columbus was named the 6th most affordable metro in the nation.
http://www.bizjournals.com/columbus/blog/2014/05/ohio-cities-ranked-among-most-affordable-housing.html
Other News
-Columbus’ population was announced to have grown by more than 12,000 people between 2012-2013, and reached a population of 822,553 in 2013.
-Columbus was named one of the top cities for entrepreneurs.
http://www.bizjournals.com/columbus/blog/2014/05/columbus-tops-in-ohio-among-best-cities-for.html
-Columbus was named a top city where people could accomplish their dreams/goals.
http://www.columbusunderground.com/columbus-ranked-6th-on-list-of-american-dream-cities-jb1

May was generally a positive month for Columbus and Ohio according to the latest figures from the Bureau of Labor Statistics. Unemployment rates did creep up a bit, but largely because more people came onto the market looking for jobs, which is considered a positive sign. Also positive is that almost every industry saw decent growth in the metro, as shown below in the May 2014 jobs data.
Columbus City
Unemployment Rate: 4.4%
Unemployment Rate Change since May 2013: -1.7%
Unemployment Rate Change since January 2014: -1.4%
Civilian Labor Force: 435,500
Civilian Labor Force Change since May 2013: -2,000
Civilian Labor Force Change since January 2014: +1,800
Employment: 416,400
Employment Change since May 2013: +5,600
Employment Change since January 2014: +8,000
Unemployment: 19,100
Unemployment Change since May 2013: -7,500
Unemployment Change since January 2014: -6,300
Franklin County
Unemployment Rate: 4.4%
Unemployment Rate Change since May 2013: -1.7%
Unemployment Rate Change since January 2014: -1.5%
Civilian Labor Force: 636,400
Civilian Labor Force Change since May 2013: -2,600
Civilian Labor Force Change since January 2014: +2,800
Employment: 608,300
Employment Change since May 2013: +6,100
Employment Change since January 2014: +11,800
Unemployment: 28,100
Unemployment Change since May 2013: -10,700
Unemployment Change since January 2014: -9,000
Columbus Metro Area
Unemployment Rate: 4.4%
Unemployment Rate Change since May 2013: -1.6%
Unemployment Rate Change since January 2014: -1.6%
Civilian Labor Force: 982,412
Civilian Labor Force Change since May 2013: -4,512
Civilian Labor Force Change since January 2014: +2,216
Employment: 939,332
Employment Change since May 2013: +12,108
Employment Change since January 2014: +17,688
Unemployment: 43,080
Unemployment Change since May 2013: -16,620
Unemployment Change since January 2014: -15,472
Ohio Overall
Unemployment Rate: 5.5%
Unemployment Rate Change since May 2013: -1.9%
Unemployment Rate Change since January 2014 : -1.4%
Civilian Labor Force: 5,721,891
Civilian Labor Force Change since May 2013: -48,893
Civilian Labor Force Change since January 2014: -41,237
Employment: 5,406,014
Employment Change since May 2013: +60,405
Employment Change since January 2014: +38,259
Unemployment: 315,877
Unemployment Change since May 2013: -109,298
Unemployment Change since January 2014: -79,496
Metro Non-Farm Jobs
Total: 995,600
Change from May 2013: +11,100
Change from January 2014: +29,800
By Industry
Mining/Logging/Construction Total: 33,700
Change from May 2013: +1,900
Change from January 2014: +4,400
Manufacturing Total: 67,700
Change from May 2013: -100
Change from January 2014: +1,700
Trade/Transportation/Utilities Total: 187,900
Change from May, 2013: +3,900
Change from January 2014: +1,500
Information Total: 18,100
Change from May 2013: +100
Change from January 2014: +0
Financial Activities Total: 73,500
Change from May 2013: -2,000
Change from January 2014: -300
Professional and Business Services Total: 162,500
Change from May 2013: -700
Change from January 2014: +4,100
Education and Health Services Total: 142,500
Change from May 2013: +2,800
Change from January 2014: +5,300
Leisure and Hospitality Total: 103,00
Change from May 2013: +1,800
Change from January 2014: +9,100
Other Services Total: 38,900
Change from May 2013: +900
Change from January 2014: +600
Government Total: 167,800
Change from May 2013: +2,500
Change from January 2014: +3,400

I haven’t given jobs data for awhile and thought it was time to update, so here is the April 2014 jobs data report. Overall, there was more good than bad with the report. Unemployment was well below the national average and falling rapidly. Employment was up and unemployment was down. The only real negative was that the labor force remained stagnant to down a bit. All data comes from the Bureau of Labor Statistics
Columbus City
Unemployment Rate: 4.3%
Unemployment Rate Change since April 2013: -1.6%
Unemployment Rate Change since January 2014: -1.5%
Civilian Labor Force: 432,300
Civilian Labor Force Change since April 2013: -1,400
Civilian Labor Force Change since January 2014: -1,400
Employment: 414,000
Employment Change since April 2013: +5,800
Employment Change since January 2014: +5,600
Unemployment: 18,400
Unemployment Change since April 2013: -7,100
Unemployment Change since January 2014: -7,000
Franklin County
Unemployment Rate: 4.3%
Unemployment Rate Change since April 2013: -1.6%
Unemployment Rate Change since January 2014: -1.6%
Civilian Labor Force: 631,700
Civilian Labor Force Change since April 2013: -1,700
Civilian Labor Force Change since January 2014: -1,900
Employment: 604,700
Employment Change since April 2013: +8,400
Employment Change since January 2014: +8,200
Unemployment: 27,000
Unemployment Change since April 2013: -10,100
Unemployment Change since January 2014: -10,100
Columbus Metro Area
Unemployment Rate: 4.3%
Unemployment Rate Change since April 2013: -1.6%
Unemployment Rate Change since January 2014: -1.7%
Civilian Labor Force: 976,173
Civilian Labor Force Change since April 2013: -2,530
Civilian Labor Force Change since January 2014: -4,023
Employment: 934,261
Employment Change since April 2013: +13,053
Employment Change since January 2014: +12,617
Unemployment: 41,912
Unemployment Change since April 2013: -15,583
Unemployment Change since January 2014: -16,640
Ohio Overall
Unemployment Rate: 5.7
Unemployment Rate Change since April 2013: -1.6%
Unemployment Rate Change since January 2014 : -1.2%
Civilian Labor Force: 5,741,473
Civilian Labor Force Change since April 2013: -27,006
Civilian Labor Force Change since January 2014: -21,655
Employment: 5,413,615
Employment Change since April 2013: +67,409
Employment Change since January 2014: +45,860
Unemployment: 327,858
Unemployment Change since April 2013: -94,415
Unemployment Change since January 2014: -67,515
Metro Non-Farm Jobs
Total: 982,500
Change from April 2013: +8,600
Change from January 2014: +16,700
By Industry
Mining/Logging/Construction Total: 32,200
Change from April 2013: +2,100
Change from January 2014: +2,900
Manufacturing Total: 67,700
Change from April 2013: +0
Change from January 2014: +1,700
Trade/Transportation/Utilities Total: 185,400
Change from April 2013: +2,900
Change from January 2014: -1,000
Information Total: 18,100
Change from April 2013: +0
Change from January 2014: +0
Financial Activities Total: 73,800
Change from April 2013: -1,100
Change from January 2014: +0
Professional and Business Services Total: 160,400
Change from April 2013: -1,800
Change from January 2014: +2,000
Education and Health Services Total: 140,600
Change from April 2013: +900
Change from January 2014: +3,400
Leisure and Hospitality Total: 99,400
Change from April 2013: +1,800
Change from January 2014: +5,500
Other Services Total: 38,400
Change from April 2013: +600
Change from January 2014: +100
Government Total: 166,500
Change from April 2013: +2,200
Change from January 2014: +2,100
May’s preliminary numbers look very good, and when those are fully released, I will do another report.

October and November 2013 jobs data comes from the Bureau of Labor Statistics. The data includes up-to-date employment and unemployment figures.
October 2013
Columbus City
Unemployment Rate: 6.2%
Unemployment Rate Change since October 2012: +0.6%
Unemployment Rate Change since January 2013: -0.6%
Civilian Labor Force: 430,800
Civilian Labor Force Change since October 2012: +1,300
Civilian Labor Force Change since January 2013: +4,400
Employment: 404,000
Employment Change since October 2012: -1,600
Employment Change since January 2013: +6,700
Unemployment: 26,800
Unemployment Change since October 2012: +2,900
Unemployment Change since January 2013: -2,300
Franklin County
Unemployment Rate: 6.2%
Unemployment Rate Change since October 2012: +0.6%
Unemployment Rate Change since January 2013: -0.6%
Civilian Labor Force: 630,000
Civilian Labor Force Change since October 2012: +1,700
Civilian Labor Force Change since January 2013: +6,300
Employment: 590,900
Employment Change since October 2012: -2,400
Employment Change since January 2013: +9,900
Unemployment: 39,200
Unemployment Change since October 2012: +4,200
Unemployment Change since January 2013: -3,400
Columbus Metro Area
Unemployment Rate: 6.1%
Unemployment Rate Change since October 2012: +0.6%
Unemployment Rate Change since January 2013: -0.9%
Civilian Labor Force: 975,506
Civilian Labor Force Change since October 2012: +2,253
Civilian Labor Force Change since January 2013: +7,601
Employment: 915,686
Employment Change since October 2012: -3,699
Employment Change since January 2013: +15,230
Unemployment: 59,820
Unemployment Change since October 2012: +5,952
Unemployment Change since January 2013: -7,629
Ohio Overall
Unemployment Rate: 7.5%
Unemployment Rate Change since October 2012: +0.6%
Unemployment Rate Change since January 2013 : +0.5%
Civilian Labor Force: 5,727,346
Civilian Labor Force Change since October 2012: -2,337
Civilian Labor Force Change since January 2013: -12,946
Employment: 5,300,458
Employment Change since October 2012: -33,230
Employment Change since January 2013: -40,394
Unemployment: 426,888
Unemployment Change since October 2012: +30,893
Unemployment Change since January 2013: +27,448
Metro Non-Farm Jobs
Total: 969,600
Change from October 2012: +9,600
Change from January 2013: +26,000
By Industry
Mining/Logging/Construction Total: 31,800
Change from October 2012: +1,200
Change from January 2013: +4,900
Manufacturing Total: 66,200
Change from October 2012: +700
Change from January 2013: +1,200
Trade/Transportation/Utilities Total: 184,500
Change from October 2012: +1,800
Change from January 2013: +1,300
Information Total: 16,100
Change from October 2012: -300
Change from January 2013: -400
Financial Activities Total: 72,400
Change from October 2012: +1,000
Change from January 2013: +700
Professional and Business Services Total: 161,800
Change from October 2012: +700
Change from January 2013: +6,200
Education and Health Services Total: 141,500
Change from October 2012: +3,500
Change from January 2013: +2,000
Leisure and Hospitality Total: 98,300
Change from October 2012: +3,400
Change from January 2013: +9,800
Other Services Total: 35,800
Change from October 2012: -1,500
Change from January 2013: -400
Government Total: 161,200
Change from October 2012: -900
Change from January 2013: +700
November 2013
Columbus City
Unemployment Rate: 6.1%
Unemployment Rate Change since November 2012: +0.7%
Unemployment Rate Change since January 2013: -0.7%
Civilian Labor Force: 433,700
Civilian Labor Force Change since November 2012: +4,500
Civilian Labor Force Change since January 2013: +7,300
Employment: 407,100
Employment Change since November 2012: +1,000
Employment Change since January 2013: +9,800
Unemployment: 26,600
Unemployment Change since November 2012: +3,500
Unemployment Change since January 2013: -2,500
Franklin County
Unemployment Rate: 6.1%
Unemployment Rate Change since November 2012: +0.7%
Unemployment Rate Change since January 2013: -0.7%
Civilian Labor Force: 634,400
Civilian Labor Force Change since November 2012: +6,800
Civilian Labor Force Change since January 2013: +10,700
Employment: 595,400
Employment Change since November 2012: +1,400
Employment Change since January 2013: +14,400
Unemployment: 39,000
Unemployment Change since November 2012: +5,400
Unemployment Change since January 2013: -3,600
Columbus Metro Area
Unemployment Rate: 6.1%
Unemployment Rate Change since November 2012: +0.8%
Unemployment Rate Change since January 2013: -0.9%
Civilian Labor Force: 981,927
Civilian Labor Force Change since November 2012: +9,454
Civilian Labor Force Change since January 2013: +14,022
Employment: 921,937
Employment Change since November 2012: +1,470
Employment Change since January 2013: +21,481
Unemployment: 59,990
Unemployment Change since November 2012: +7,984
Unemployment Change since January 2013: -7,459
Ohio Overall
Unemployment Rate: 7.4%
Unemployment Rate Change since November 2012: +0.6%
Unemployment Rate Change since January 2013 : +0.4%
Civilian Labor Force: 5,734,909
Civilian Labor Force Change since November 2012: +6,424
Civilian Labor Force Change since January 2013: -5,383
Employment: 5,307,912
Employment Change since November 2012: -30,979
Employment Change since January 2013: -32,940
Unemployment: 426,997
Unemployment Change since November 2012: +37,403
Unemployment Change since January 2013: +27,557
Metro Non-Farm Jobs
Total: 975,000
Change from November 2012: +9,000
Change from January 2013: +31,400
By Industry
Mining/Logging/Construction Total: 32,300
Change from November 2012: +1,900
Change from January 2013: +5,400
Manufacturing Total: 66,000
Change from November 2012: +300
Change from January 2013: +1,000
Trade/Transportation/Utilities Total: 189,200
Change from November 2012: -700
Change from January 2013: +6,000
Information Total: 16,200
Change from November 2012: -300
Change from January 2013: -300
Financial Activities Total: 72,100
Change from November 2012: -500
Change from January 2013: +400
Professional and Business Services Total: 161,800
Change from October 2012: +700
Change from January 2013: +6,200
Education and Health Services Total: 143,700
Change from November 2012: +4,700
Change from January 2013: +4,200
Leisure and Hospitality Total: 95,600
Change from November 2012: +2,700
Change from January 2013: +7,100
Other Services Total: 35,800
Change from November 2012: -800
Change from January 2013: -400
Government Total: 162,600
Change from November 2012: -900
Change from January 2013: +2,100