2013 Census Tract Estimates


The Census released updated 2013 census tract estimates, and they showed some interesting things. There are 285 census tracts that make up Franklin County.

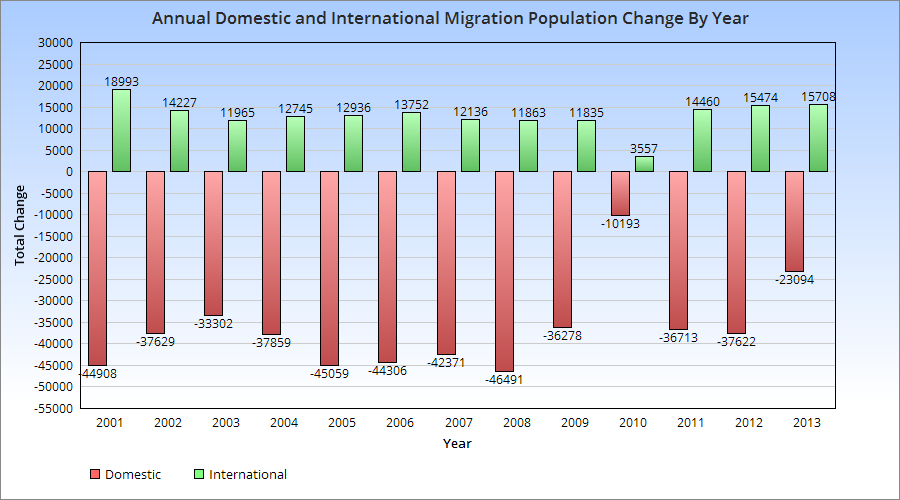
First, let’s take a look at the Franklin County trends 2000-2013.
2013 census tract estimates

In regards to the above map, it’s a mix of both the 2013 official estimates and some that I did. For example, the official estimates had the Downtown tracts 30 and 40 losing population, as well as most of the Short North. That’s rather absurd considering the level of residential construction in these areas, as well as population estimates the city has done in the last few years for Downtown. In fact, the 2013 official estimates have Downtown tract population BELOW 2010. That’s just not the reality. So I looked over the tracts and adjusted them according to their long-term growth/decline trends. Most of them I left alone, but some adjustments had to be made. However, I was very conservative with any changes, and several tracts that the official estimates showed gains, I actually had losses.

Here are all the tracts that grew by at least 300 people between 2010 and 2013 in Franklin County, as well as their locations.
Blacklick #7395: +1,609
Dublin #6230: +1,214
Columbus-West Side #7951: +1,002
Columbus-Northwest #6372: +966
Columbus Northeast #6931: +963
Hilliard #7921: +955
Columbus-East Side #9361: +952
Columbus-West Side #8350: +951
Columbus-Northwest: #6384: +949
Dublin #6220: +933
Columbus-West Side #8141: +921
Columbus-Easton #7551: +793
Columbus-Southeast #9373: +749
Hilliard #7933: +688
Minerva Park #7112: +675
Columbus-South Side #8340: +652
Hilliard #7954: +643
Columbus North Side #7044: +636
Columbus Northeast #7132: +615
Columbus Northwest #6396: +557
Dublin #6386: +549
Columbus North Side #6921: +540
Columbus Northwest #6393: +492
Columbus-West Side: +489
Gahanna #7492: +473
New Albany #7209: +472
Columbus-Hilltop #8321: +466
Columbus-Southeast #9374: +455
Grove City #9740: +441
Columbus Northeast #6945: +438
Hillard #7931: +432
Columbus-West Side #7812: +427
Columbus-South Side #9590: +411
Columbus-South Side #8710: +407
Hilliard #10602: +407
Columbus-South Side #8822: +403
Whitehall #9230: +398
Columbus-West Side #8163: +397
Columbus-East Side #9362: +389
Columbus-Downtown #30: +387
Hilliard #7953: +382
Columbus-West Side #6330: +371
Columbus-Northwest #6387: +361
Columbus-East Side #9322: +352
Columbus-South Side #8825: +349
Columbus-Southwest #8161: +346
West Side-Marble Cliff #43: +345
Columbus-Southwest #8370: +340
Grandview #85: +332
Columbus-Downtown #40: +321
Hilliard #7922: +320
Dublin #6371: +312
Grove City #9751: +304
Columbus-Campus Area #13: +303

As far as the core of the city, the 1950 boundaries, here are the results.

There are 78 tracts that make up the original 1950 city boundary. Using the official estimates, 38 of the 78 tracts grew between 2010-2013, yet had a total loss of 3,229. However, again, it had all the Downtown and adjacent tracts inexplicably losing population, yet the opposite is occurring in these areas. For Downtown, the combined loss was about 370, and for the Short North, it had the loss at more than 700.

Using my adjusted estimates, 35 tracts are growing, adding 1,166 people 2010-2013. Most of the gains were made in the Downtown and adjacent tracts, and some of the losses were simply not as steep. For example, the official estimates had tract #10, in the Campus area, losing nearly 1,300 people since 2010, which is a ridiculous loss, especially considering it grew by almost 8% 2000-2010. In fact, most of the largest losses from the official estimates were around Campus and the Short North. Nonsense.

2013 Ohio County Population Estimates


Along with the metro estimates, the latest 2013 Ohio county population estimates were released on Thursday by the US Census.

Here are the statewide county maps for recent estimate years as well as previous decades, just to show how growth patterns have been changing.
2013 Ohio county population estimates


Top 10 Largest Counties
1. Cuyahoga: 1,263,154
2. Franklin: 1,212,263
3. Hamilton: 804,520
4. Summit: 541,824
5. Montgomery: 535,846
6. Lucas: 436,393
7. Stark: 375,432
8. Butler: 371,272
9. Lorain: 302,827
10. Mahoning: 233,869

Top 10 Counties with the Largest Numerical Change 2012-2013
1. Franklin: +16,193
2. Delaware: +3,791
3. Hamilton: +2,004
4. Warren: +1,859
5. Fairfield: +1,358
6. Lorain: +1,230
7. Medina: +1,190
8. Clermont: +1,190
9. Summit: +718
10. Licking: +660


Ohio’s Improving Growth Outlook


Back in November, I wrote about Ohio’s improving growth outlook. In that post, I examined domestic out-migration and domestic in-migration 2005-2012, and discovered that the net change had been improving. The state was losing fewer people over time domestically, and the difference had declined to under 2,000 people by 2012, a HUGE improvement from the start of the period.

Recently, the US Census released 2013 state population estimates, along with components of population change for the July 1st, 2012-July 1st, 2013 period. More positive news was to be found in those estimates.

First, Ohio’s population increased to 11,570,808, representing an annual increase of 17,777. While the increase is not particularly great, especially in comparison to states nationally, there are some positive nuggets with that number. The state held on to its position as the 7th most populous state, and the increase was the highest since pre-recession. The state moved up 18 spots in the total annual growth rankings 2012-2013 vs. 2011-2012. This was the best increase of all 50 states. It was also the best growth for the state since 2007.

Did the state bottom out in 2012? Perhaps, but way too early to tell. Still, a very good improvement that halted a general decline.

The components of change are also interesting.

The migration patterns show a few things. First, 2013 had the 2nd highest rate since 2000 of in-international migration. It was also one of the best years (since 1996) for domestic in-migration.

The question is, can Ohio keep improving or is this just a temporary blip? Time will tell.


Franklin County Home Values and Gentrification

Home values are, in part, tied to how well a neighborhood is performing. In the case of urban neighborhoods, how home values change over time may be a good indication of how that neighborhood is revitalizing. I looked at median home values by census tract for the years 2000 and 2010. Here is the map of how values changed during that period.
Franklin County home values
What the different colors indicate are different levels of performance, obviously. Yellow and oranges indicate decline, which few areas experienced. Light green, which makes up quite a bit of the suburban areas in and outside 270, indicates mostly stability or slow growth (but below average) in home values. Dark green is average to a bit above average growth. Blues and purple are high growth areas.

What the map shows it that the strongest growth in median home values occurred in the urban core neighborhoods, especially along the High Street corridor. Pockets of strong growth also occurred around Easton and sporadically in some suburban areas. What this says, particularly for the urban core, is that quite a few neighborhoods are on the rise. Grandview, Upper Arlington, the Short North, Campus, Clintonville, German and Merion Villages, the western half of Weinland Park, Downtown, and the Near East Side around Franklin Park were some of the best performing areas. This would seem to indicate that strong gentrification is taking place.