I saw this post the other day about changing neighborhood demographics in certain cities, particularly when it comes to racial segregation and gentrification. Surprisingly, of all the maps and posts I’ve done on demographics, I hadn’t thought to do one like this. Well, now I have, so here are Franklin County’s gentrification trends 1990-2014. A bit of an explanation is needed for the color coding: -For those categories marked “Steady”, the demographic listed has been the majority throughout the period, with little to no change of other demographics. -For those mixed categories of one decline and one rise, it means that the majority demographic has declined at least 5%, while a secondary demographic has risen at least 5%. -For the category of recent or steady integration, there are at least 2 demographics at 10% or more of the total population, as well as a 3rd demographic reaching at least 5% of the population.
A few things that stand out to me is that the Steady White population dominates at least 50% of the map, while there are very few areas with Steady Black population. One would be tempted to suggest that gentrification is forcing the Black population out of neighborhoods, but this doesn’t seem to be true. In terms of significant changes, there are FAR more areas with Black population growth and White population decline than vice-versa, suggesting that “White Flight” may continue to be an issue. Also, a surprising number of areas have reached full integration, or have at least been maintaining it over the period of question. These neighborhoods of demographic equilibrium are largely the result of increasing Hispanic and Asian populations, particularly on the Northeast and West Sides, as well as the Whitehall area. In the center core, almost all of the High Street corridor has remained steady White, suggesting that other demographics have, so far, been unable to tap into the building boom along and adjacent to this corridor.
Here are the most integrated tracts by year, based the above criteria. 1990 1. #8720- South Side 2. #7820- Riverview-NW Side 3. #1122- West Campus 4. #1121- Campus 5. #29- King-Lincoln Only 5 tracts counted as being integrated in 1990.
The first part of this comparison of young professionals and the city, seen here, seemed to be well-received, so I wanted to expand the examination of the 25-34 age group. In the first post, I just compared growth of this population by Columbus’ peers, but let’s take a closer look at this group through educational attainment. I will use the same 33 cities I used in the first post.
Educational Attainment 2014 Rank by City of Bachelors Degree or Higher within 25-34 Population 1. Chicago: 268,470 2. Austin: 97,721 3. Columbus: 75,305 4. San Jose: 68,392 5. Charlotte: 63,132 6. San Antonio: 62,572 7. Portland: 60,259 8. Minneapolis: 51,043 9. Indianapolis: 48,188 10. Pittsburgh: 35,860 11. Kansas City: 32,101 12. Madison: 30,039 13. Milwaukee: 29,661 14. Omaha: 28,984 15. St. Louis: 28,946 16. Sacramento: 27,304 17. Cincinnati: 25,496 18. St. Paul: 22,929 19. Virginia Beach: 22,134 20. Orlando: 20,181 21. Wichita: 19,659 22. Las Vegas: 17,817 23. Lincoln: 16,429 24. Grand Rapids: 15,724 25. Detroit: 14,285 26. Fort Wayne: 12,228 27. Cleveland: 12,013 28. Des Moines: 10,089 29. Providence: 10,432 30. Toledo: 8,514 31. Akron: 6,600 32. Dayton: 4,029 33. Youngstown: 1,084
Columbus has the 3rd highest total of 25-34-year-olds with at least a bachelor’s degree, even compared to some cities with larger populations in the city or metro area. This is likely due to the high number of colleges and universities in the area, not least of which includes Ohio State.
2014 % of Total 25-34 Age Group with Bachelors or Higher 1. Madison: 67.0% 2. Pittsburgh: 57.4% 3. Minneapolis: 56.3% 4. Portland: 51.5% 5. Chicago: 51.1% 6. Austin: 48.9% 7. Cincinnati: 47.0% 8. St. Louis: 46.9% 9. Charlotte: 44.5% 10. San Jose: 44.5% 11. Columbus: 44.1% 12. St. Paul: 42.1% 13. Lincoln: 41.0% 14. Omaha: 40.8% 15. Grand Rapids: 40.5% 16. Kansas City: 40.5% 17. Orlando: 37.1% 18. Indianapolis: 34.3% 19. Wichita: 33.7% 20. Providence: 32.7% 21. Sacramento: 32.5% 22. Fort Wayne: 32.4% 23. Des Moines: 29.8% 24. Milwaukee: 29.6% 25. Virginia Beach: 29.3% 26. San Antonio: 27.6% 27. Akron: 23.4% 28. Cleveland: 21.4% 29. Las Vegas: 19.7% 30. Toledo: 19.5% 31. Dayton: 19.1% 32. Detroit: 15.9% 33. Youngstown: 12.8%
While just outside of the top 10 in the peer group, Columbus still performs in the top 1/3rd when it comes to the % of 25-34-year-olds that have at least a bachelor’s degree.
2000-2014 Total Change in Age 25-34 with a Bachelor’s Degree or Higher 1. Chicago: +78,514 2. Austin: +38,348 3. Portland: +26,042 4. San Antonio: +23,504 5. Columbus: +21,601 6. Charlotte: +19,149 7. Pittsburgh: +19,060 8. Minneapolis: +15,629 9. St. Louis: +14,538 10. San Jose: +13,372 11. Sacramento: +11,530 12. Kansas City: +10,499 13. Madison: +8,774 14. Orlando: +8,600 15. Omaha: +8,521 16. Indianapolis: +8,369 17. Milwaukee: +7,031 18. Grand Rapids: +6,275 19. Wichita: +6,049 20. Fort Wayne: +5,350 21. Cincinnati: +5,083 22. Las Vegas: +4,433 23. St. Paul: +4,316 24. Virginia Beach: +4,167 25. Lincoln: +3,450 26. Providence: +2,488 27. Des Moines: +806 28. Dayton: +59 29. Youngstown: -108 30. Cleveland: -522 31. Akron: -628 32. Detroit: -1,471 33. Toledo: -1,639
Another great showing is in the total growth of 25-34-year-olds with at least a bachelor’s degree. Again, Columbus is outperforming several larger cities/metros on the list.
2000-2014 Total % Change in Age 25-34 with a Bachelor’s Degree or Higher 1. Pittsburgh: +113.45% 2. St. Louis: +100.90% 3. Fort Wayne: +77.78% 4. Portland: +76.11% 5. Orlando: +74.26% 6. Sacramento: +73.09% 7. Grand Rapids: +66.41% 8. Austin: +64.59% 9. San Antonio: +60.16% 10. Kansas City: +48.60% 11. Wichita: +44.45% 12. Minneapolis: +44.13% 13. Charlotte: +43.54% 14. Omaha: +41.64% 15. Chicago: +41.33% 16. Madison: +41.26% 17. Columbus: +40.22% 18. Las Vegas: +33.12% 19. Providence: +31.32% 20. Milwaukee: +31.07% 21. Lincoln: +26.58% 22. Cincinnati: +24.90% 23. San Jose: +24.30% 24. St. Paul: +23.19% 25. Virginia Beach: +23.19% 26. Indianapolis: +21.02% 27. Des Moines: +8.68% 28. Dayton: +1.49% 29. Cleveland: -4.16% 30. Akron: -8.69% 31. Youngstown: -9.06% 32. Detroit: -9.34% 33. Toledo: -16.14%
So in Part 1, it was shown that Columbus had one of the fastest growing 25-34 populations. These numbers show that it also has one of the largest age 25-34 populations with a Bachelor’s degree or higher in terms of totals, and one of the fastest growing in terms of totals. By %, however, it performs a bit worse, but part of the reason for that is because so many of these cities started with relatively low educated populations to begin with. Overall, Columbus seems to be very attractive, not only to this age group, but also for those within the group that are highly educated.
Millennials- those born roughly between 1981 and 2001- are big news these days. They are the largest generation ever in terms of total numbers (exceeding 76 million), and their choices are already having big impacts on everything from housing to the economy. I wanted to look at Columbus and its peers to see where it ranks in terms of attracting these young professionals.
For the comparison, I looked at metro areas of 1.5-2.5 million as well as major Midwest metros and then used their core cities to get the numbers. I used the age group of 25-34 specifically, as that is usually the number most often cited in the news.
Rank of Total Population Aged 25-34 2005_______________________2010___________________2014 1. Chicago: 463,236_______1. Chicago: 510,042_______1. Chicago: 525,381 2. San Antonio: 180,981_____2. San Antonio: 200,645____2. San Antonio: 226,711 3. Austin: 137,523_________3. Austin: 162,247_________3. Austin: 199,838 4. San Jose, CA: 133,144___4. Columbus: 147,584______4. Columbus: 170,759 5. Columbus: 131,641______5. San Jose, CA: 142,551___5. San Jose, CA: 153,690 6. Indianapolis: 114,532_____6. Indianapolis: 133,088____6. Charlotte, NC: 141,869 7. Detroit: 110,759_________7. Charlotte, NC: 127,539___7. Indianapolis: 140,491 8. Charlotte, NC: 100,025____8. Portland, OR: 113,210___8. Portland, OR: 116,109 9. Portland, OR: 90,023_____9. Milwaukee: 97,359______9. Milwaukee: 100,205 10. Las Vegas: 84,418______10. Detroit: 85,023________10. Minneapolis: 90,662 11. Milwaukee: 82,060______11. Minneapolis: 81,532____11. Las Vegas: 90,441 12. Sacramento, CA: 75,497___12. Las Vegas: 81,212____12. Detroit: 89,843 13. Minneapolis: 74,208___13. Sacramento, CA: 78,527__13. Sacramento, CA: 84,013 14. Kansas City, MO: 68,060__14. Kansas City: 73,872__14. Kansas City, MO: 79,262 15. Virginia Beach: 60,749__15. Virginia Beach: 67,614__15. Virginia Beach: 75,543 16. Omaha, NE: 56,248____16. Omaha, NE: 62,396_____16. Omaha, NE: 71,040 17. Wichita, KS: 52,426____17. St. Louis: 57,627_______17. Pittsburgh: 62,473 18. Cleveland: 50,558_____18. Wichita, KS: 56,737_____18. St. Louis: 61,718 19. St. Louis: 48,137______19. Cleveland: 54,428______19. Wichita, KS: 58,334 20. Cincinnati: 44,945_____20. Pittsburgh: 51,109______20. Cleveland: 56,134 21. Toledo: 43,134_______21. St. Paul, MN: 50,107_____21. St. Paul, MN: 54,464 22. Orlando: 40,846______22. Cincinnati: 49,067_______22. Orlando: 54,395 23. St. Paul, MN: 39,676__23. Orlando: 48,102________23. Cincinnati: 54,247 24. Lincoln, NE: 38,893___24. Madison, WI: 44,662_____24. Madison, WI: 44,835 25. Madison, WI: 38,826___25. Lincoln, NE: 42,034_____25. Toledo: 43,661 26. Pittsburgh: 38,744____26. Toledo: 41,580_________26. Lincoln, NE: 40,071 27. Grand Rapids: 35,287__27. Fort Wayne, IN: 35,193__27: Grand Rapids: 38,922 28. Des Moines: 32,640__28. Providence, RI: 31,044__28. Fort Wayne, IN: 37,741 29. Fort Wayne, IN: 31,738__29. Grand Rapids: 30,963__29. Des Moines: 33,857 30. Akron: 30,436_______30. Des Moines: 30,376_____30. Providence, RI: 31,902 31. Providence, RI: 29,307__31. Akron: 27,446________31. Akron: 28,207 32. Dayton: 18,591_______32. Dayton: 20,278________32. Dayton: 21,096 33. Youngstown: 8,505____33. Youngstown: 8,484_____33. Youngstown: 8,468
So Columbus ranks highly among total population in the 25-34 age group. But what about growth?
Total Growth Rank in 25-34 Population 2005-2014 1. Austin, TX: 62,315 2. Chicago: 62,145 3. San Antonio, TX: 45,730 4. Charlotte, NC: 41,844 5. Columbus: 39,118 6. Portland, OR: 26,086 7. Indianapolis: 25,959 8. Pittsburgh: 23,729 9. San Jose, CA: 20,546 10. Milwaukee, WI: 18,145 11. Minneapolis, MN: 16,454 12. Virginia Beach, VA: 14,794 13. St. Paul, MN: 14,788 14. Omaha, NE: 14,612 15. St. Louis, MO: 13,581 16. Orlando, FL: 13,549 17. Kansas City, MO: 11,202 18. Cincinnati: 9,302 19. Sacramento, CA: 8,516 20. Las Vegas, NV: 6,023 21. Madison, WI: 6,009 22. Fort Wayne, IN: 6,003 23. Wichita, KS: 5,908 24. Cleveland: 5,576 25. Grand Rapids, MI: 3,635 26. Providence, RI: 2,595 27. Dayton: 2,505 28. Des Moines, IA: 1,217 29. Lincoln, NE: 1,178 30. Toledo: 527 31. Youngstown: -37 32. Akron: -2,229 33. Detroit: -20,736
Again, Columbus ranks near the top during this period. What about more recently, since 2010?
Total Growth Rank of 25-34 Population 2010-2014 1. Austin: 37,591 2. San Antonio: 26,066 3. Columbus: 23,175 4. Chicago: 15,339 5. Charlotte: 14,330 6. Pittsburgh: 11,364 7. San Jose: 11,139 8. Las Vegas: 9,229 9. Minneapolis: 9,130 10. Omaha: 8,644 11. Grand Rapids: 7,959 12. Virginia Beach: 7,929 13. Indianapolis: 7,403 14. Orlando: 6,293 15. Sacramento: 5,486 16. Kansas City: 5,390 17. Cincinnati: 5,180 18. Detroit: 4,820 19. St. Paul: 4,357 20. St. Louis: 4,091 21. Des Moines: 3,481 22. Portland: 2,899 23. Milwaukee: 2,846 24. Fort Wayne: 2,548 25. Toledo: 2,081 26. Cleveland: 1,706 27. Wichita: 1,597 28. Providence: 858 29. Dayton: 818 30. Akron: 761 31. Madison: 173 32. Youngstown: -16 33. Lincoln: -1,963
So Columbus is doing even better since 2010 than it did in the earlier period and attracts significantly more Millennials in the 25-34 age group than cities often cited for this very metric.
Next, let’s look at percentage growth, as city size can affect this.
Total Percent Growth 2005-2014 in 25-34 Population 1. Pittsburgh: +61.25% 2. Austin: +45.31% 3. Charlotte: +41.83% 4. St. Paul: +37.27% 5. Orlando: +33.17% 6. Columbus: +29.72% 7. Portland: +28.98% 8. St. Louis: +28.21% 9. Omaha: +25.89% 10. San Antonio: +25.27% 11. Virginia Beach: +24.35% 12. Indianapolis: +22.67% 13. Minneapolis: +22.17% 14. Milwaukee: +22.11% 15. Cincinnati: +20.70% 16. Fort Wayne: +18.91% 17. Kansas City: +16.46% 18. Madison: +15.48% 19. San Jose: +15.43% 20. Dayton: +13.47% 21. Chicago: +13.42% 22. Sacramento: +11.28% 23. Wichita: +11.27% 24. Cleveland: +11.03% 25. Grand Rapids: +10.30% 26. Providence: +8.85% 27. Las Vegas: +7.13% 28. Des Moines: +3.73% 29. Lincoln: +3.03% 30. Toledo: +1.22% 31. Youngstown: -0.44% 32. Akron: -7.32% 33. Detroit: -18.75%
So Columbus again performs well in percentage growth, despite having one of the largest populations in the age group. It performs even better in the period since 2010, coming in at 3rd place.
Finally, now that we know the totals and the growth, what is the % of total city population that the 25-34 age group makes up?
25-34 % of Total City Population 2014 1. Minneapolis: 22.27% 2. Austin: 21.89% 3. Orlando: 20.73% 4. Pittsburgh: 20.45% 5. Columbus: 20.42% 6. Grand Rapids: 20.08% 7. St. Louis: 19.44% 8. Chicago: 19.30% 9. Portland: 18.74% 10. St. Paul: 18.30% 11. Madison: 18.25% 12. Cincinnati: 18.19% 13. Providence: 17.81% 14. Charlotte: 17.52% 15. Sacramento: 17.32% 16. Kansas City: 16.84% 17. Virginia Beach: 16.75% 18. Milwaukee: 16.71% 19. Indianapolis: 16.50% 20. Des Moines: 16.19% 21. Omaha: 15.91% 22. San Antonio: 15.78% 23. Toledo: 15.54% 24. San Jose: 15.13% 25. Wichita: 15.02% 26. Dayton: 14.96% 27. Fort Wayne: 14.74% 28. Las Vegas: 14.74% 29. Lincoln: 14.68% 30. Cleveland: 14.41% 31. Akron: 14.26% 32. Detroit: 13.21% 33. Youngstown: 13.02%
And here’s a simple % of population projection for just 4 years from now, 2018, provided the 25-34 population grows the same between 2014-2018 as it did 2010-2014. 1. Pittsburgh: 24.18% 2. Grand Rapids: 23.71% 3. Austin: 23.38% 4. Minneapolis: 23.27% 5. Columbus: 22.16% 6. Orlando: 21.34% 7. St. Louis: 20.82% 8. Cincinnati: 19.85% 9. Chicago: 19.70% 10. St. Paul: 19.05% 11. Providence: 18.20% 12. Portland: 18.14% 13. Virginia Beach: 18.1% 14. Sacramento: 17.84% 15. Charlotte: 17.67% 16. Kansas City: 17.64% 17. Des Moines: 17.50% 18. Madison: 17.40% 19. Milwaukee: 17.07% 20. Indianapolis: 16.85% 21. Omaha: 16.61% 22. Toledo: 16.59% 23. San Antonio: 16.52% 24. Fort Wayne: 15.61% 25. Las Vegas: 15.59% 26. Dayton: 15.27% 27. San Jose: 15.24% 28. Wichita: 15.23% 29. Cleveland: 15.08% 30. Akron: 14.73% 31. Detroit: 14.48% 32. Youngstown: 13.35% 33. Lincoln: 13.13%
Columbus has an existing large population of the 25-34 age demographic, and looks to be one of the strongest performers into the near future. Some would ask why that would be considering that Columbus transit is woefully lacking and has a reputation (very undeservedly, in my opinion) of being suburban- characteristics that Millennials supposedly almost universally reject. Perhaps the bottom line is that economics trump all other desires. Cost of living and employment tend to be higher up the list than rail lines, and Columbus has both a strong economy and relatively low COL. Whatever the case may be, Columbus seems to be doing something right. Continue this look at this population in Part 2.
The FBI recently released full 2014 crime statistics for its Uniform Crime Reporting program, and the results show how Columbus crime plummets between 2010 and 2014.
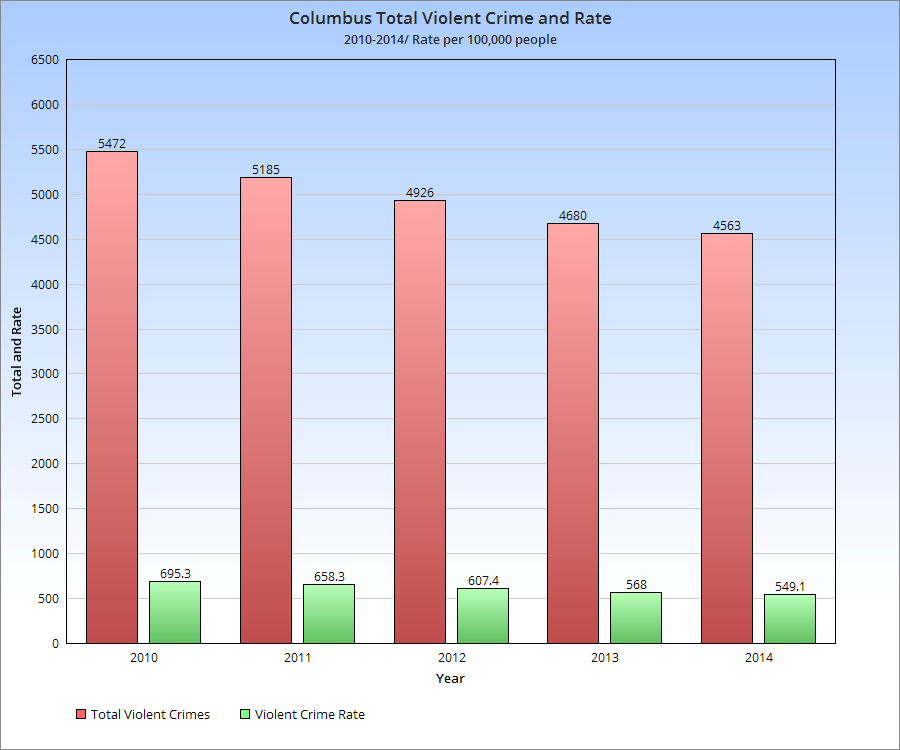
Let’s take a look at some of the numbers. First up, violent crimes.
Total violent crimes between 2010 and 2014 fell 16.6%, with any single person’s chances in 100k of being a victim of violent crime falling 21%. This is a pretty significant drop in just 4 years.
Here’s an individual violent crime breakdown: -Murders were down 15.2% -Rape was up 28.6%. The definition has changed in this time, which may explain some of that increase. -Robbery was down 37.7% -Aggravated Assault was up 14.6%.
So some good and bad. The good news for assault is that it’s well under where it was just 10 years ago, and almost 50% down from its historic peak in the early 1990s. It may have just been a bit worse year in 2014 for this, as all crime totals go through spikes even during a general decline. The bad news is that rape is historically high, but because the definitions have changed for it recently, it’s hard to make a fair comparison to previous years. If the current definition was in place years ago, it’s certainly possible it would now show a decline. Or, as with assault, rape totals could’ve seen a temporary spike above the trend line. Future years will tell the tale.
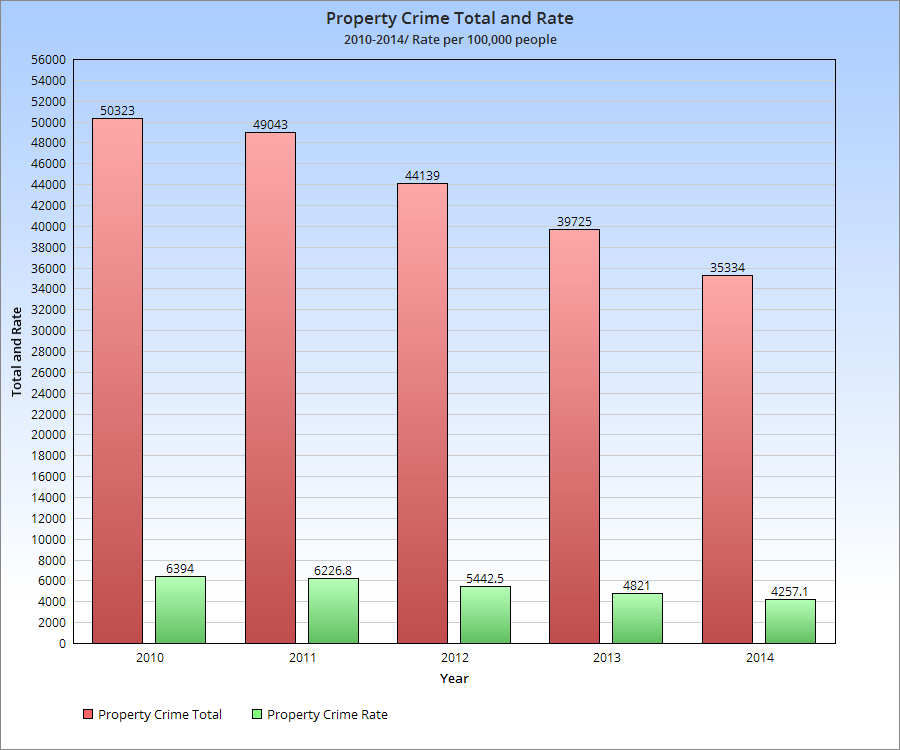
Now for property crime, something that’s always been somewhat high in Columbus, possibly due to the young population age and large number of college students.
Property crime in the city has dropped 29.8% 2010-2014, even more significant than the decrease in violent crime.
So what about 2015 and beyond? Well, indications are that crime is up for 2015 vs. last year, though there are differing theories as to why. Crime being up seems to be widespread in cities around the nation, and some of it has been attributed to a newfound national popularity in heroin. Until we see 2015’s number sometime next year, we won’t know exactly the impact. For now, we can celebrate that the city has indeed become safer.
I’ve compared Columbus to peer cities nationally in terms of density and population, but I’ve never made a Midwest cities historic population and density comparison overall. For the following, I used the top 15 largest Midwest cities as of 2014.
Red indicates a fallen ranking while blue indicates a rise. Black is no change.
Historic Population Rankings 1840 1. Cincinnati: 46,338 2. St. Louis: 16,469 3. Detroit: 9,102 4. Cleveland: 6,071 5. Columbus: 6,048 6. Chicago: 4,470 7. Indianapolis: 2,695 8. Milwaukee: 1,700 9. Toledo: 1,222 10. Kansas City: Not incorporated. 11. Lincoln: Not incorporated. 12. Minneapolis: Not incorporated. 13. Omaha: Not incorporated. 14. St. Paul: Not incorporated. 15. Wichita: Not incorporated.
1850 1. Cincinnati: 115,435 2. St. Louis: 77,860 3. Chicago: 29,963 4. Detroit: 21,019 5. Milwaukee: 20,061 6. Columbus: 17,882 7. Cleveland: 17,034 8. Indianapolis: 8,091 9. Toledo: 3,829 10. St. Paul: 1,112 11. Kansas City: Not incorporated. 12. Lincoln: Not incorporated. 13. Minneapolis: Not incorporated. 14. Omaha: Not incorporated. 15. Wichita: Not incorporated.
Columbus seems poised to take the #2 spot from Indianapolis around or just after 2020. Also, 11 of 15 would’ve seen growth 2010-2020. Cleveland, Toledo, St. Louis and Detroit would be the only cities that still lost.