Google Map Links


Columbus Development Maps

2010-2013 Development
2014-2019 Development
2020-2025 Development
All these pages are basically just map versions of the development pages. However, the maps are organized by year and include before and after photos of the development sites.

Columbus Fantasy Transit Map

2019 Transit Map
The transit map for the Columbus Metro Area is just one example of many existing fantasy maps for Central Ohio. This one includes routes for light rail, BRT (Bus Rapid Transit) and interurban rail to neighboring counties.

The Redevelopment of Westland Mall
Mall Site
Westland Mall and the larger surrounding area is in desperate need of a revamp. Recently, a proposal to make the site into a “Weston” development in the potential style of Easton has emerged. I made this map several years ago as a basic blueprint for how the entire area could be rebuilt into a much more urban, walkable, vibrant corridor.

Ohio Severe Weather Report Maps by Decade

1950-1959 Severe Reports
1960-1960 Severe Reports
1970-1979 Severe Reports
2010-2019 Severe Reports
The 1950s and 1960s maps are the only ones completed so far.

Columbus Area Bike Lanes, Multi-use Paths and Sidewalk Infrastructure

Bike Infrastructure
This map attempts to include all the existing bike and multi-use infrastructure in the area, along with general pedestrian infrastructure. The map will is not fully updated yet through 2019.

Downtown Columbus Parking Infrastructure

Parking Lots and Garages
This map, last updated in 2015, documents all existing parking garages and surfaces lots throughout Downtown.

2015 Census Tract Population Density


2015 census tract population density

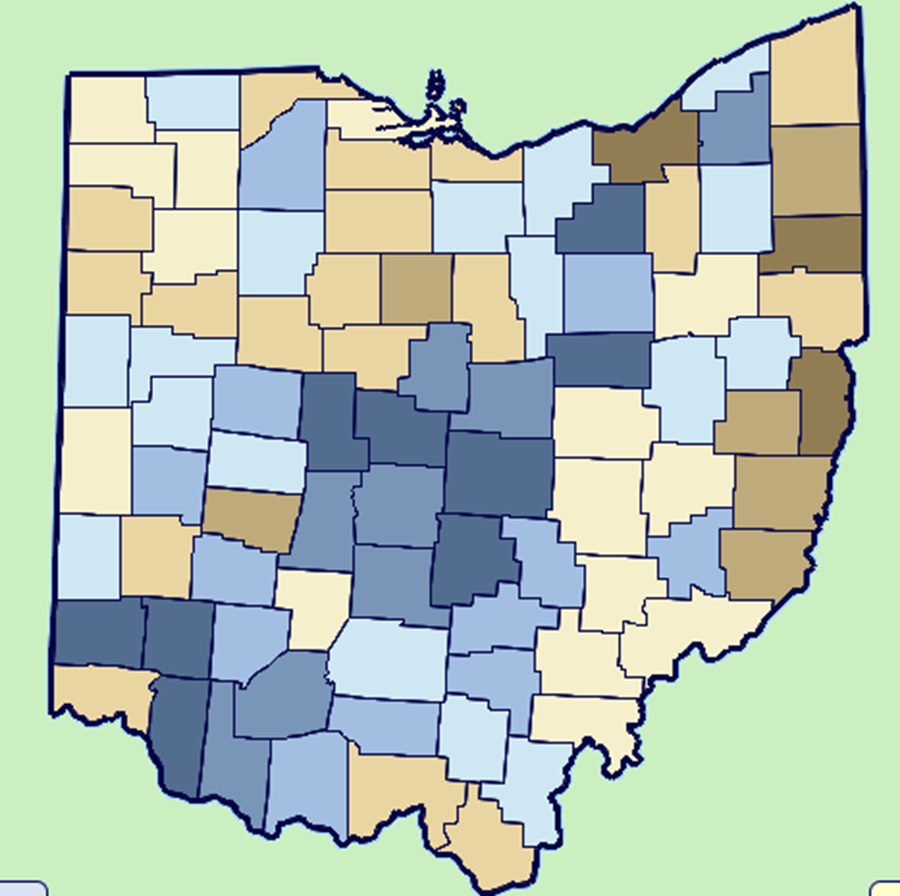
The US Census recently released 2015 census tract population density data, including census tract population density. I figured midway through the decade would be a good point to update where these stand because they give greater insight in smaller-scale population changes. I looked at all the census tracts in Franklin County and came up with the following map series.

First, the population in 2015.

Next, the population density of tracts in 2010, as reference.

And now 2015.

On the surface, it’s difficult to see the changes, but put side by side, you can tell there have been a lot of increases across the county. To make this more visible, I made the following maps.

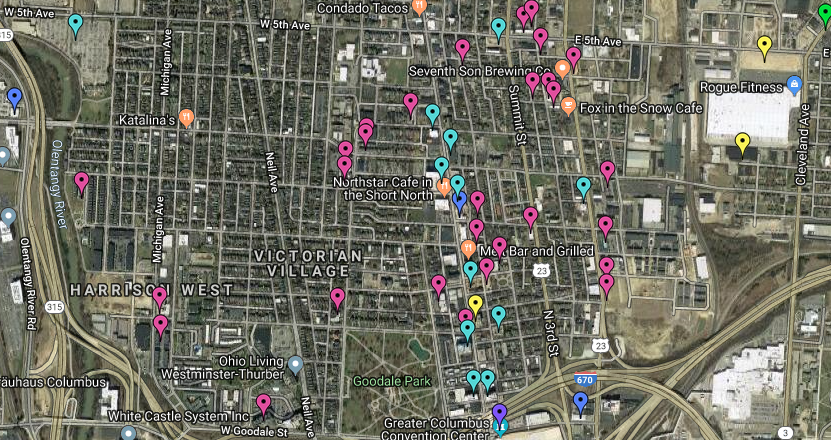
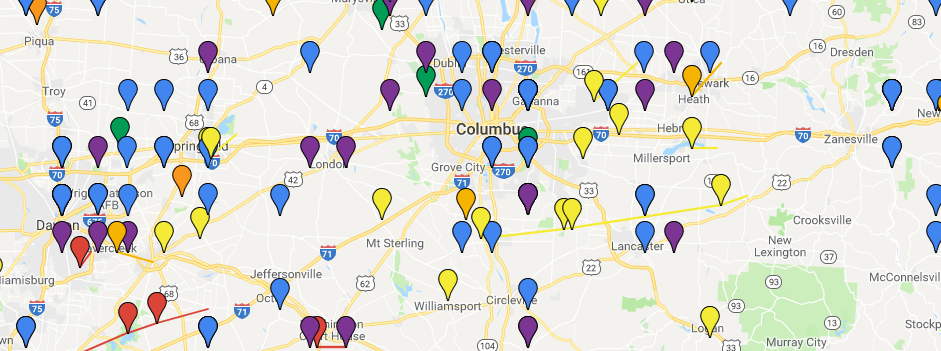
You can see that some of the strongest density increases occurred around Downtown and the Short North, New Albany, parts of the Campus area, and Dublin.

The map above gives a straightforward look at where the density increased and decreased. As you can see, the increases FAR outweighed the decreases. Most of the latter were scattered except across the Far South Side and parts of the Whitehall area.

Here were the top 20 most dense census tracts in 2015.
1. 1810: 29,508.2 South Campus/Victorian Village
2. 1121: 25,287.9 Main Campus
3. 13: 21,961.4 Campus/Indianola Terrace
4. 1110: 18168.6 North Campus/Tuttle Park
5. 10: 17386.3 Campus/SoHud
6. 12: 16,981.9 Campus/Iuka Ravine
7. 20: 13,030.5 Short North/Victorian Village
8. 17: 12,872.3 Weinland Park
9. 6: 12,153.6 Old North Columbus
10. 21: 10,853.5 Short North/High Street
11. 8163: 10,255.3 Lincoln Village/Southwest Columbus
12: 4810: 9,557.4 South Central Hilltop
13. 47: 9,492.7 North Central Hilltop
14. 6352: 9,434.0 Northwest Columbus/Henderson Road
15. 57: 9,257.4 Brewery District/South German Village
16. 5: 9,177.9 Old North Columbus
17. 6933: 9,090.9 Forest Park East
18. 16: 8,980.5 Weinland Park
19. 4620: 8,928.6 North Central Hilltop
20. 1820: 8743.3 Victorian Village

It’s obvious that the High Street corridor is the most dense of the city, racking up most of the top 20.

Now here are the 20 tracts with the largest density increases 2010-2015.
1. 1121: 4,375.9
2. 6: 2,178.5
3. 21: 1,934.9
4. 22: 1,478.1
5. 40: 1,107.7 South Downtown
6. 1820: 1,044.1
7. 20: 921.7
8. 38: 904.3 Old Towne East
9. 5: 861.2
10. 210: 833.9 Clintonville
11. 32: 751.1 Arena District West/West Victorian Village
12. 730: 736.9
13. 7551: 656.0 Somerset/South Easton
14. 7951: 610.4 West Columbus
15. 6372: 574.6 Hayden Falls/Sawmill Road
16. 7209: 514 New Albany
17. 7395: 497.6 Blacklick/East Broad
18. 10: 492.8
19. 8230: 449.3 Westland
20. 710: 447.3 West-Central Linden

And finally, the top 20 largest declines 2010-2015.
1. 13: -2,964.3
2. 12: -1,625.1
3. 42: -1,620.8 Scioto Peninsula/East Franklinton
4. 920: -902.2 Northeast Linden
5. 17: -775.4
6. 50: -554.4 Franklinton
7. 61: -485.7 South High Street
8. 59: -441.9 Near South Side/Deshler Park
9. 4620: -380.4
10. 720: -380.2
11. 4610: -335.4
12. 820: -305.4 North Linden
13. 7721: -305.2 North Linden
14. 45: -258.1 North Hilltop
15. 60: -253.2 Vassor Village
16. 810: North Central Linden
17. 7532: -240.3 Morse Road/Easton
18. 2520: -240.1 Near East Side/King-Lincoln
19. 47: -206.6
20. 9333: -194.9 Linwood

So there you have it. The Census Tract Maps page gives demographic and population data for census tracts going back to 1930.


2015 City Population Estimates


2015 city population estimates

The latest 2015 city population estimates came out today from the US Census, so let’s take a look at them.

First of all, let’s look at the top 25 cities in Ohio on July 1, 2015, and the population change from July 1, 2014.
1. Columbus: 850,106 +12,175
2. Cleveland: 388,072 -1,788
3. Cincinnati: 298,550 +509
4. Toledo: 279,789 -803
5. Akron: 197,542 -557
6. Dayton: 140,599 -235
7. Parma: 79,937 -119
8. Canton: 71,885 -395
9. Youngstown: 64,628 -438
10. Lorain: 63,647 -104
11. Hamilton: 62,407 -44
12. Springfield: 59,680 -246
13. Kettering: 55,525 -117
14. Elyria: 53,775 -179
15. Lakewood: 50,656 -297
16. Cuyahoga Falls: 49,146 -123
17. Middletown: 48,760 -6
18. Newark: 47,986 +140
19. Euclid: 47,676 -242
20. Mentor: 46,901 +35
21. Mansfield: 46,830 -5
22. Beavercreek: 46,227 +217
23. Dublin: 45,098 +794
24. Cleveland Heights: 44,962 -243
25. Strongsville: 44,668 -9

Only a handful of the top 25 saw growth.

Now let’s look at the Columbus metro overall, and the change since July 1, 2014.
1. Columbus: 850,106
2. Newark (Licking): 47,986
3. Dublin: 45,098
4. Lancaster (Fairfield): 39,766
5. Grove City: 39,388
6. Westerville: 38,384
7. Delaware (Delaware): 37,995
8. Reynoldsburg: 37,158
9. Upper Arlington: 34,907
10. Gahanna: 34,590
11. Hilliard: 33,649
12. Marysville (Union): 22,817
13. Pickerington (Fairfield): 19,745
14. Whitehall: 18,694
15. Pataskala (Licking): 15,245
16. Worthington: 14,498
17. Bexley: 13,654
18. Circleville (Pickaway): 13,857
19. Powell (Delaware): 12,927
20. Heath (Licking): 10,489
21. London (Madison): 10,060
22. New Albany: 9,879
23. Canal Winchester: 7,818
24. Grandview Heights: 7,328
25. Logan (Hocking): 7,117
26. Granville (Licking): 5,747
27. Groveport: 5,737
28. Sunbury (Delaware): 5,097
29. Johnstown (Licking): 4,918
30. Obetz: 4,761
31. New Lexington (Perry): 4,727
32. Plain City (Madison): 4,302
33. West Jefferson (Madison): 4,279
34. Ashville (Pickaway): 4,190
35. Mount Gilead (Morrow): 3,653
36. Baltimore (Fairfield): 2,970
37. Buckeye Lake (Licking): 2,760
38. Crooksville (Perry): 2,498
39. Hebron (Licking): 2,409
40. Richwood (Union): 2,281
41. Utica (Licking): 2,196
42. Cardington (Morrow): 2,047
43. South Bloomfield (Pickaway): 1,851
44. Mount Sterling (Madison): 1,745
45. Commercial Point (Pickaway): 1,611
46. Somerset (Perry): 1,464
47. Bremen (Fairfield): 1,437
48. Ashley (Delaware): 1,361
49. Lithopolis (Fairfield) 1,351
50. Minerva Park: 1,318
51. Hanover (Licking): 1,131
52. Williamsport (Pickaway): 1,051
53. Millersport (Fairfield): 1,049
54. Urbancrest: 1,033
55. Thornville (Perry): 997
56. Pleasantville (Fairfield): 958
57. New Holland (Pickaway): 836
58. Milford Center (Union): 823
59. Junction City (Perry): 810
60. Amanda (Fairfield): 747
61. Shawnee Hills (Delaware): 735
62. New Straitsville (Perry): 715
63. Ostrander (Delaware): 688
64. Galena (Delaware): 684
65. Shawnee (Perry): 646
66. Valleyview: 636
67. Thurston (Fairfield): 610
68. Marble Cliff: 584
69. Corning (Perry): 573
70. Riverlea: 569
71. Stoutsville (Fairfield): 566
72. Kirkersville (Licking): 541
73. Carroll (Fairfield): 520
74. Laurelville (Hocking): 517
75. Alexandria (Licking): 523
76. Murray City (Hocking): 435
77. Edison (Morrow): 435
78. Sugar Grove (Fairfield): 431
79. Hartford (Licking): 402
80. St. Louisville (Licking): 376
81. South Solon (Madison): 361
82. Marengo (Morrow): 346
83. Harrisburg: 334
84. Midway (Madison): 327
85. Rushville (Fairfield): 305
86. Tarlton (Pickaway): 290
87. Orient (Pickaway): 275
88. Magnetic Springs (Union): 276
89. Fulton (Morrow): 261
90. Lockbourne: 247
91. Unionville Center (Union): 239
92. Chesterville (Morrow): 230
93. Darbyville (Pickaway): 229
94. Gratiot (Licking): 224
95. Glenford (Perry): 177
96. Sparta (Morrow): 163
97. Hemlock (Perry): 156
98. West Rushville (Fairfield): 135
99. Brice: 120
100. Rendville (Perry): 36

Finally, let’s take a look at population growth ranking between Census 2010 and July 1, 2015.
1. Columbus: +63,073
2. Hilliard: +5,214
3. Grove City: +3,813
4. Dublin: +3,347
5. Delaware: +3,242
6. Westeville: +2,264
7. New Albany: +2,155
8. Powell: +1,472
9. Pickerington: +1,454
10. Gahanna: +1,342
11. Reynoldsburg: +1,265
12. Upper Arlington: +1,136
13. Lancaster: +986
14. Worthington: +923
15 Grandview Heights: +792
16. Marysville: +723
17. Canal Winchester: +717
18. Sunbury: +708
19. Whitehall: +632
20. Bexley: +597
21. Circleville: +543
22. Newark: +413
23. Groveport: +374
24. Johnstown: +286
25. Pataskala: +283
26. Lithopolis: +245
27. Obetz: +229
28. Hanover: +210
29. Heath: +179
30. London: +156
31. South Bloomfield: +107
32. Granville: +101
33. Ashville: +93
34. Plain City: +77
35. Urbancrest: +73
36. Hebron: +73
37. Utica: +64
38. West Jefferson: +57
39. Shawnee Hills: +54
40. Richwood: +52
41. Minverva Park: +46
42. Galena: +45
43. Ostrander: +45
44. New Holland: +35
45. Milford Center: +31
46. Ashley: +31
47. Commercial Point: +29
48. Williamsport: +28
49. Riverlea: +24
50. Kirkersville: +16
51. Valleyview: +16
52. Buckeye Lake: +14
53. Harrisburg: +14
54. Bremen: +12
55. Marble Cliff: +11
56. Amanda: +10
57. Lockbourne: +10
58. Tarlton: +8
59. Magnetic Springs: +8
60. Darbyville: +7
61. Brice: +7
62. Thurston: +6
63. Alexandria: +6
64. Stoutsville: +6
65. Unionville Center: +6
66. Thornville: +6
67. Millersport: +5
68. Orient: +5
69. Sugar Grove: +5
70. Hartford: +5
71. South Solon: +5
72. Somerset: +5
73. Midway: +5
74. Marengo: +4
75. Baltimore: +4
76. Glenford: +4
77. Fulton: +3
78. Gratiot: +3
79. St. Louisville: +3
80. Rushville: +3
81. Chesterville: +2
82. Sparta: +2
83. West Rushville: +1
84. Hemlock: +1
85. Cardington: 0
86. Rendville: 0
87. Pleasantville: -2
88. Edison: -2
89. Carroll: -4
90. New Lexington: -4
91. Mount Gilead: -7
92. New Straitsville: -7
93. Junction City: -9
94. Shawnee: -9
95. Corning: -10
96. Laurelville: -10
97. Murray City: -14
98. Logan: -35
99. Mount Sterling: -37
100. Crooksville: -37

So 86 of the metro’s 100 places have either grown or held steady in population since 2010. That is an increase from 70 places during the 2000s.


Top Housing Markets of 2015

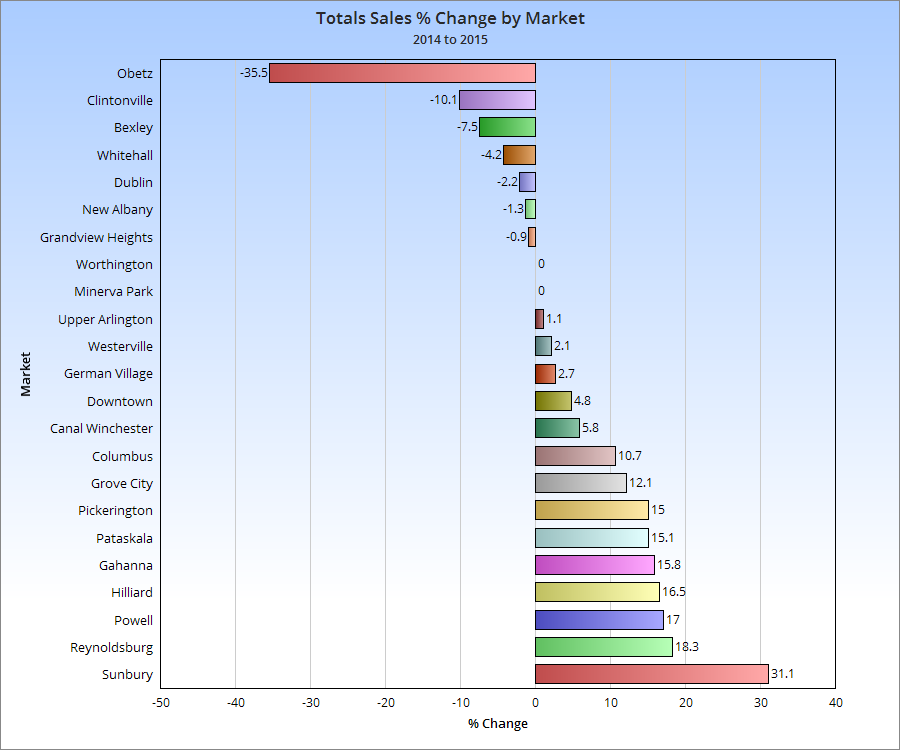
The 2015 housing market was one of the strongest since before the recession, and 2016 looks to do even better. An ongoing problem, especially within the more urban markets, is a historically low inventory of available homes for sale. This has been a problem for several years now, as construction has failed to match demand.
Top housing markets of 2015 house sales

That lack of inventory really shows up in the yearly % change chart. Few urban markets have increased year over year, as they have a much more limited supply of housing, even as demand for urban housing has increased.

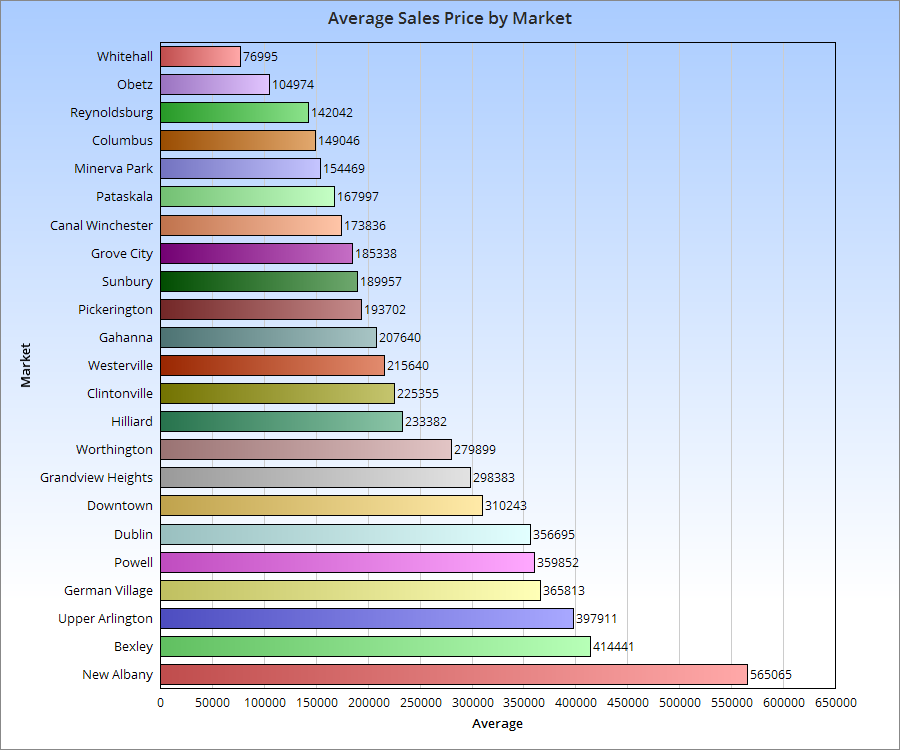
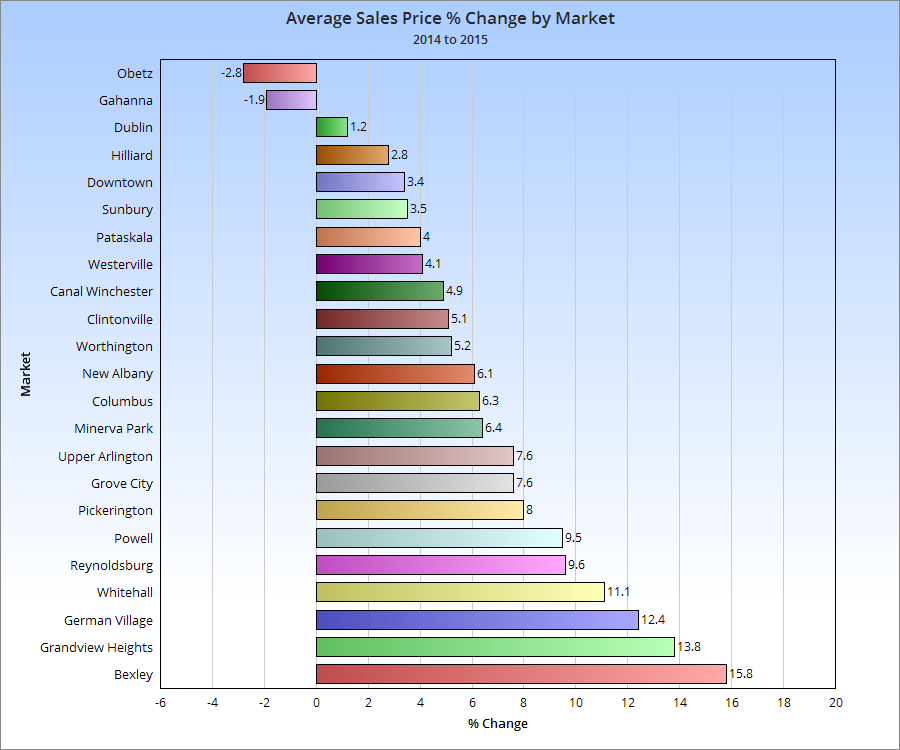
Let’s see how this impacted prices.

While urban markets were not necessarily the most expensive compared to suburban, more of them were generally towards the top half of price increases last year.


Non-English Languages Spoken in Columbus


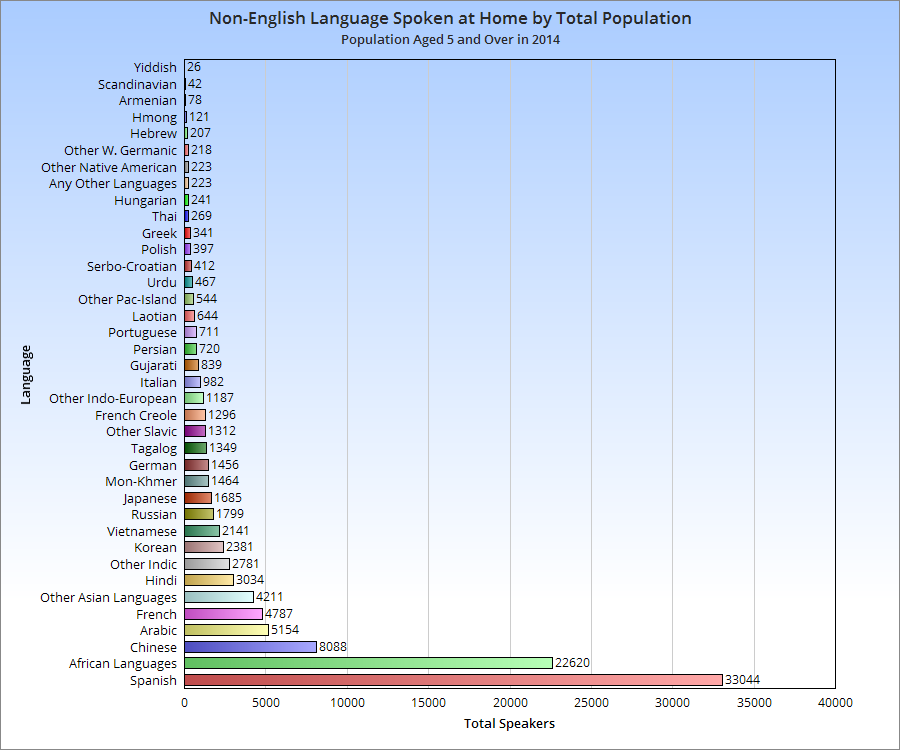
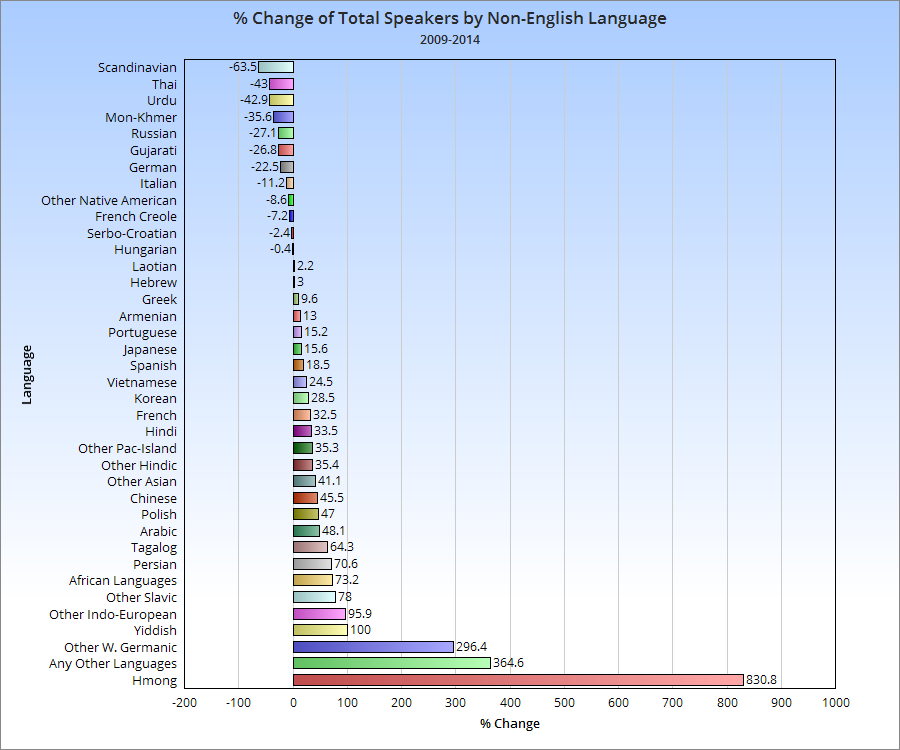
Just a quick little post about the non-English languages spoken in the city of Columbus and how they have changed between 2009 and 2014, by total number of speakers.
languages spoken in Columbus

For the record, in 2014, 14.3% of the Columbus population spoke a language other than English at home, up from about 12% in 2009.