The US Census recently released 2015 census tract population density data, including census tract population density. I figured midway through the decade would be a good point to update where these stand because they give greater insight in smaller-scale population changes. I looked at all the census tracts in Franklin County and came up with the following map series.
First, the population in 2015.
Next, the population density of tracts in 2010, as reference.
And now 2015.
On the surface, it’s difficult to see the changes, but put side by side, you can tell there have been a lot of increases across the county. To make this more visible, I made the following maps.
You can see that some of the strongest density increases occurred around Downtown and the Short North, New Albany, parts of the Campus area, and Dublin.
The map above gives a straightforward look at where the density increased and decreased. As you can see, the increases FAR outweighed the decreases. Most of the latter were scattered except across the Far South Side and parts of the Whitehall area.
Here were the top 20 most dense census tracts in 2015. 1. 1810: 29,508.2 South Campus/Victorian Village 2. 1121: 25,287.9 Main Campus 3. 13: 21,961.4 Campus/Indianola Terrace 4. 1110: 18168.6 North Campus/Tuttle Park 5. 10: 17386.3 Campus/SoHud 6. 12: 16,981.9 Campus/Iuka Ravine 7. 20: 13,030.5 Short North/Victorian Village 8. 17: 12,872.3 Weinland Park 9. 6: 12,153.6 Old North Columbus 10. 21: 10,853.5 Short North/High Street 11. 8163: 10,255.3 Lincoln Village/Southwest Columbus 12: 4810: 9,557.4 South Central Hilltop 13. 47: 9,492.7 North Central Hilltop 14. 6352: 9,434.0 Northwest Columbus/Henderson Road 15. 57: 9,257.4 Brewery District/South German Village 16. 5: 9,177.9 Old North Columbus 17. 6933: 9,090.9 Forest Park East 18. 16: 8,980.5 Weinland Park 19. 4620: 8,928.6 North Central Hilltop 20. 1820: 8743.3 Victorian Village
It’s obvious that the High Street corridor is the most dense of the city, racking up most of the top 20.
Now here are the 20 tracts with the largest density increases 2010-2015. 1. 1121: 4,375.9 2. 6: 2,178.5 3. 21: 1,934.9 4. 22: 1,478.1 5. 40: 1,107.7 South Downtown 6. 1820: 1,044.1 7. 20: 921.7 8. 38: 904.3 Old Towne East 9. 5: 861.2 10. 210: 833.9 Clintonville 11. 32: 751.1 Arena District West/West Victorian Village 12. 730: 736.9 13. 7551: 656.0 Somerset/South Easton 14. 7951: 610.4 West Columbus 15. 6372: 574.6 Hayden Falls/Sawmill Road 16. 7209: 514 New Albany 17. 7395: 497.6 Blacklick/East Broad 18. 10: 492.8 19. 8230: 449.3 Westland 20. 710: 447.3 West-Central Linden
And finally, the top 20 largest declines 2010-2015. 1. 13: -2,964.3 2. 12: -1,625.1 3. 42: -1,620.8 Scioto Peninsula/East Franklinton 4. 920: -902.2 Northeast Linden 5. 17: -775.4 6. 50: -554.4 Franklinton 7. 61: -485.7 South High Street 8. 59: -441.9 Near South Side/Deshler Park 9. 4620: -380.4 10. 720: -380.2 11. 4610: -335.4 12. 820: -305.4 North Linden 13. 7721: -305.2 North Linden 14. 45: -258.1 North Hilltop 15. 60: -253.2 Vassor Village 16. 810: North Central Linden 17. 7532: -240.3 Morse Road/Easton 18. 2520: -240.1 Near East Side/King-Lincoln 19. 47: -206.6 20. 9333: -194.9 Linwood
So there you have it. The Census Tract Maps page gives demographic and population data for census tracts going back to 1930.
The Census just came out with 2015 demographic numbers for all places with at least 65,000 people. Given that half the decade is over, it’s a good point to look at where Columbus stands relative to its national/Midwest peers in a foreign-born comparison. A few days ago, I gave numbers for GDP. In the next few posts, I will look at the people that make up the populations of these places.
First up, let’s take a look at foreign-born populations. I have looked at this topic some in the past, but I have never done a full-scale comparison for this topic.
Total Foreign-Born Population Rank by City 2000, 2010 and 2015 2000—————————————-2010———————————-2015 1. Chicago, IL: 628,903———–1. Chicago: 557,674—————1. Chicago: 573,463 2. San Jose, CA: 329,750——–2. San Jose: 366,194————-2. San Jose: 401,493 3. San Antonio, TX: 133,675—-3. San Antonio: 192,741———-3. San Antonio: 208,046 4. Austin, TX: 109,006————4. Austin: 148,431——————4. Austin: 181,686 5. Las Vegas, NV: 90,656——-5. Las Vegas: 130,503————-5. Charlotte: 128,897 6. Sacramento, CA: 82,616—–6. Chalotte: 106,047—————6. Las Vegas: 127,609 7. Portland, OR: 68,976———7. Sacramento: 96,105————-7. Sacramento: 112,579 8. Charlotte, NC: 59,849——–8. Columbus: 86,663—————-8. Columbus: 101,129 9. Minneapolis, MN: 55,475—–9. Portland: 83,026—————–9. Nashville: 88,193 10. Columbus: 47,713———–10. Indianapolis: 74,407———–10. Portland: 86,041 11. Milwaukee, WI: 46,122—–11. Nashville: 73,327—————11. Indianapolis: 72,456 12. Detroit, MI: 45,541———–12. Minneapolis: 57,846———–12. Minneapolis: 70,769 13. Providence, RI: 43,947—–13. Milwaukee: 57,222————-13. Milwaukee: 58,321 14. Nashville, TN: 38,936——-14. Providence: 52,926————14. Providence: 53,532 15. Indianapolis, IN: 36,067—-15. Orlando: 43,747—————-15. Orlando: 50,558 16. Virginia Beach, VA: 28,276–16. Virginia Beach: 40,756—–16. Omaha: 48,263 17. Orlando, FL: 26,741———17. Omaha: 39,288—————–17. Detroit: 39,861 18. Omaha, NE: 25,687———18. Kansas City: 35,532———18. Virginia Beach: 38,360 19. Kansas City, MO: 25,632—19. Detroit: 34,307—————-19. Kansas City: 37,787 20. Cleveland: 21,372————20. St. Louis: 23,011————–20. Pittsburgh: 28,187 21. Grand Rapids, MI: 20,814–21. Pittsburgh: 18,698————21. St. Louis: 21,802 22. St Louis, MO: 19,542——-22. Cleveland: 17,739————-22. Grand Rapids: 19,176 23. Pittsburgh, PA: 18,874—–23. Grand Rapids: 16,615——–23. Cleveland: 18,830 24. Cincinnati: 12,461———–24. Cincinnati: 16,531————-24. Cincinnati: 16,896 25. Toledo: 9,475—————–25. Toledo: 11,559—————–25. Akron: 10,024 26. Akron: 6,911——————26. Akron: 8,524——————–26. Toledo: 9,257 27. Dayton: 3,245—————-27. Dayton: 5,102——————-27. Dayton: 7,381 28. Youngstown: 1,605———28. Youngstown: 3,695————28. Youngstown: 1,058
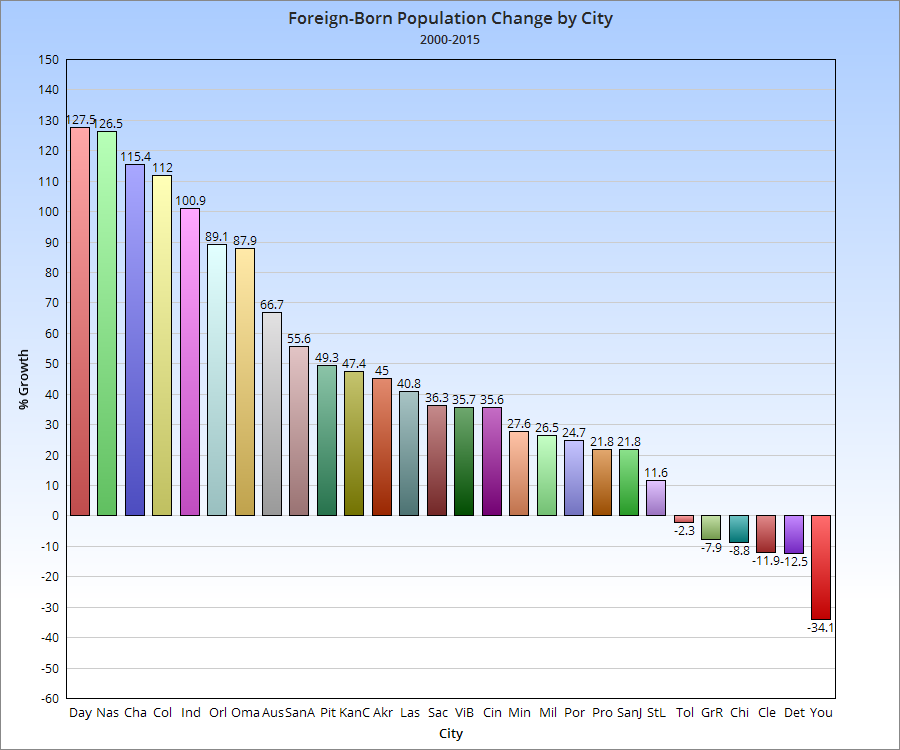
Here’s the 2000-2015 total change.
And the 2000-2015 change by %.
So Columbus has an above average total and growth compared to its peers nationally.
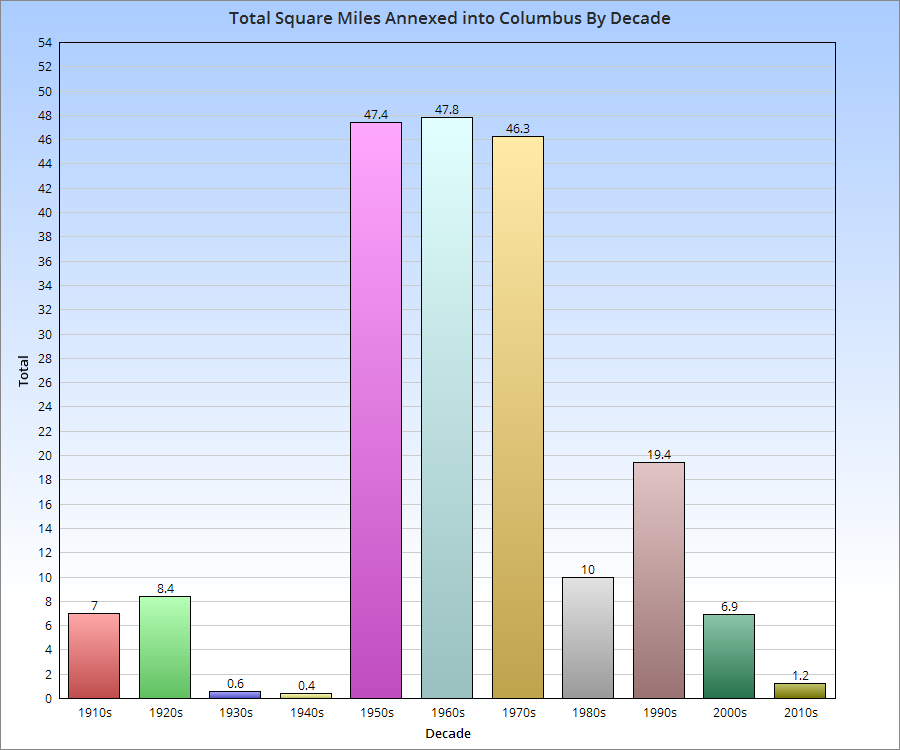
Ever wonder how Columbus got so big in area? Its city limits stretch into parts of other counties and include about a third of Franklin County. Today, it has a reputation for annexing its way to growth, but how true is this?
Well, 50 years ago, it was more or less true. Today, not so much. Aggressive annexation began in Columbus in 1953, when Mayor Maynard “Jack” Sensenbrenner began his policy of requiring annexation into the city if communities wanted city water service. Between 1953 and 1960, the area size of the city more than doubled, and that rate continued through the 1960s and 1970s, even after Sensenbrenner was no longer mayor. After 1980, annexation rates gradually began to decline. As the chart above shows, you can see the rapid rate of growth during the 1950s-1970s and the decline in more recent decades. Through the first 5 years of the 2010s, Columbus is on pace to add fewer than 3 square miles by 2020. Despite that fact, the city’s annual population growth since 2010 is exceeding the average annual growth of any decade during the mass annexation years. This strongly supports that the dynamic, and indeed, the story of Columbus’ growth is no longer about “fake” growth through the addition of existing land and population, but rather though the influx of new residents from outside of the city limits altogether. This is helping to gradually raise the city’s population density, which exceeded Cincinnati’s last year, as the chart below shows, along with a few other Columbus peers.
Millennials- those born roughly between 1981 and 2001- are big news these days. They are the largest generation ever in terms of total numbers (exceeding 76 million), and their choices are already having big impacts on everything from housing to the economy. I wanted to look at Columbus and its peers to see where it ranks in terms of attracting these young professionals.
For the comparison, I looked at metro areas of 1.5-2.5 million as well as major Midwest metros and then used their core cities to get the numbers. I used the age group of 25-34 specifically, as that is usually the number most often cited in the news.
Rank of Total Population Aged 25-34 2005_______________________2010___________________2014 1. Chicago: 463,236_______1. Chicago: 510,042_______1. Chicago: 525,381 2. San Antonio: 180,981_____2. San Antonio: 200,645____2. San Antonio: 226,711 3. Austin: 137,523_________3. Austin: 162,247_________3. Austin: 199,838 4. San Jose, CA: 133,144___4. Columbus: 147,584______4. Columbus: 170,759 5. Columbus: 131,641______5. San Jose, CA: 142,551___5. San Jose, CA: 153,690 6. Indianapolis: 114,532_____6. Indianapolis: 133,088____6. Charlotte, NC: 141,869 7. Detroit: 110,759_________7. Charlotte, NC: 127,539___7. Indianapolis: 140,491 8. Charlotte, NC: 100,025____8. Portland, OR: 113,210___8. Portland, OR: 116,109 9. Portland, OR: 90,023_____9. Milwaukee: 97,359______9. Milwaukee: 100,205 10. Las Vegas: 84,418______10. Detroit: 85,023________10. Minneapolis: 90,662 11. Milwaukee: 82,060______11. Minneapolis: 81,532____11. Las Vegas: 90,441 12. Sacramento, CA: 75,497___12. Las Vegas: 81,212____12. Detroit: 89,843 13. Minneapolis: 74,208___13. Sacramento, CA: 78,527__13. Sacramento, CA: 84,013 14. Kansas City, MO: 68,060__14. Kansas City: 73,872__14. Kansas City, MO: 79,262 15. Virginia Beach: 60,749__15. Virginia Beach: 67,614__15. Virginia Beach: 75,543 16. Omaha, NE: 56,248____16. Omaha, NE: 62,396_____16. Omaha, NE: 71,040 17. Wichita, KS: 52,426____17. St. Louis: 57,627_______17. Pittsburgh: 62,473 18. Cleveland: 50,558_____18. Wichita, KS: 56,737_____18. St. Louis: 61,718 19. St. Louis: 48,137______19. Cleveland: 54,428______19. Wichita, KS: 58,334 20. Cincinnati: 44,945_____20. Pittsburgh: 51,109______20. Cleveland: 56,134 21. Toledo: 43,134_______21. St. Paul, MN: 50,107_____21. St. Paul, MN: 54,464 22. Orlando: 40,846______22. Cincinnati: 49,067_______22. Orlando: 54,395 23. St. Paul, MN: 39,676__23. Orlando: 48,102________23. Cincinnati: 54,247 24. Lincoln, NE: 38,893___24. Madison, WI: 44,662_____24. Madison, WI: 44,835 25. Madison, WI: 38,826___25. Lincoln, NE: 42,034_____25. Toledo: 43,661 26. Pittsburgh: 38,744____26. Toledo: 41,580_________26. Lincoln, NE: 40,071 27. Grand Rapids: 35,287__27. Fort Wayne, IN: 35,193__27: Grand Rapids: 38,922 28. Des Moines: 32,640__28. Providence, RI: 31,044__28. Fort Wayne, IN: 37,741 29. Fort Wayne, IN: 31,738__29. Grand Rapids: 30,963__29. Des Moines: 33,857 30. Akron: 30,436_______30. Des Moines: 30,376_____30. Providence, RI: 31,902 31. Providence, RI: 29,307__31. Akron: 27,446________31. Akron: 28,207 32. Dayton: 18,591_______32. Dayton: 20,278________32. Dayton: 21,096 33. Youngstown: 8,505____33. Youngstown: 8,484_____33. Youngstown: 8,468
So Columbus ranks highly among total population in the 25-34 age group. But what about growth?
Total Growth Rank in 25-34 Population 2005-2014 1. Austin, TX: 62,315 2. Chicago: 62,145 3. San Antonio, TX: 45,730 4. Charlotte, NC: 41,844 5. Columbus: 39,118 6. Portland, OR: 26,086 7. Indianapolis: 25,959 8. Pittsburgh: 23,729 9. San Jose, CA: 20,546 10. Milwaukee, WI: 18,145 11. Minneapolis, MN: 16,454 12. Virginia Beach, VA: 14,794 13. St. Paul, MN: 14,788 14. Omaha, NE: 14,612 15. St. Louis, MO: 13,581 16. Orlando, FL: 13,549 17. Kansas City, MO: 11,202 18. Cincinnati: 9,302 19. Sacramento, CA: 8,516 20. Las Vegas, NV: 6,023 21. Madison, WI: 6,009 22. Fort Wayne, IN: 6,003 23. Wichita, KS: 5,908 24. Cleveland: 5,576 25. Grand Rapids, MI: 3,635 26. Providence, RI: 2,595 27. Dayton: 2,505 28. Des Moines, IA: 1,217 29. Lincoln, NE: 1,178 30. Toledo: 527 31. Youngstown: -37 32. Akron: -2,229 33. Detroit: -20,736
Again, Columbus ranks near the top during this period. What about more recently, since 2010?
Total Growth Rank of 25-34 Population 2010-2014 1. Austin: 37,591 2. San Antonio: 26,066 3. Columbus: 23,175 4. Chicago: 15,339 5. Charlotte: 14,330 6. Pittsburgh: 11,364 7. San Jose: 11,139 8. Las Vegas: 9,229 9. Minneapolis: 9,130 10. Omaha: 8,644 11. Grand Rapids: 7,959 12. Virginia Beach: 7,929 13. Indianapolis: 7,403 14. Orlando: 6,293 15. Sacramento: 5,486 16. Kansas City: 5,390 17. Cincinnati: 5,180 18. Detroit: 4,820 19. St. Paul: 4,357 20. St. Louis: 4,091 21. Des Moines: 3,481 22. Portland: 2,899 23. Milwaukee: 2,846 24. Fort Wayne: 2,548 25. Toledo: 2,081 26. Cleveland: 1,706 27. Wichita: 1,597 28. Providence: 858 29. Dayton: 818 30. Akron: 761 31. Madison: 173 32. Youngstown: -16 33. Lincoln: -1,963
So Columbus is doing even better since 2010 than it did in the earlier period and attracts significantly more Millennials in the 25-34 age group than cities often cited for this very metric.
Next, let’s look at percentage growth, as city size can affect this.
Total Percent Growth 2005-2014 in 25-34 Population 1. Pittsburgh: +61.25% 2. Austin: +45.31% 3. Charlotte: +41.83% 4. St. Paul: +37.27% 5. Orlando: +33.17% 6. Columbus: +29.72% 7. Portland: +28.98% 8. St. Louis: +28.21% 9. Omaha: +25.89% 10. San Antonio: +25.27% 11. Virginia Beach: +24.35% 12. Indianapolis: +22.67% 13. Minneapolis: +22.17% 14. Milwaukee: +22.11% 15. Cincinnati: +20.70% 16. Fort Wayne: +18.91% 17. Kansas City: +16.46% 18. Madison: +15.48% 19. San Jose: +15.43% 20. Dayton: +13.47% 21. Chicago: +13.42% 22. Sacramento: +11.28% 23. Wichita: +11.27% 24. Cleveland: +11.03% 25. Grand Rapids: +10.30% 26. Providence: +8.85% 27. Las Vegas: +7.13% 28. Des Moines: +3.73% 29. Lincoln: +3.03% 30. Toledo: +1.22% 31. Youngstown: -0.44% 32. Akron: -7.32% 33. Detroit: -18.75%
So Columbus again performs well in percentage growth, despite having one of the largest populations in the age group. It performs even better in the period since 2010, coming in at 3rd place.
Finally, now that we know the totals and the growth, what is the % of total city population that the 25-34 age group makes up?
25-34 % of Total City Population 2014 1. Minneapolis: 22.27% 2. Austin: 21.89% 3. Orlando: 20.73% 4. Pittsburgh: 20.45% 5. Columbus: 20.42% 6. Grand Rapids: 20.08% 7. St. Louis: 19.44% 8. Chicago: 19.30% 9. Portland: 18.74% 10. St. Paul: 18.30% 11. Madison: 18.25% 12. Cincinnati: 18.19% 13. Providence: 17.81% 14. Charlotte: 17.52% 15. Sacramento: 17.32% 16. Kansas City: 16.84% 17. Virginia Beach: 16.75% 18. Milwaukee: 16.71% 19. Indianapolis: 16.50% 20. Des Moines: 16.19% 21. Omaha: 15.91% 22. San Antonio: 15.78% 23. Toledo: 15.54% 24. San Jose: 15.13% 25. Wichita: 15.02% 26. Dayton: 14.96% 27. Fort Wayne: 14.74% 28. Las Vegas: 14.74% 29. Lincoln: 14.68% 30. Cleveland: 14.41% 31. Akron: 14.26% 32. Detroit: 13.21% 33. Youngstown: 13.02%
And here’s a simple % of population projection for just 4 years from now, 2018, provided the 25-34 population grows the same between 2014-2018 as it did 2010-2014. 1. Pittsburgh: 24.18% 2. Grand Rapids: 23.71% 3. Austin: 23.38% 4. Minneapolis: 23.27% 5. Columbus: 22.16% 6. Orlando: 21.34% 7. St. Louis: 20.82% 8. Cincinnati: 19.85% 9. Chicago: 19.70% 10. St. Paul: 19.05% 11. Providence: 18.20% 12. Portland: 18.14% 13. Virginia Beach: 18.1% 14. Sacramento: 17.84% 15. Charlotte: 17.67% 16. Kansas City: 17.64% 17. Des Moines: 17.50% 18. Madison: 17.40% 19. Milwaukee: 17.07% 20. Indianapolis: 16.85% 21. Omaha: 16.61% 22. Toledo: 16.59% 23. San Antonio: 16.52% 24. Fort Wayne: 15.61% 25. Las Vegas: 15.59% 26. Dayton: 15.27% 27. San Jose: 15.24% 28. Wichita: 15.23% 29. Cleveland: 15.08% 30. Akron: 14.73% 31. Detroit: 14.48% 32. Youngstown: 13.35% 33. Lincoln: 13.13%
Columbus has an existing large population of the 25-34 age demographic, and looks to be one of the strongest performers into the near future. Some would ask why that would be considering that Columbus transit is woefully lacking and has a reputation (very undeservedly, in my opinion) of being suburban- characteristics that Millennials supposedly almost universally reject. Perhaps the bottom line is that economics trump all other desires. Cost of living and employment tend to be higher up the list than rail lines, and Columbus has both a strong economy and relatively low COL. Whatever the case may be, Columbus seems to be doing something right. Continue this look at this population in Part 2.
The FBI recently released full 2014 crime statistics for its Uniform Crime Reporting program, and the results show how Columbus crime plummets between 2010 and 2014.
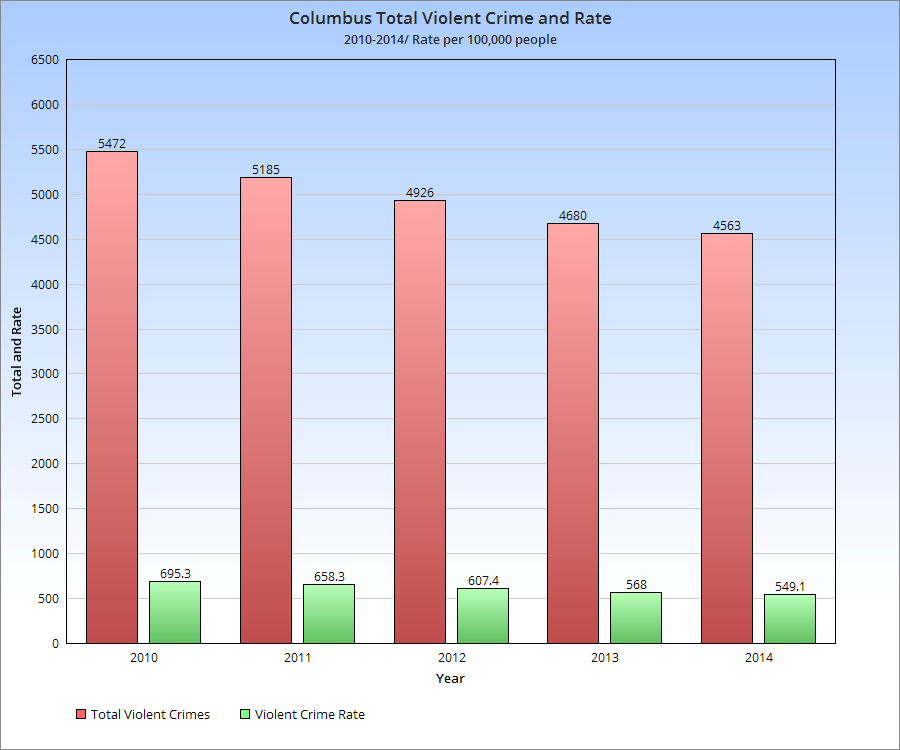
Let’s take a look at some of the numbers. First up, violent crimes.
Total violent crimes between 2010 and 2014 fell 16.6%, with any single person’s chances in 100k of being a victim of violent crime falling 21%. This is a pretty significant drop in just 4 years.
Here’s an individual violent crime breakdown: -Murders were down 15.2% -Rape was up 28.6%. The definition has changed in this time, which may explain some of that increase. -Robbery was down 37.7% -Aggravated Assault was up 14.6%.
So some good and bad. The good news for assault is that it’s well under where it was just 10 years ago, and almost 50% down from its historic peak in the early 1990s. It may have just been a bit worse year in 2014 for this, as all crime totals go through spikes even during a general decline. The bad news is that rape is historically high, but because the definitions have changed for it recently, it’s hard to make a fair comparison to previous years. If the current definition was in place years ago, it’s certainly possible it would now show a decline. Or, as with assault, rape totals could’ve seen a temporary spike above the trend line. Future years will tell the tale.
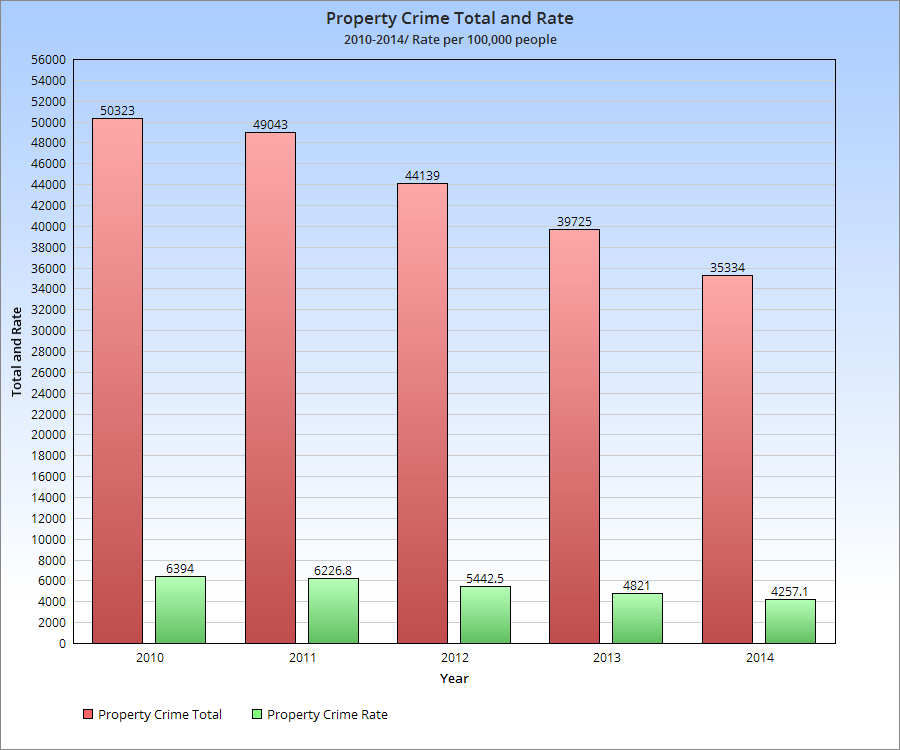
Now for property crime, something that’s always been somewhat high in Columbus, possibly due to the young population age and large number of college students.
Property crime in the city has dropped 29.8% 2010-2014, even more significant than the decrease in violent crime.
So what about 2015 and beyond? Well, indications are that crime is up for 2015 vs. last year, though there are differing theories as to why. Crime being up seems to be widespread in cities around the nation, and some of it has been attributed to a newfound national popularity in heroin. Until we see 2015’s number sometime next year, we won’t know exactly the impact. For now, we can celebrate that the city has indeed become safer.