The Summer 2021 review shows a rather warm and wet season, but extremes were rare. Record heat did not occur, and severe weather- a typical event during the summer- was all but missing for the region.
1991-2020 Summer Normals Average High: 83.9 Average Low: 63.6 Mean: 73.8 Precipitation: 12.74″
June-August Average High: 84.9 Tied for 23rd Warmest Average Low: 65.8 Tied for 6th Warmest Mean: 74.4 12th Warmest Precipitation: 14.38″ 24th Wettest # of 70 or Below Highs: 1 Tied for 2nd Fewest # of 50 or Below Lows: 1 Tied for 2nd Fewest # of 90 or Above Highs: 19 Tied for 21st Most # of 100 or Above Highs: 0 Tied for 1st Fewest # of 70 or Above Lows: 29 Tied for 4th Most # of Measurable Precipitation Days: 39 Tied for 7th Most
Average High By Month June 2021: 84.3 17th Warmest July 2021: 84.4 Tied for 33rd Coldest August 2021: 86.1 Tied for 18th Warmest
Average Low By Month June 2021: 64.1 Tied for 10th Warmest July 2021: 66.1 Tied for 26th Warmest August 2021: 67.3 Tied for 7th Warmest
Mean By Month June 2021: 74.2 Tied for 12th Warmest July 2021: 75.2 Tied for 35th Warmest August 2021: 76.7 10th Warmest
Precipitation By Month June 2021: 2.58″ 35th Driest July 2021: 4.64″ Tied for 50th Wettest August 2021: 7.16″ Tied for 5th Wettest
Summer 2021 got both progressively warmer and wetter as it went.
Maximum High By Month June 2021: 96 on June 29th July 2021: 92 on July 5th, 6th and 7th August 2021: 92 on August 12th and 24th
Minimum High By Month June 2021: 68 on June 2nd July 2021: 75 on July 10th August 2021: 77 on August 15th
Maximum Low By Month June 2021: 73 on June 20th, 26th and 27th July 2021: 72 on July 12th, 13th and 25th August 2021: 72 on August 11th, 12th and 29th
Maximum Low Records -The 73 on June 20th tied the record for the date, last set in 1931. -The 73 on June 26th tied the record for the date, last set in 1998.
Minimum Low By Month June 2021: 50 on June 23rd July 2021: 56 on July 3rd August 2021: 58 on August 2nd
Highest Daily Precipitation By Month June 2021: 0.60″ on June 7th July 2021: 1.26″ on July 1st August 2021: 1.55″ on August 16th
Precipitation Records -The 1.55″ on August 16th set a new record for the date, breaking the 1.26″ set in 1934.
Measurable Precipitation Days By Month June 2021: 12 July 2021: 10 August 2021: 17
Severe weather was unusually limited over the summer. Columbus had only 3 severe thunderstorm warnings over the entire 3 month period- on July 29th, August 11th and August 12th. July 29th brought quarter-sized hail and strong winds to the Downtown area, while the August dates brought strong winds up to 60MPH.
First up is a link to a story on the growing housing crisis across Ohio, with a focus on the Columbus area. https://kevinverhoff.com/index.php/2020/02/13/ohios-housing-crisis/ The article uses an interesting metric to quantify just how bad the housing shortage is in counties across the state- the number of jobs versus the number of available housing units. In Columbus, there is only about 0.7 units per 1 job, leading to a Central Ohio shortage of more than 200,000 units!
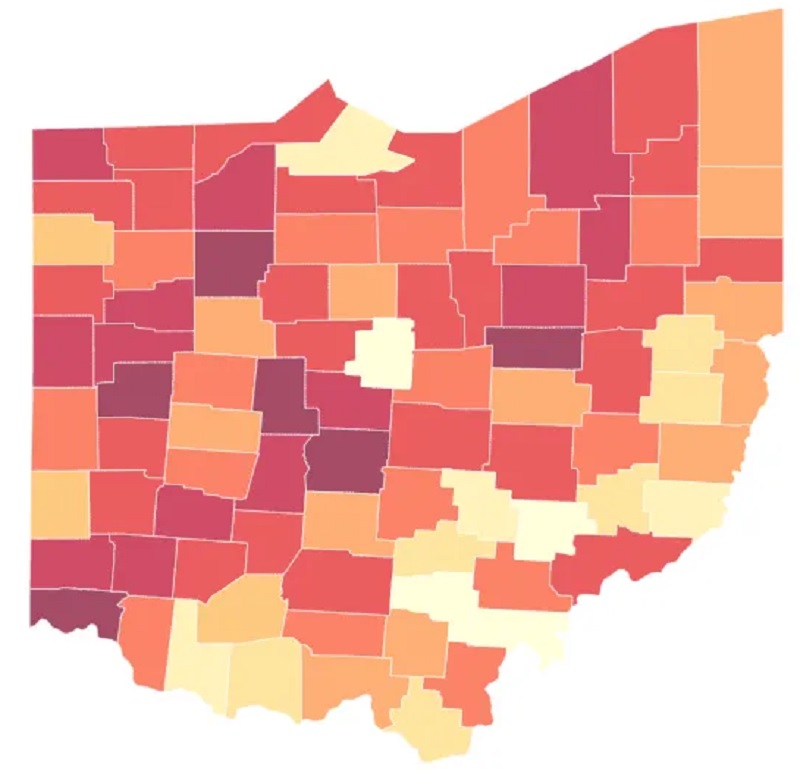
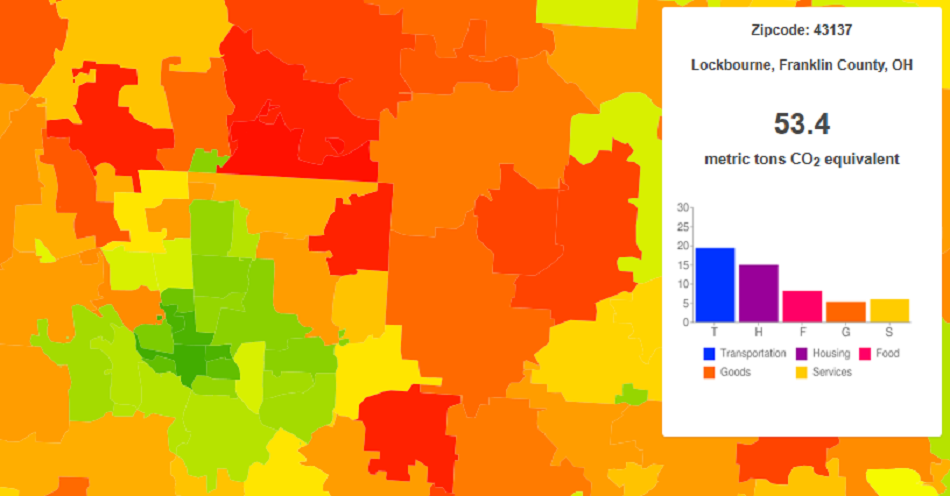
Second, here is a link that gives the average annual carbon footprint of all US zip codes. In general, it seems that the most urban zip codes have the lowest footprints, along with far rural areas. The highest footprints seem to be in suburban and exurban areas. In the Columbus area, the zip code with the highest carbon footprint is 43021, which contains much of Westerville. Second highest is 43054, which contains New Albany. Take a look at the interactive maps here: https://coolclimate.org/maps
This weekly update includes the following: -The Completed Development page has received most of the attention. Most projects finished since 2010 have been restored, and I am now working on adding projects for years going all the way back to the 19th Century. -All other development pages saw some limited updates. –Rail Transportation History continues to expand.
Coming soon: -I have been putting together some data for several updates to the demographics pages, particularly related to immigration and crime data. -A restoration of the Census Tract Maps page is in the works, though not this coming week. -Monthly weather stats for another month should arrive this week. -At least one new non-update post is coming this week. -There will be a focus this week in particular to restore the Under Construction and Proposed Development pages.
In the 2nd post related to the recently-released Census demographic data, I’ll look at Columbus city diversity and peer comparison for how it’s been changing since 2005.
Rank by City of Total White, non-Hispanic Population by Year 2005————————————–2010————————————-2017 1. Chicago, IL: 819,215————1. Chicago: 853,910————1. Chicago: 879,334 2. Indianapolis, IN: 491,044—2. Indianapolis: 482,195—–2. Columbus: 490,149 3. Columbus: 442,958———-3. Columbus: 470,971—-3. Indianapolis: 468,665 4. Portland, OR: 382,033———-4. Portland: 417,876————4. Austin: 453,801 5. San Antonio, TX: 356,420—–5. Austin: 384,065————5. Portland: 452,132 6. Austin, TX: 347,013——-6. San Antonio: 351,420—6. San Antonio: 375,463 7. Nashville, TN: 314,518——–7. Nashville: 339,030——–7. Nashville: 368,195 8. Charlotte, NC: 302,789——-8. Charlotte: 331,357——8. Charlotte: 360,270 9. Virginia Beach, VA: 290,891–9. Virginia Beach: 282,812——9. Omaha: 311,349 10. San Jose, CA: 281,822—–10. Las Vegas: 280,604———–10. Las Vegas: 280,201 11. Las Vegas, NV: 281,679—-11. Omaha: 277,606———–11. Virginia Beach: 277,338 12. Omaha, NE: 267,685——–12. San Jose: 265,311————12. Kansas City: 272,548 13. Kansas City, MO: 249,123—13. Kansas City: 247,473——13. San Jose: 267,315 14. Wichita, KS: 245,527———-14. Wichita: 245,146————14. Minneapolis: 252,304 15. Milwaukee, WI: 219,891——15. Minneapolis: 242,848——15. Wichita: 243,143 16. Minneapolis, MN: 216,975—16. Milwaukee: 221,514——–16. Lincoln: 226,297 17. Lincoln, NE: 197,287———-17. Lincoln: 216,076————-17. Milwaukee: 207,043 18. Toledo: 183,746—————-18. Pittsburgh: 203,622———18. Pittsburgh: 196,687 19. Pittsburgh, PA: 180,725——19. Fort Wayne: 179,646——-19. Madison: 187,566 20. Madison, WI: 161,631——–20. Madison: 178,307————20. Fort Wayne: 166,912 21. St. Paul, MN: 161,329——–21. Toledo: 177,341————–21. Toledo: 164,104 22. Sacramento, CA: 160,599—22. Sacramento: 165,610——22. Sacramento: 159,291 23. Fort Wayne, IN: 157,672—–23. St. Paul: 159,704———–23. St. Paul: 152,558 24. Des Moines, IA: 149,786—–24. Des Moines: 145,937——24. Cincinnati: 143,028 25. Cleveland: 147,359———–25. Cincinnati: 143,120———25. Des Moines: 137,235 26. St. Louis, MO: 143,590——26. Cleveland: 137,977———26. St. Louis: 134,471 27. Cincinnati: 138,486———–27. St. Louis: 134,146———–27. Cleveland: 126,714 28. Akron: 128,976—————-28. Akron: 120,800————–28. Grand Rapids: 114,349 29. Grand Rapids, MI: 113,791—29. Grand Rapids: 104,636—29. Akron: 113,951 30. Orlando, FL: 92,326———–30. Orlando: 96,867————-30. Orlando: 95,876 31. Detroit, MI: 77,163————-31. Dayton: 72,663————–31. Dayton: 71,094 32. Dayton: 67,581—————–32. Providence: 64,284——–32. Detroit: 70,931 33. Providence, RI: 64,223——-33. Detroit: 55,298————–33. Providence: 59,321
Columbus moved from 3rd to 2nd over the period.
Rank by City of Total Black, non-Hispanic Population by Year 2005—————————————–2010———————————2017 1. Chicago: 938,097—————–1. Chicago: 895,294———–1. Chicago: 797,253 2. Detroit: 683,999——————–2. Detroit: 587,707————-2. Detroit: 529,593 3. Milwaukee: 222,040————–3. Charlotte: 251,274———-3. Charlotte: 292,104 4. Cleveland: 221,797—————4. Milwaukee: 230,473——–4. Columbus: 248,476 5. Charlotte: 205,216—————-5. Indianapolis: 226,314——-5. Indianapolis: 236,606 6. Indianapolis: 193,948————6. Columbus: 216,486———6. Milwaukee: 228,720 7. Columbus: 179,197—————7. Cleveland: 208,528———7. Cleveland: 186,073 8. St. Louis: 168,768—————-8. Nashville: 171,104———–8. Nashville: 180,830 9. Nashville: 148,051—————-9. St. Louis: 157,382———–9. St. Louis: 143,761 10. Kansas City: 131,694———-10. Kansas City: 138,461—–10. Kansas City: 138,346 11. Cincinnati: 131,010————-11. Cincinnati: 131,909——–11. Cincinnati: 127,589 12. Pittsburgh: 81,758————–12. Virginia Beach: 79,583—-12. San Antonio: 97,925 13. Virginia Beach: 80,004——–13. San Antonio: 79,307——13. Virginia Beach: 82,181 14. Orlando: 73,736—————–14. Toledo: 75,033————-14. Minneapolis: 75,006 15. Toledo: 72,190——————-15. Pittsburgh: 71,539——–15. Toledo: 74,906 16. Sacramento: 71,452————16. Orlando: 70,988————16. Orlando: 72,796 17. San Antonio: 70,723————17. Minneapolis: 63,749——17. Austin: 69,860 18. Dayton: 60,196——————-18. Sacramento: 61,976——18. Sacramento: 67,305 19. Akron: 59,810——————–19. Austin: 61,833————–19. Las Vegas: 65,663 20. Las Vegas: 59,780————–20. Dayton: 61,402————-20. Pittsburgh: 65,268 21. Austin: 59,583——————-21. Akron: 60,653—————-21. Akron: 61,461 22. Minneapolis: 57,499————22. Las Vegas: 60,187———22. Dayton: 57,043 23. Omaha: 50,333——————23. Omaha: 55,086————-23. Omaha: 56,098 24. Grand Rapids: 40,408———24. Wichita: 42,662————-24. St. Paul: 51,737 25. Wichita: 39,165—————–25. Grand Rapids: 41,848—–25. Wichita: 40,756 26. Fort Wayne: 35,221———–26. St. Paul: 41,923————-26. Grand Rapids: 38,130 27. St. Paul: 34,903—————-27. Fort Wayne: 39,016——–27. Fort Wayne: 37,941 28. Portland: 30,828—————28. Portland: 37,355————28. Portland: 34,624 29. San Jose: 27,446————–29. San Jose: 29,831———-29. San Jose: 28,126 30. Providence: 18,794———–30. Des Moines: 19,962——-30. Providence: 27,274 31. Des Moines: 16,709———-31. Providence: 19,265——–31. Des Moines: 22,170 32. Madison: 12,660————–32. Madison: 17,560————32. Madison: 14,185 33. Lincoln: 7,082——————33. Lincoln: 9,023—————33. Lincoln: 11,487
Columbus moved up from 7th to 4th in total Black, non-Hispanic during the period. Surprisingly, quite a few cities have actually been losing this demographic since 2010 at least.
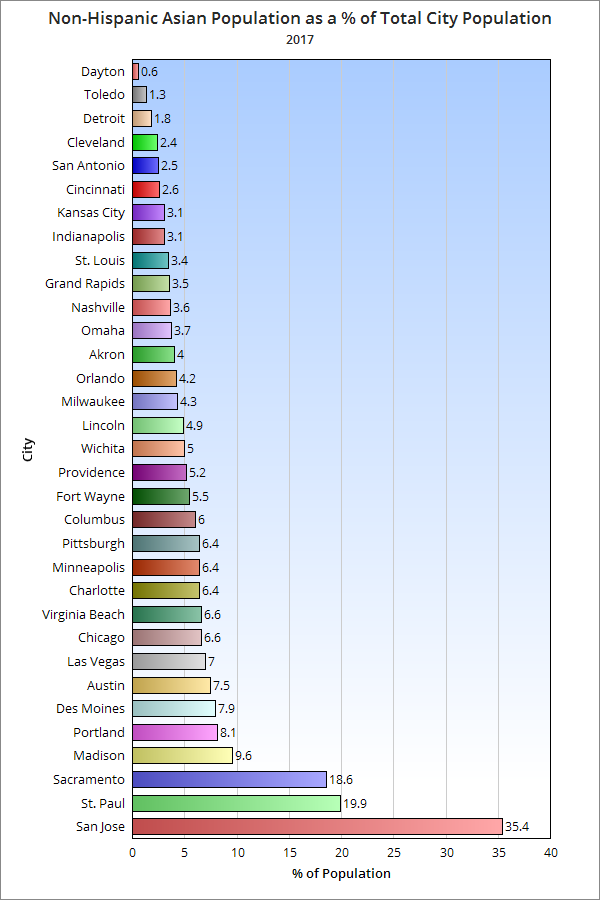
Rank by City of Total Asian, non-Hispanic Population by Year 2005————————————-2010——————————————2017 1. San Jose: 269,186————–1. San Jose: 303,227—————–1. San Jose: 366,134 2. Chicago: 127,686—————-2. Chicago: 148,280——————2. Chicago: 179,176 3. Sacramento: 80,307————3. Sacramento: 84,556————-3. Sacramento: 93,476 4. Portland: 36,278—————–4. Austin: 46,575———————-4. Austin: 71,539 5. Austin: 35,239——————–5. Portland: 43,185——————-5. St. Paul: 61,082 6. St. Paul: 35,184——————6. St. Paul: 41,989——————-6. Charlotte: 55,142 7. Columbus: 27,125—————7. Las Vegas: 37,406—————7. Columbus: 53,027 8. Las Vegas: 25,077————–8. Charlotte: 37,181—————–8. Portland: 52,219 9. Charlotte: 23,356—————-9. Columbus: 35,468—————-9. Las Vegas: 44,735 10. Virginia Beach: 22,501——10. San Antonio: 29,200———–10. San Antonio: 38,119 11. San Antonio: 20,492———11. Virginia Beach: 27,303—–11. Virginia Beach: 29,735 12. Minneapolis: 20,189———12. Milwaukee: 22,670————–12. Minneapolis: 26,833 13. Milwaukee: 19,596———–13. Minneapolis: 21,426————13. Indianapolis: 26,548 14. Nashville: 16,943————-14. Wichita: 19,420——————14. Milwaukee: 25,624 15. Wichita: 15,417—————15. Indianapolis: 17,137————15. Madison: 24,455 16. Madison: 12,708————–16. Nashville: 17,045—————16. Nashville: 24,034 17. Indianapolis: 12,312———17. Madison: 16,671—————-17. Wichita: 19,548 18. Providence: 10,751———-18. Pittsburgh: 12,036————–18. Pittsburgh: 19,357 19. Pittsburgh: 10,727————19. Providence: 11,497————19. Omaha: 17,412 20. Kansas City: 10,674———20. Lincoln: 10,452——————20. Des Moines: 17,143 21. Detroit: 9,577——————21. Kansas City: 10,263———–21. Kansas City: 15,213 22. Des Moines: 8,796———–22. Des Moines: 8,867————-22. Fort Wayne: 14,039 23. Lincoln: 7,513—————–23. St. Louis: 8,717—————–23. Lincoln: 13,992 24. St. Louis: 7,046—————24. Omaha: 8,397——————-24. Orlando: 11,852 25. Omaha: 6,971—————–25. Orlando: 7,870——————25. Detroit: 11,790 26. Cincinnati: 6,874————-26. Fort Wayne: 6,945————–26. St. Louis: 10,404 27. Cleveland: 6,289————27. Detroit: 6,549———————27. Providence: 9,361 28. Orlando: 5,528—————28. Cincinnati: 5,938—————-28. Cleveland: 9,217 29. Fort Wayne: 4,241———-29. Cleveland: 5,392—————-29. Akron: 8,007 30. Toledo: 4,150—————-30. Akron: 4,567———————30. Cincinnati: 7,906 31. Akron: 3,497—————–31. Grand Rapids: 3,695———–31. Grand Rapids: 7,056 32. Grand Rapids: 2,847——32. Toledo: 3,125——————–32. Toledo: 3,679 33. Dayton: 1,827—————33. Dayton: 1,231——————–33. Dayton: 848
Columbus maintained its rank since 2005.
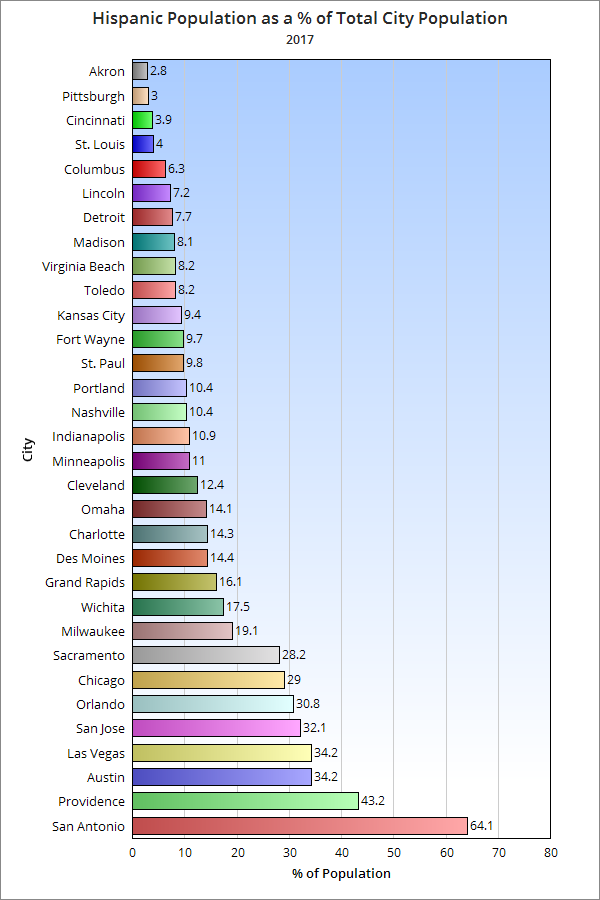
Rank by City of Total Hispanic Population by Year 2005——————————————–2010————————————2017 1. Chicago: 778,234—————1. San Antonio: 853,654———-1. San Antonio: 969,065 2. San Antonio: 735,458———–2. Chicago: 763,968—————2. Chicago: 787,978 3. San Jose: 279,420————–3. San Jose: 318,389————–3. San Jose: 332,603 4. Austin: 223,361——————4. Austin: 288,130——————4. Austin: 324,973 5. Las Vegas: 153,813————5. Las Vegas: 181,923————-5. Las Vegas: 219,220 6. Sacramento: 111,559———6. Sacramento: 124,461———–6. Sacramento: 141,752 7. Milwaukee: 80,945————-7. Milwaukee: 104,619————-7. Milwaukee: 133,812 8. Providence: 60,008————-8. Charlotte: 96,246—————-8. Charlotte: 122,904 9. Charlotte: 58,466—————9. Indianapolis: 78,467————-9. Indianapolis: 93,042 10. Wichita: 49,928—————10. Providence: 76,645————10. Orlando: 86,305 11. Indianapolis: 47,764———11. Nashville: 61,212—————11. Providence: 77,893 12. Detroit: 46,993—————-12. Wichita: 59,823——————12. Nashville: 69,574 13. Orlando: 43,978————–13. Portland: 58,986—————–13. Wichita: 68,389 14. Portland: 43,324————–14. Orlando: 56,061—————–14. Portland: 67,551 15. Omaha: 39,674—————15. Omaha: 53,661——————15. Omaha: 66,056 16. Nashville: 37,463————-16. Kansas City: 49,800————16. Columbus: 55,782 17. Minneapolis: 37,017———17. Detroit: 45,580——————-17. Detroit: 48,328 18. Kansas City: 35,995———18. Columbus: 43,276————–18. Cleveland: 47,962 19. Grand Rapids: 32,368——19. Cleveland: 36,067————–19. Minneapolis: 46,375 20. Cleveland: 32,085———–20. Minneapolis: 34,504———–20. Kansas City: 45,975 21. Columbus: 24,607———–21. Grand Rapids: 30,659——21. Virginia Beach: 36,723 22. St. Paul: 22,402————–22. Virginia Beach: 29,206—–22. Grand Rapids: 32,016 23. Virginia Beach: 20,803—–23. St. Paul: 28,725————–23. Des Moines: 31,333 24. Des Moines: 18,952——–24. Des Moines: 23,832———-24. St. Paul: 30,007 25. Toledo: 18,404————–25. Toledo: 21,346——————25. Fort Wayne: 24,724 26. Fort Wayne: 16,438——-26. Fort Wayne: 19,576————26. Toledo: 22,796 27. Madison: 11,997———–27. Lincoln: 16,007——————27. Lincoln: 21,921 28. Lincoln: 9,672—————28. Madison: 14,062—————28. Madison: 20,741 29. St. Louis: 8,268————-29. St. Louis: 11,207————–29. St. Louis: 12,447 30. Pittsburgh: 5,018———-30. Cincinnati: 8,710—————30. Cincinnati: 11,787 31. Cincinnati: 3,855———–31. Pittsburgh: 7,282————–31. Pittsburgh: 9,212 32. Akron: 3,485—————-32. Akron: 3,990——————–32. Dayton: 5,765 33. Dayton: 1,693————–33. Dayton: 3,180——————-33. Akron: 5,536
Columbus moved up from 21st to 16th in the total Hispanic population.
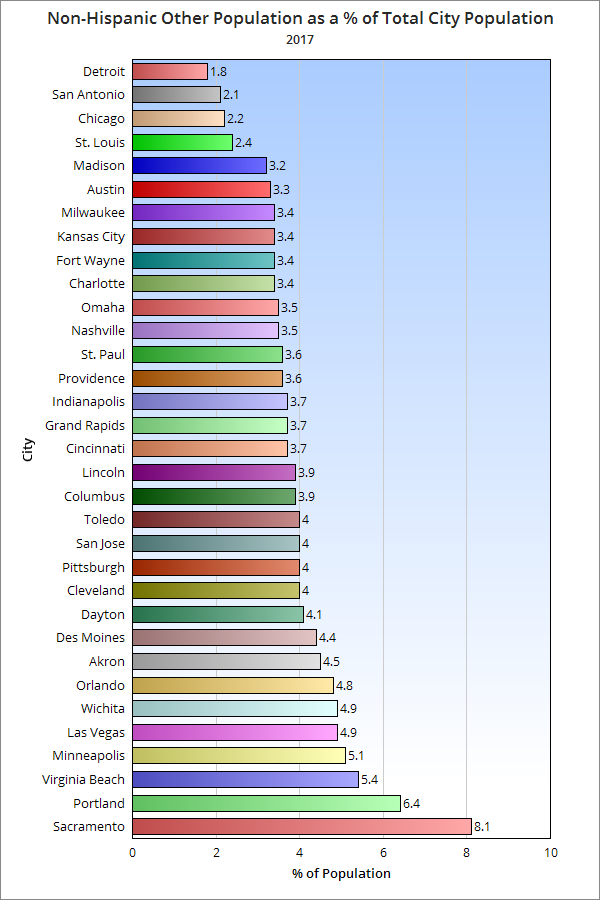
Rank by City of Total Other, non-Hispanic Population by Year 2005——————————————-2010—————————————–2017 1. Chicago: 38,694—————1. Chicago: 37,379——————–1. Chicago: 58,721 2. San Jose: 29,456————2. San Jose: 32,439——————–2. Portland: 41,595 3. Sacramento: 21,370———-3. Sacramento: 30,900—————3. San Jose: 41,175 4. Portland: 21,164————–4. Portland: 28,027———————4. Sacramento: 40,066 5. Indianapolis: 20,242———-5. Las Vegas: 24,521—————–5. Columbus: 34,467 6. Columbus: 20,096————-6. Columbus: 23,738—————–6. Indianapolis: 32,525 7. San Antonio: 19,130———-7. San Antonio: 20,778————–7. Las Vegas: 31,889 8. Minneapolis: 18,580———-8. Minneapolis: 20,753————–8. San Antonio: 31,341 9. Detroit: 18,324—————–9. Virginia Beach: 20,268———-9. Austin: 30,541 10. Las Vegas: 18,304———-10. Indianapolis: 20,086———-10. Charlotte: 28,632 11. Virginia Beach: 16,685—-11. Charlotte: 18,360————–11. Virginia Beach: 24,458 12. Milwaukee: 14,476———-12. Detroit: 16,776—————–12. Nashville: 23,334 13. Kansas City: 13,399——–13. Milwaukee: 16,311———–13. Minneapolis: 21,808 14. Austin: 13,261—————-14. Wichita: 16,091—————14. Milwaukee: 20,166 15. Charlotte: 11,771————-15. Omaha: 15,519————–15. Wichita: 18,763 16. Wichita: 11,545—————16. Austin: 14,915—————-16. Kansas City: 16,743 17. Omaha: 8,552—————–17. Kansas City: 14,668——–17. Omaha: 15,988 18. St. Paul: 7,741—————-18. Nashville: 14,227————18. Cleveland: 15,586 19. Toledo: 7,447—————–19. St. Paul: 13,098————–19. Orlando: 13,429 20. Cincinnati: 7,315————-20. Pittsburgh: 11,280———–20. Detroit: 12,461 21. Cleveland: 7,004————-21. Toledo: 10,134—————21. Pittsburgh: 11,890 22. Providence: 6,488———–22. Akron: 9,020——————22. St. Paul: 11,220 23. Pittsburgh: 6,138————23. Fort Wayne: 8,513———–23. Fort Wayne: 11,180 24. St. Louis: 6,058————–24. Cleveland: 8,276————-24. Lincoln: 11,037 25. Fort Wayne: 5,774———-25. St. Louis: 7,704————–25. Toledo: 11,009 26. Orlando: 5,731—————26. Lincoln: 7,483—————-26. Cincinnati: 10,995 27. Nashville: 5,687————-27. Grand Rapids: 7,376——–27. Des Moines: 9,627 28. Madison: 4,708————–28. Orlando: 7,251—————28. Akron: 8,894 29. Lincoln: 4,508—————-29. Cincinnati: 7,230————29. Madison: 8,292 30. Akron: 4,431—————–30. Madison: 7,177————–30. St. Louis: 7,543 31. Grand Rapids: 4,154——31. Providence: 6,471———–31. Grand Rapids: 7,260 32. Des Moines: 2,674———32. Des Moines: 5,598———-32. Providence: 6,539 33. Dayton: 1,382—————33. Dayton: 3,025—————-33. Dayton: 5,629
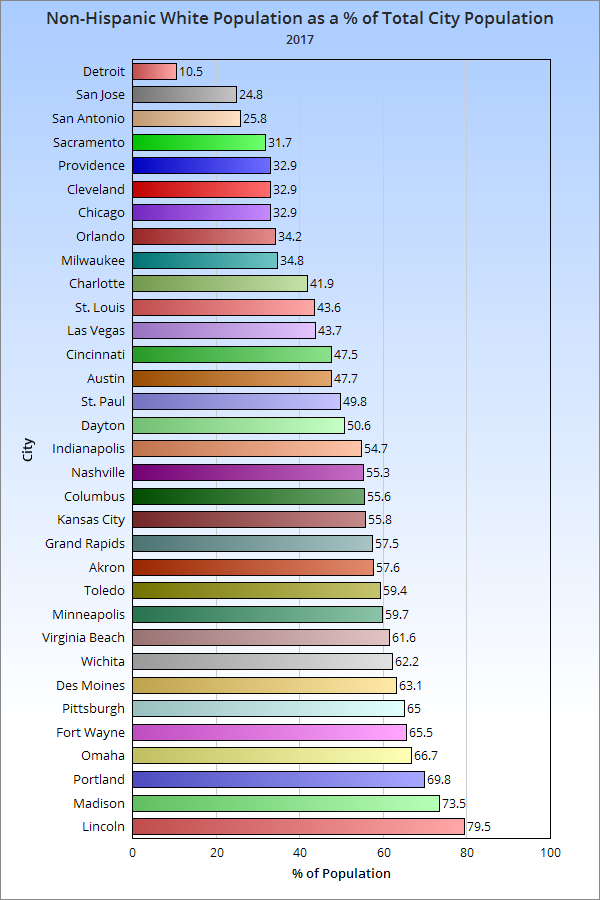
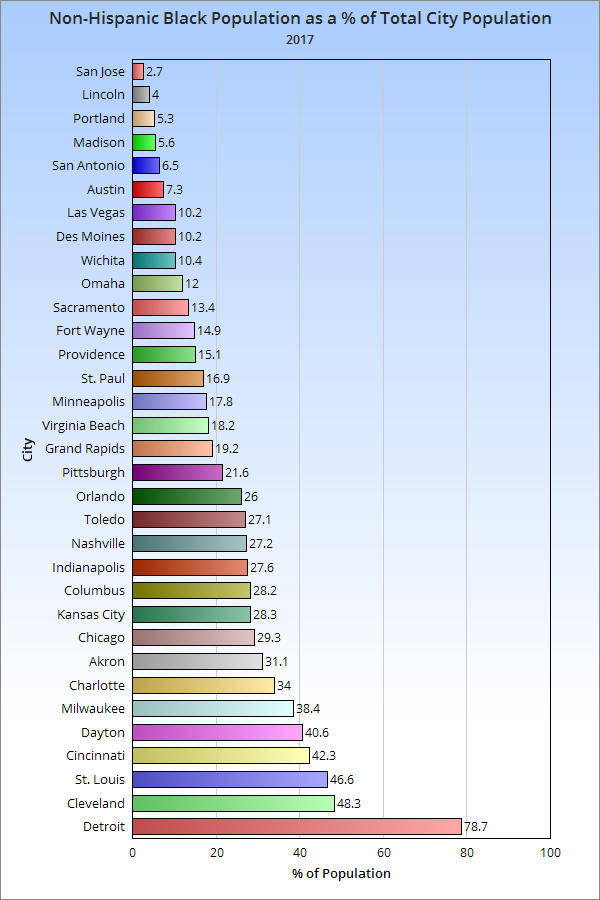
Finally, Columbus moved up from 6th to 5th in the total of Other, non-Hispanic population. Overall, Columbus ranks fairly well in totals vs. its peers, as one might expect given that it is one of the largest cities in the grouping. However, to truly find out how it compares with these other cities, you have to look at percentages, which tells how much of the city’s population is made up of each group. Columbus ranks in the middle of the pack for its % of Non-Hispanic White population. Like in most cities, even while this demographic is growing in total numbers in Columbus, the % of total population continues to fall. Columbus ranked in the top 3rd of peer cities for its % of Non-Hispanic Black population. Columbus also ranked in the top 3rd for its Non-Hispanic Asian population. Columbus ranks poorly with Hispanics in the group, ranking near the bottom. Finally, Columbus ranks in the middle for its Non-Hispanic Other population.
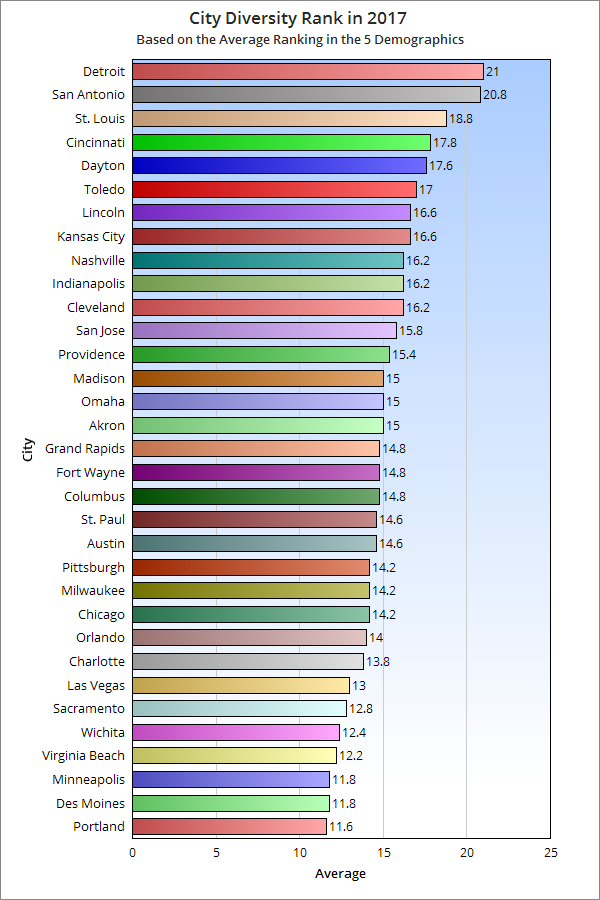
So what’s the final ranking for where Columbus is with diversity compared to its peers in 2017? To find out, I assigned points based on ranked position in each 5 racial categories and took the average of the positions in each 5. The result is that the higher the average number, the lower the overall diversity. So based on this, Columbus ranks in the top half of national and Midwest peers for diversity.
*Note: Normally, Youngstown would be included, but the data was not available.