In this short edition of Strange Columbus Things, we look at Ohio’s atomic bomb evacuation routes.
Back in the 1950s, many were still grappling with the implications of the birth of the Atomic Age. The US was busily testing bombs both on and outside of US soil, and souring relationships with international adversaries presented the threat of nuclear war. In March, 1955, the director of Ohio’s Civil Defense, Major General Leo M. Kreber, release evacuation routes for Ohio’s major cities should an attack take place.
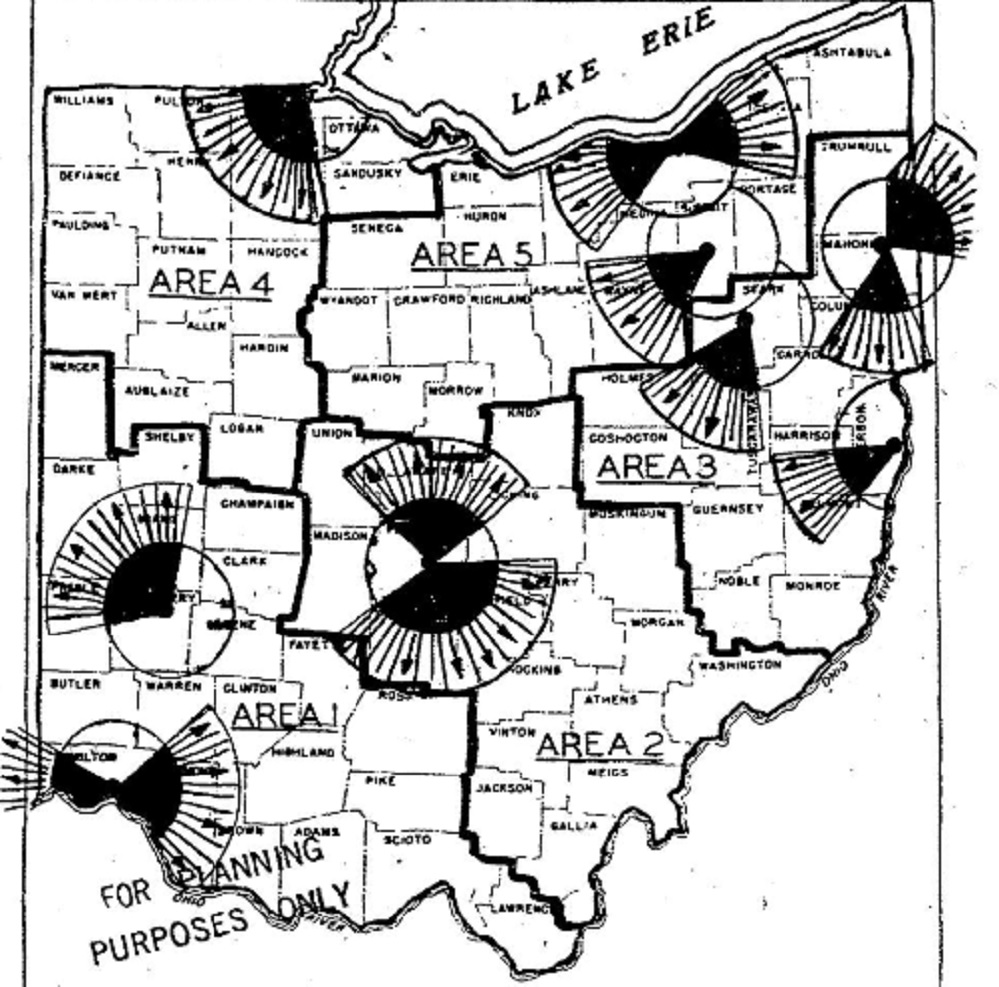
For Columbus, it was either north or south. In the description of why these directions are preferred, it was suggested that it was to prevent conflict with evacuees from the Dayton area to the west, but in reality, the truth is much darker.
In the event of a nuclear attack, it wouldn’t just be Columbus. Dayton and Cincinnati would also be hit, and due to prevailing winds in this part of the world, fallout would generally move eastward. Therefore, the safest routes were thought to be up towards Morrow County or south and southeast towards Hocking County.
The logic hasn’t changed much in the past 70 years. North and south would still be the safest evacuation routes. However, evacuation from targeted locations would only offer temporary refuge. The cruel reality is that in the event of a true, global nuclear war, few places anywhere on the planet would be left unscathed. If not destroyed by bombs or irradiated by fallout, nuclear winter would bring incredibly devastation to most of the planet, even those completely untouched by bombs.
As true today as it was in 1955, the only way to really be safe is for no one to ever push the button.
To continue looking into local history, visit the history links page or Ohio’s role in the atomic bomb’s creation, Ohio History Central offers additional information.