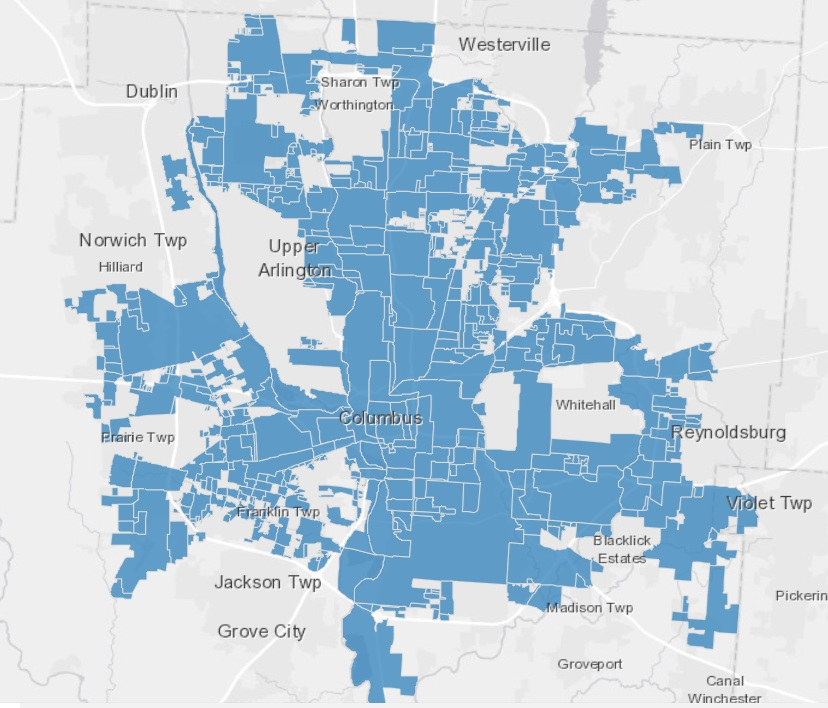
This interactive map on Columbus annexation history gives detailed information on every single annexation the city has done since the 1830s. Columbus annexation has been generally slowing down over the years, particularly since the 1970s, but it still happens once in a while. This map provides a great source for seeing exactly how Columbus has grown over its history.
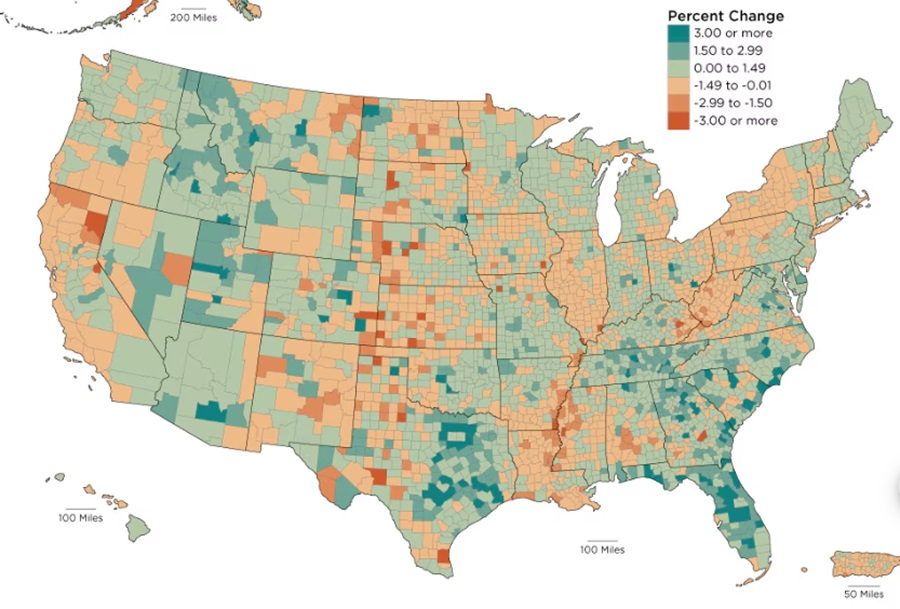
National county map for 2022-2023 population change.
I haven’t done an annual population estimates post since before the 2020 Census. This is because the pandemic- and political actions- screwed up counting quite a bit, and I haven’t felt confident in posting them. The 2023 county and metro population estimates have just been released., and since 3 years have gone by since the census, perhaps some of the kinks have been worked out. That said, the news isn’t all that great for Ohio and Columbus.
Prior to 2020, Franklin County was the fastest-growing county in the state by total growth. Since 2020, it’s fallen to 10th. While that may not seem that bad, only 30 of Ohio’s 88 counties have even seen growth since 2020. On the bright side, Franklin was the only major urban county in the state to see any growth at all. The majority of the 30 counties that saw growth in the state were metro suburban counties, including 8 of the 9 suburban counties within the Columbus Metro Area. Lingering effects of the pandemic are at least partially responsible for this shift, as some people sought to leave highly-populated areas, but wanted to otherwise remain close to core cities. Another factor is likely the ongoing housing shortage. Housing just isn’t getting built in Franklin County like it was before, which is continuing to cause price increases, making the area less affordable than it used to be. Additionally, extreme state politics may be driving some people away- or stopping them from moving locally altogether.
Still, the news isn’t all bad. The total Columbus metro population growth is gradually improving. From 2020-2021, the metro change was +7,986, 2021-2022 it was +14,560, and from 2022-2023, it was +18,205. Still a far cry from the pre-pandemic period when annual totals were 25K-30K. Hopefully, the upward trend continues through the rest of the decade.
Now that we know that overall population change, let’s take a closer look at the specific components of change since 2020.
Top 10 Counties by Natural Change 2020-2023 1. Franklin: +18,738 2. Hamilton: +4,233 3. Delaware: +2,072 4. Holmes: +1,309 5. Union: +662 6. Butler: +652 7. Warren: +650 8. Mercer: +543 9. Putnam: +86 10. Shelby: +67 Incidentally, only these 10 counties saw positive net natural change 2020-2023. That’s a terrible statistic for Ohio’s counties. Columbus’ 3 counties in the top 10 provided more natural change than all other 85 counties combined.
Top 10 Counties by Domestic Change 2020-2023 1. Delaware: +13,998 2. Warren: +7,424 3. Union: +6,011 4. Lorain: +5,969 5. Fairfield: +5,932 6. Licking: +4,592 7. Clermont: +3,117 8. Pickaway: +2,783 9. Miami: +2,433 10. Medina: +2,018 Again, Columbus metro counties- aside from Franklin- do relatively well here, with half of the top 10.
Top 10 Counties by International Migration Change 2020-2023 1. Franklin: +20,391 2. Cuyahoga: +8,557 3. Hamilton: +7,037 4. Butler: +3,551 5. Montgomery: +2,885 6. Summit: +2,593 7. Warren: +1,821 8. Delaware: +1,557 9. Lucas: +1,237 10. Greene: +839 Franklin again leads the pack and is generally doing better annually this decade than before the pandemic, the lone bright spot in the numbers.
Finally, here were the overall metro changes, both for 2022-2023 and 2020-2023.
2023 Total Metro Area Population 1. Cincinnati: 2,271,479 2. Columbus: 2,180,271 3. Cleveland: 2,158,932 4. Dayton: 814,363 5. Akron: 698,398 6. Toledo: 600,141 7. Youngstown: 425,969 8. Canton: 399,474 Columbus continues to leave Cleveland behind and close the gap with Cincinnati.
2022-2023 Metro Area Population Change 1. Columbus: +18,205 2. Cincinnati: +12,854 3. Dayton: +1,649 4. Akron: +887 5. Canton: +3 6. Toledo: -378 7. Youngstown: -679 8. Cleveland: -1,769
2020-2023 Metro Area Population Change 1. Columbus: +41,330 2. Cincinnati: +21,698 3. Dayton: +313 4. Canton: -2,106 5. Akron: -3,827 6. Youngstown: -4,707 7. Toledo: -6,100 8. Cleveland: -26,795
Issue 1 was a contentious, controversial proposal to make it harder for Ohioans to make changes to the state constitution. After a short campaign season, it would go on to defeat by just over 14 points- 57.01% to 42.99%. I provided a state county map with the results on the new Special Issues page. But what were the Issue 1 results in Franklin County and its precincts, specifically?
Today’s Cool Link provides the answer with a precinct map of the county. The map shows the results of Issue 1 for every single precinct, ward or city in Franklin County.
Based on the map, here were the overall margins for all the places in the county. Negative numbers are No wins, and positive numbers are Yes wins. 1. Bexley: -74.35 2. Grandview Heights: -71.19 3. Riverlea: -70.04 4. Marble Cliff: -69.02 5. Urbancrest: -64.16 6. Minerva Park: -63.1 7. Worthington: -61.94 8. Columbus: -61.8 9. Clinton Township: -58.32 10. Upper Arlington: -51.55 11. Sharon Township: -50.76 12. Mifflin Township: -46.54 13. Perry Township: -45.32 14. Whitehall: -43.97 15. Gahanna: -42.54 16. New Albany: -42.43 17. Hilliard: -41.09 18. Blendon Township: -39.79 19. Truro Township: -37.93 20. Reynoldsburg: -36.32 21. Jefferson Township: -36.29 22. Westerville: -36.0 23. Dublin: -35.71 24. Norwich Township: -27.9 25. Valleyview: -26.32 26. Canal Winchester: -18.14 27. Madison Township: -17.75 28. Groveport: -16.1 29. Obetz: -14.03 30. Grove City: -13.66 31. Prairie Township: -11.44 32. Plain Township: -9.12 33. Washington Township: -7.5 34. Franklin Township: -6.7 35. Brown Township: -2.58 36. Pleasant Township: +9.2 37. Jackson Township: +13.71 38. Hamilton Township: +15.04 As we can see, almost no part of the county voted Yes except for a few rural townships on the far south side. Not a single suburb voted yes, including in more conservative suburbs like Grove City and Canal Winchester. This suggests there was a lot of bipartisan opposition within the county.
Columbus city officials have been working on updating zoning codes for more than a year. In many cases, the codes haven’t been updated since the 1960s or earlier, when priorities were significantly different than they are now. Developers wanting to build more density in neighborhoods and even along high-traffic corridors are often forced to go through lengthy and expensive variance requests. This raises costs for projects- and ultimately rents- and prevents the necessary density to address the long-standing housing shortage. The zoning change code map link below shows the initial areas that could see updates.
The focus areas of the update- at least in the first phase, are detailed on the following map: Zoning Code Change Focus Areas
The first phase largely looks at the city’s main corridors. Later phases will look at updates in all neighborhoods. Although no specific changes have been confirmed as of yet, it’s possible that the city may do away with single-family exclusionary zoning. What this means is that, outside of historic areas, neighborhoods won’t be limited to single-family housing restrictions. Higher density projects, including doubles and multi-family projects, would be allowed in places where they are not essentially off-limits. Other changes may include reducing or eliminating parking minimums and significantly raising height restrictions.
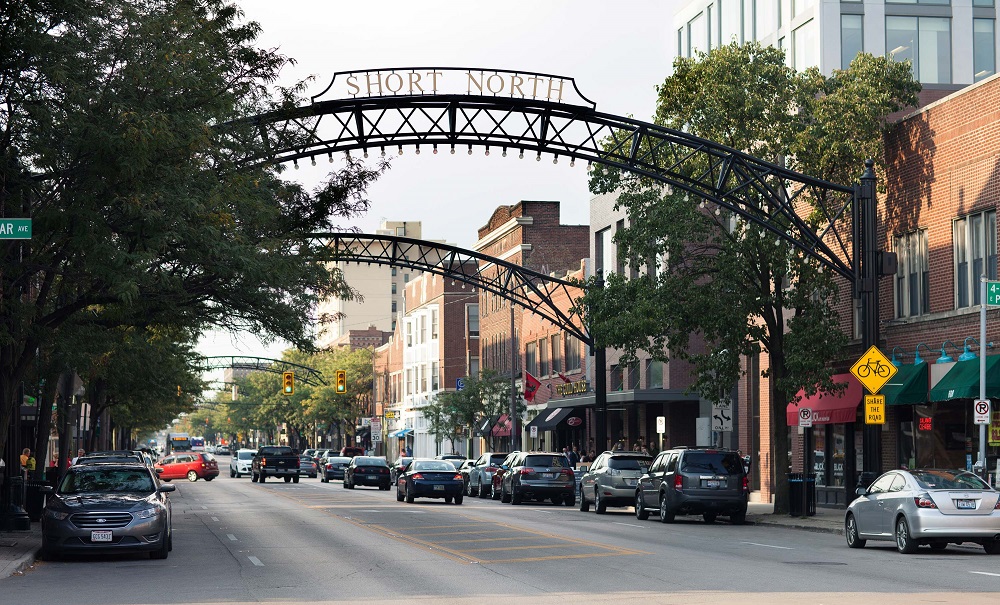
There’s been a lot of media attention to recent shootings in the Short North this year. It’s supposedly gotten so bad, that Mayor Ginther has asked local businesses in the neighborhood to close by Midnight. But has the violence really spiraled out of control, especially compared to other areas in the city. Is the Short North dangerous now? Or is the area just getting more attention due to its status as a hot neighborhood popular with locals and tourists alike?
First, let’s take a look at homicides and homicide rates across Franklin County by Census Tract. The numbers are through May 17th and the rates are total homicides divided by the 100K people per tract.
The first thing that sticks out is that the map has a whole lot of white areas, meaning most of the county and most of Columbus have seen zero homicides so far this year. The areas that have seen them do not appear to be much different than previous years- Hilltop, the Far West, the Near South, parts of Linden, and Northland. The Short North has had 1 homicide this year, which is certainly more than normal, but arguably not an epidemic even if gun violence overall is up. The other thing that sticks out is that most homicides are occurring in relatively small areas, and are often tied to certain streets or even certain businesses or residential complexes.
Using this map, we’ll next take a look at the overall homicide rates of specific neighborhoods and areas in and around Columbus to see where the whole of the Short North really ranks.
The ranking gives the neighborhood, how many tracts make it up, the 2020 population, total homicides and the homicide rate per 100,000 people. 1. Franklinton- 3 Tracts- 6,482- 3 Homicides- 46.28 Franklinton is still the most dangerous part of Columbus, and it’s really not even close. This is despite significant redevelopment in the neighborhood. 2. Near South- 13 Tracts- 35,026- 7 Homicides- 19.99 The Near South comes in a distant 2nd place. It includes a much larger area than Franklinton, but about half of the homicides occurred in the 3 tracts to the southeast of Nationwide Children’s Hospital. Places like German and Merion Village have had none. 3. Weinland Park- 2 Tracts- 6,393- 1 Homicide- 15.64 It seems a little unfair to rank Weinland Park 3rd when it’s only had a single homicide, but that’s just how the math works out. The single homicide has been lumped in with the Short North by some media, but it occurred well north across from Campus. 4. Near East- 9 Tracts- 21,841- 3 Homicides- 13.74 The Near East Side ranks 4th for the year so far. It’s been somewhat quieter than normal in this part of the city. 5. Linden- 14 Tracts- 41,627- 5 Homicides- 12.01 Similar to the Near East, Linden has been a bit more quiet than normal despite the relatively bad year Columbus is having. 5. Hilltop- 16 Tracts- 68,045- 8 Homicides- 11.76 Hilltop has had the 2nd most homicides of any of the neighborhoods looked at, but it’s also one of the largest and highest-populated as well, so the rate was lower than those above. 6. Northland- 18 Tracts- 89,165- 9 Homicides- 10.09 Northland has had the most homicides so far of any area of the city or county. Like Hilltop, however, its higher population means its rate is still relatively lower. 7. Short North- 4 Tracts- 12,472- 1 Homicide: 8.07 The Short North’s single homicide puts the neighborhood in 7th place overall. The rate itself is only slightly above that of the entirety of Columbus, so it doesn’t seem to be much of an outlier. 8. Far West- 11 Tracts- 51,308- 3 Homicides- 5.85 The Far West is the only neighborhood looked at that is entirely outside of I-270. It’s rate is only about 60% of the overall Columbus rate at this point in the year. 9. OSU Campus- 12 Tracts- 55,281- 2 Homicides- 3.62 Another large and heavily-populated area, the Campus neighborhood has been fairly safe so far this year. 10. Downtown- 5 Tracts- 12,297- 0 Homicides- 0.0 Downtown has had no homicides so far this year, a departure from last year in which it had already seen 1 at this point on its way to a total of 4 for 2022. 11. Whitehall- 8 Tracts- 23,054- 0 Homicides- 0.0 Another area I think that has had a somewhat negative reputation for crime is Whitehall, the only non-Columbus area looked at. It’s also had no homicides so far this year.
Overall, the neighborhoods above have accounted for 42 of the 65 total homicides so far this year, or about 65%. Most of the rest were very scattered.
So is the Short North dangerous? Not in terms of homicides, no, but that doesn’t mean that recent crime trends should be ignored. That said, it’s pretty clear other neighborhoods are much more deserving of attention in this regard, but may not have the economic or social clout to demand it. Of course, it also needs to be said that homicides are just a single type of crime. An examination of other types of crime may show a completely different story, but those other types rarely get the kind of breathless, hyperbolic reporting that homicides do.