The number is based on the dissimilarity index, with 0 being the most racially integrated and 100 being the most racially segregated. They are for the entire metro area’s census tracts.
Most to Least Segregated Metros in 1970 1. Cleveland: 88.3 2. Dayton: 86.5 3. Toledo: 84.3 4. Cincinnati: 80.8 5. Columbus: 79.2 6. Youngstown: 77.2 7. Akron: 76.8 8. Canton: 74.4
So in 1970, it’s pretty clear that all of the metros were very segregated, with Cleveland, surprisingly, being the most segregated of the bunch.
Most to Least Segregated Metros in 2010 1. Cleveland: 72.1 2. Cincinnati: 66.4 3. Youngstown: 64.9 4. Dayton: 62.9 5. Toledo: 62.7 6. Columbus: 59.2 7. Akron: 57.3 8. Canton: 53.0
Fast forward 40 years and they’ve all become less segregated. Cleveland is still the worst and Canton is still the best. Every other metro has shifted positions. Columbus dropped a spot.
Change from 1970-2010, Best to Worst 1. Dayton: -23.6 2. Toledo: -21.6 3. Canton: -21.4 4. Columbus: -20.0 5. Akron: -19.5 6. Cleveland: -16.2 7. Cincinnati: -14.4 8. Youngstown: -12.3
Dayton has seen the biggest improvement, Youngstown the least.
Columbus City Civilian Labor Force January 2012: 422,500 Civilian Labor Force December 2012: 426,600 Yearly Change: +4,100 Employment January 2012: 392,700 Employment December 2012: 403,800 Yearly Change: +11,100 Unemployment January 2012: 29,800 Unemployment December 2012: 22,700 Yearly Change: -7,100 Unemployment Rate January 2012: 7.1% Unemployment Rate December 2012: 5.3% Yearly Change: -1.8%
Franklin County Civilian Labor Force January 2012: 617,700 Civilian Labor Force December 2012: 623,900 Yearly Change: +6,200 Employment January 2012: 574,400 Employment December 2012: 590,600 Yearly Change: +16,200 Unemployment January 2012: 43,300 Unemployment December 2012: 33,300 Yearly Change: -10,000 Unemployment Rate January 2012: 7.0% Unemployment Rate December 2012: 5.3% Yearly Change: -1.7%
City and County numbers are rounded.
Columbus Metro Area Civilian Labor Force January 2012: 949,737 Civilian Labor Force December 2012: 958,689 Yearly Change: +8,952 Employment January 2012: 880,680 Employment December 2012: 906,886 Yearly Change: +26,206 Unemployment January 2012: 69,057 Unemployment December 2012: 51,803 Yearly Change: -17,254 Unemployment Rate January 2012: 7.3% Unemployment Rate December 2012: 5.4% Yearly Change: -1.9%
Metro Area Continued Non-Farm Jobs January 2012: 927,300 Non-Farm Jobs December 2012: 962,300 Yearly Change: +35,000
Metro Yearly Jobs Changes by Industry Mining/Logging/Construction: +2,400 Manufacturing: +1,300 Trade/Transportation/Utilities: +10,700 Information: -100 Financial Activities: +1,800 Professional and Business Services: +4,400 Education and Health Services: +5,700 Leisure and Hospitality: +6,100 Other Services: +700 Government: +2,000
Ohio Overall Civilian Labor Force January 2012: 5,780,410 Civilian Labor Force December 2012: 5,728,748 Yearly Change: -51,662 Employment January 2012: 5,339,657 Employment December 2012: 5,344,151 Yearly Change: +4,494 Employment January 2012: 440,753 Employment December 2012: 384,597 Yearly Change: -56,156 Unemployment Rate January 2012: 7.6% Unemployment Rate December 2012: 6.7% Yearly Change: -0.9%
These monthly updates do not include all ongoing projects, but just updates on the most significant or those that have recently made news. To see the full list, check out the Columbus Development page.
Downtown 1. The ongoing Neighborhood Launch expansion continues The current expansion includes a pair of 5-story buildings along E. Long Street at N. 5th. The two buildings will contain about 260 new apartments. The foundations are mostly complete and the buildings are now going vertical. The former Faith Mission at 315 E. Long will be renovated and converted into an event and meeting space for new residents of the project. 2. Construction continues on the High Point residential project at Columbus Commons. Just over 300 apartments as well as ground floor retail and a handful of park-side restaurants will be included once complete. Work is well underway on the 2nd story of these twin 6-story buildings. 3. An application for architectural review has been submitted to the downtown commission for Discovery Commons, a 5-story residential project at E. Spring and Neilston that will include 102 apartments and 70 underground parking spaces. This project has been floating around for over a year, so the recent submission suggests this may finally start to move forward. 4. The historic corner building at 101 S. High Street was recently announced to be renovated into mixed-use. The 4-story building will have Heartland Bank take over the bottom floor with the top 3 floors being residential. No word on how many units it would be, but the renovation is expected to start later this year. 5. The Hills Market at 96 Grant Avenue finally opened a few weeks ago after long construction delays put off the original opening date by almost 4 months. 6. The Atlas building will finally begin its renovation and conversion to 186 apartments and ground-floor retail later this spring. Historic preservation credits were issued for the building at 8 E. Long Street earlier this year. 7. Renovation and expansion of the old Police HQ building at N. Ludlow and W. Gay is nearing completion. The building will allow consolidation of local offices from other buildings. The fate of the vacated buildings nearby remains unannounced. 8. The LeVeque Tower’s renovation and conversion to mixed-use continues. A hotel, offices and several dozen residential units are in the works once complete later in the year. 9. The Columbus Metropolitan Library Main Branch at S. Grant and E. Town Streets recently announced purchase and expansion plans for the adjacent old Deaf School. Construction should begin sometime this year.
Detailed lists of present, past and future Columbus development are included on the Development page.
The US Census released the latest population estimates for metropolitan/micropolitan areas as well as counties for the year July 1, 2012 to July 1, 2013. Here is what they found for Columbus and Ohio metros.
Columbus leads the pack, and by a lot. Some interesting notes about these numbers is that half of the 8 major metros are growing. Also of significance is that Cleveland barely lost at all, which may indicate that the losses there are slowing down.
Now let’s take a look at where the population changes for these metros are coming from.
Natural growth is a vital part of the growth picture for any place. For Columbus, it is roughly 50% of it’s total annual growth. For places like Youngstown, with more deaths than births, it just contributes to overall decline.
The 2nd most important part of the growth rate, migration, is also pretty bad for most metros. Only Columbus is seeing a decent rate of growth, particularly domestically.
One final question is… how are these metro growth rates changing over time? That’s a bit harder to answer, as metro boundaries change so often that it’s more difficult to determine comparable rates decade to decade. However, this is what I came up with.
*Some photos have been updated since the time of the original post.
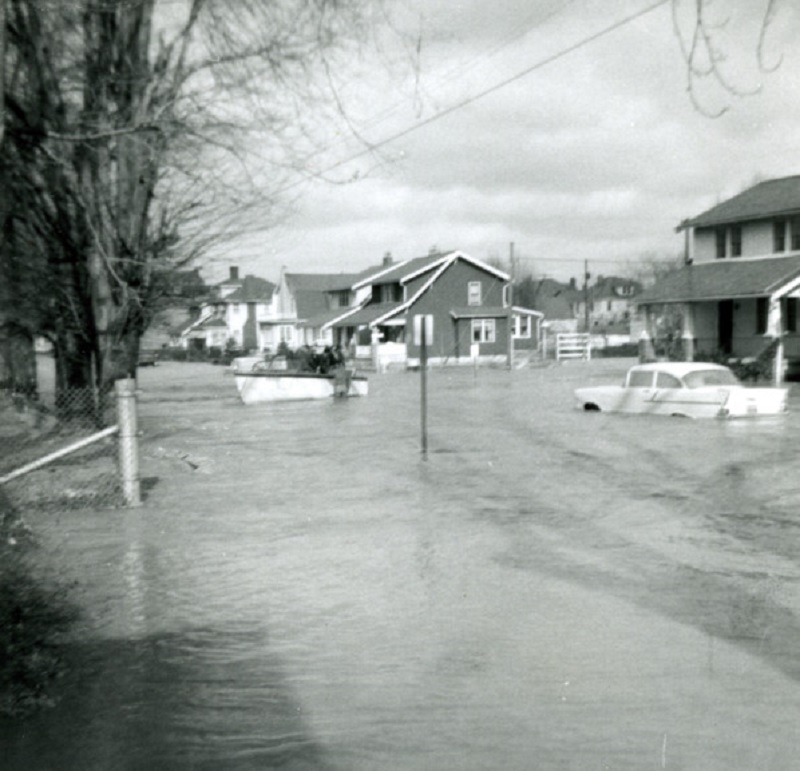
Before: South Central Avenue, looking north, during the flood of January 21-24, 1959. After: 2015 The 1959 flood was the 2nd worst in the history of Franklinton after the 1913 disaster. The Frank Road crest on the Scioto River came on January 22, 1959 and was 27.22 ft, 3.22 ft above flood stage and a few feet below the 1913 crest. This crest would not cause serious flooding in Franklinton today, as the Franklinton Floodwall, completed in 2004, will protect the area to crests of up to 30.9 ft. Few people know that, prior to the wall’s completion, federal guidelines prohibited almost all types of construction in Franklinton, a contributing factor in the gradual decline it faced after the 1950s.
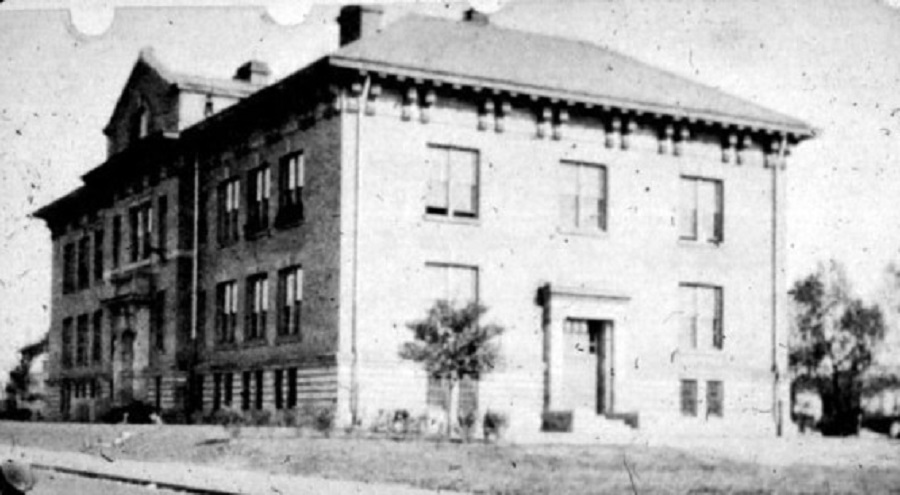
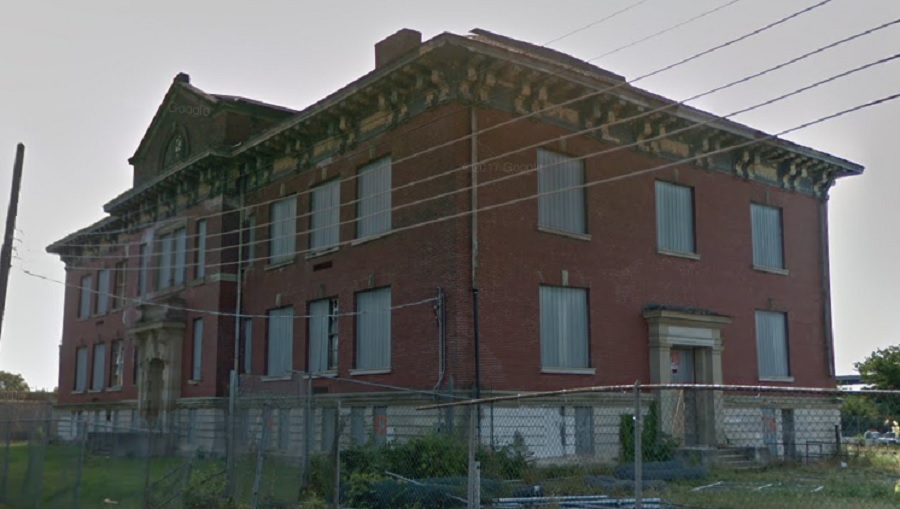
Before: Bellows Avenue Elementary on Bellows Avenue in 1922. After: 2017 Bellows Elementary was opened in 1905 and barely escaped destruction during the I-70/315 highway construction. The building remained a school through the 1970s before closing and being sold by the city in 1984. It has remained vacant since then. Recent proposals to turn it into apartments, particularly as Franklinton has begun a massive revitalization, and the building has received a new roof, so further deterioration has been stopped for now. The building, however, is threatened by possible demolition once the 70/71 split is reconstructed in sometime in the mid-2020s.
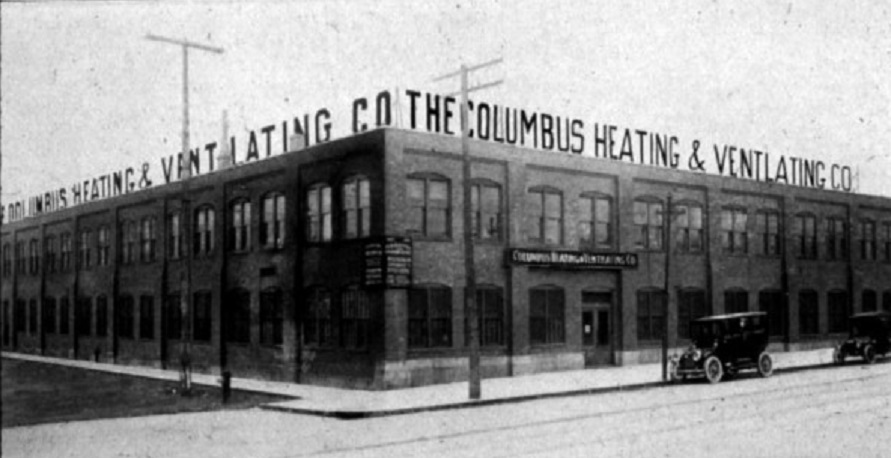
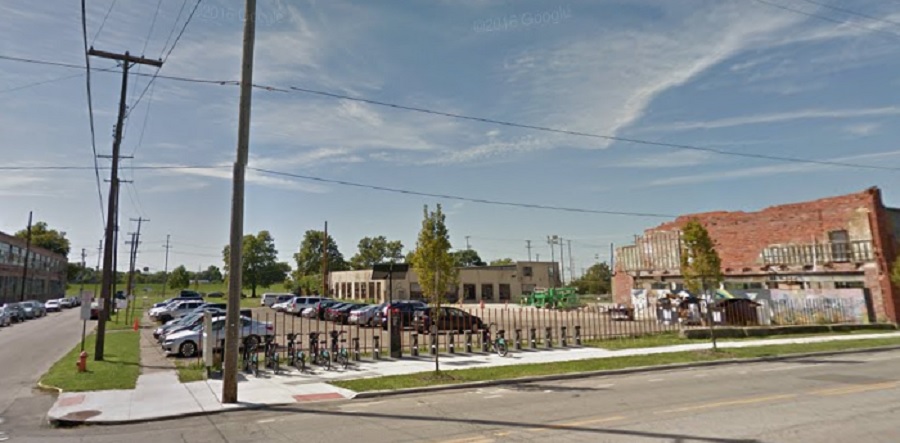
Before: The Columbus Heating and Ventilation Company building at 433 W. Town Street in 1916. After: 2016 The Columbus Heating and Ventilating Company began in 1903 and still exists in the city, although obviously not at its original location. It later served as factories and parts of the complex were even used to enrich uranium for the Manhattan Project. The old building eventually went into severe disrepair and most of the roof had collapsed by the time it was demolished in 2011 as one of the first steps in the area’s rebirth. Multiple redevelopment plans have come and gone for the site, but so far, nothing has come of them.
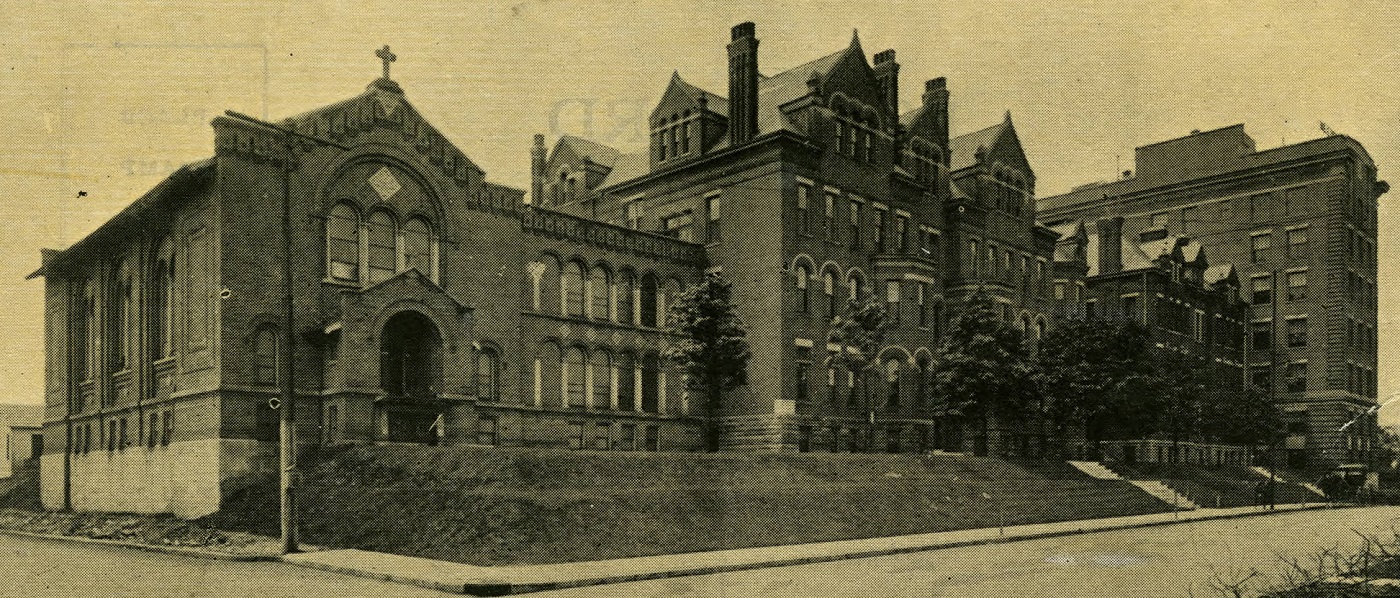
Before: Mt. Carmel Hospital, looking southwest on Davis, in 1909. After: 2018 Mt. Carmel was originally known as Hawkes Hospital. The first section was completed in 1886, with later expansions in 1891 and 1908. Eventually, the old structures were deemed outdated for modern hospital purposes, and the entire complex was demolished in the late 1940s. Today, the site is very different, with the current buildings built on top of the old Davis and State Street intersection. The hospital moved most services to a new location in Grove City in recent years, with plans to demolish part of the complex to create a new mixed-use development.
For thousands more before and after photos from all parts of the city, click here: Historic Building Database