
The Impact of Immigration on the Housing Market
For this link, you can zoom to county level and see the housing impact of immigration. Basically, the more immigration, the greater the impact.

The Impact of Immigration on the Housing Market
For this link, you can zoom to county level and see the housing impact of immigration. Basically, the more immigration, the greater the impact.
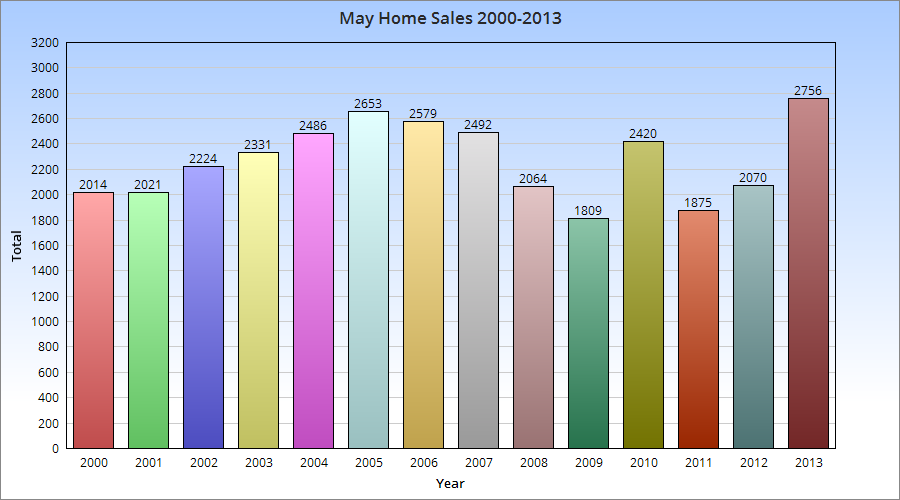
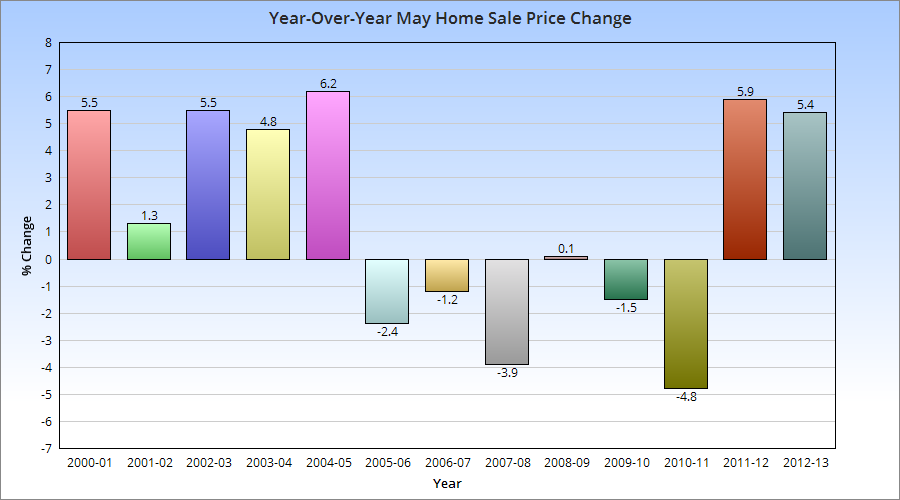
May home sales set a record for the month.
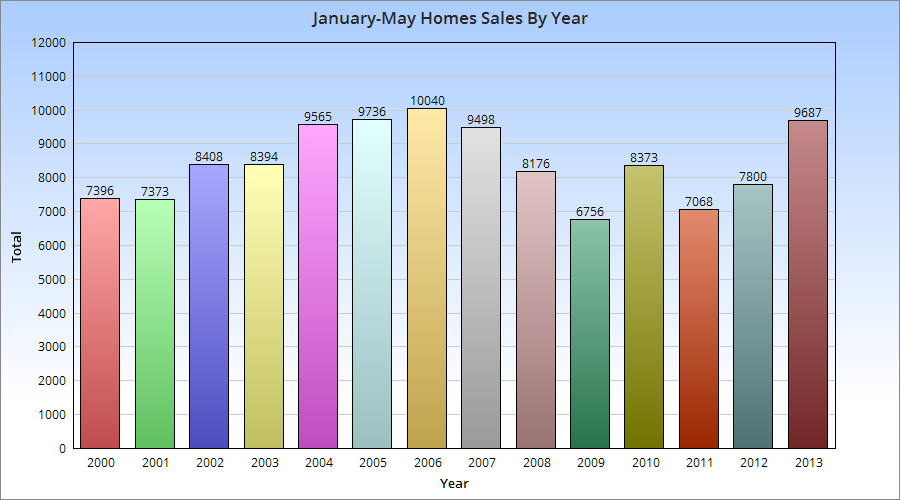
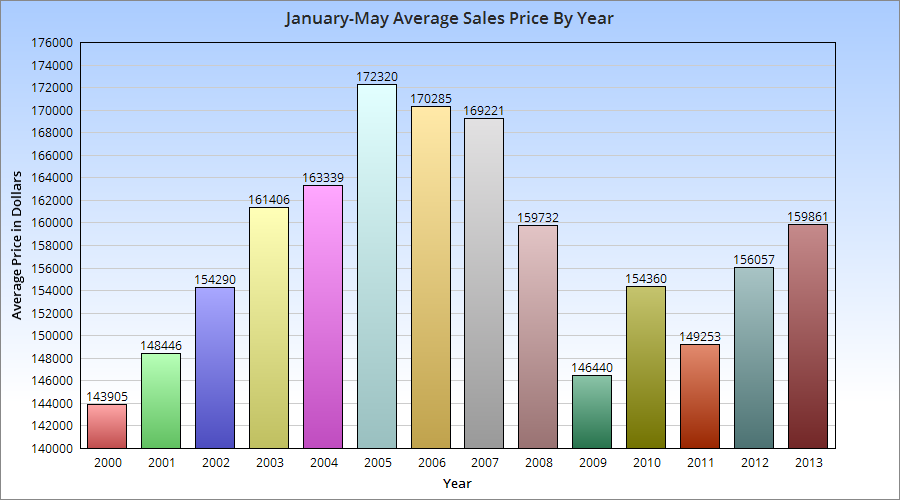
Through May, total sales are also way up, and were the 2nd highest for the 2000-2013 period.
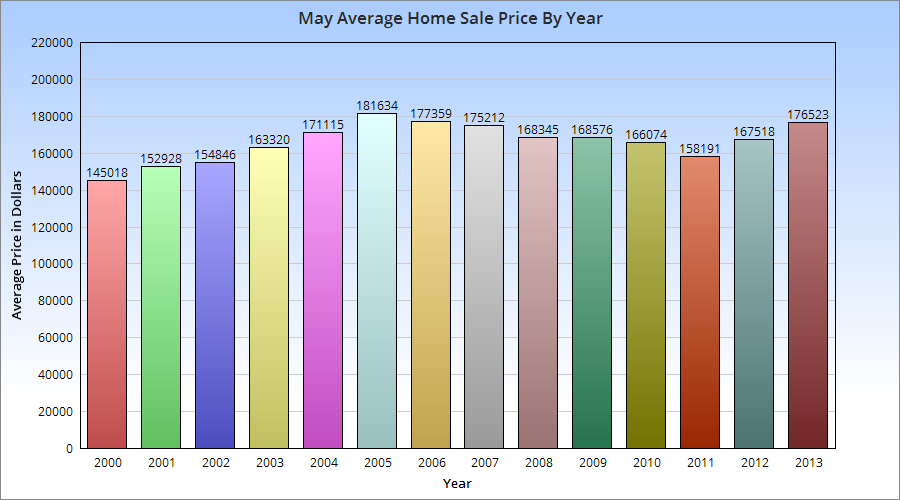
The average May home sales price was the highest since 2006.
The average January-May sales price was also up.
To me, all this shows is that after the Recession’s downturn, housing in the Columbus area is seeing a strong recovery. In some cases, the recovery is already surpassing the market that existed pre-Recession.
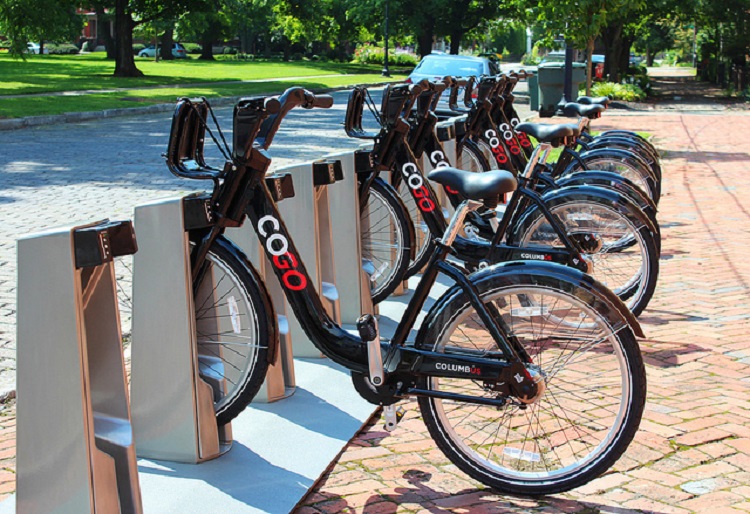
This map shows the location of every bike share system in the world. The map gives data on system size, bike availability at stations, station totals and locations. You can even pull up ridership reports and run animations! Columbus will be getting a bike share system that opens in July, so expect it to show up on this map in the coming months!
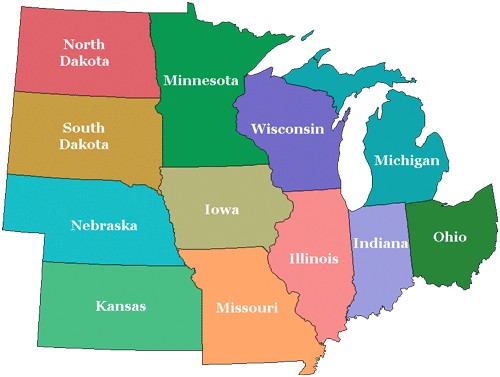
One of the more interesting things the Census measures is the population from “City Hall”, or basically the metro population by distance from downtown. The metric measure population at every mile out from the center of each city’s downtown area. Since city boundaries come in all different sizes, this is a good way to compare urban populations.
I looked at the 15 largest Midwest metros for these numbers.
First, here is a breakdown of aggregate population at each mile marker in 2010. Aggregate means that with each mile added, the population within all previous miles are added together.
Mile 0
1. Chicago: 63,120
2. Minneapolis: 31,036
3. Milwaukee: 21,587
4. Cincinnati: 17,681
5. St. Louis: 17,359
6. Grand Rapids: 16,099
7. Omaha: 15,582
8. Indianapolis: 14,058
9. Kansas City: 13,709
10. Akron: 12,479
11. Cleveland: 9,471
12. Dayton: 9,182
13. Detroit: 8,709
14. Toledo: 8,304
15. Columbus: 7,416
This is a pretty bad showing in this list. In 2010, Columbus had the lowest downtown population, or population at Mile 0, of any of the largest 15 Midwest metros.
Mile 1
1. Chicago: 181,714
2. Minneapolis: 123,526
3. Milwaukee: 86,261
4. Grand Rapids: 75,613
5. Cincinnati: 65,264
6. Omaha: 56,244
7. Toledo: 55,739
8. Akron: 53,715
9. Columbus: 49,667
10. Indianapolis: 45,079
11. Dayton: 41,053
12. St. Louis: 40,184
13. Kansas City: 32,900
14. Detroit: 32,810
15. Cleveland: 32,193
By Mile 1, Columbus starts to move up rapidly, however.
Mile 2
1. Chicago: 318,522
2. Minneapolis: 228,927
3. Milwaukee: 208,776
4. Cincinnati: 138,235
5. Columbus: 134,826
6. Grand Rapids: 127,535
7. Akron: 122,395
8. Omaha: 113,044
9. Indianapolis: 102,412
10. Dayton: 101,817
11. Toledo: 94,058
12. St. Louis: 94,038
13. Kansas City: 77,388
14. Cleveland: 64,721
15. Detroit: 64,046
Mile 3
1. Chicago: 508,949
2. Minneapolis: 325,198
3. Milwaukee: 319,111
4. Columbus: 221,466
5. Cincinnati: 205,624
6. Grand Rapids: 184,887
7. Akron: 177,674
8. Omaha: 168,724
9. Toledo: 166,569
10. Indianapolis: 166,266
11. St. Louis: 160,117
12. Kansas City: 155,802
13. Dayton: 152,789
14. Cleveland: 139,945
15. Detroit: 109,104
Mile 4
1. Chicago: 764,400
2. Minneapolis: 448,499
3. Milwaukee: 438,629
4. Cincinnati: 315,665
5. Columbus: 314,557
6. Omaha: 253,723
7. St. Louis: 251,432
8. Grand Rapids: 247,473
9. Indianapolis: 240,970
10. Akron: 227,825
11. Cleveland: 227,309
12. Kansas City: 216,483
13. Dayton: 214,614
14. Toledo: 213,529
15. Detroit: 198,341
Mile 5
1. Chicago: 1,067,434
2. Minneapolis: 585,588
3. Milwaukee: 552,064
4. Columbus: 404,642
5. Cincinnati: 400,254
6. Cleveland: 361,475
7. St. Louis: 336,573
8. Indianapolis: 320,919
9. Omaha: 311,189
10. Grand Rapids: 305,307
11. Akron: 296,787
12. Detroit: 282,986
13. Toledo: 271,187
14. Kansas City: 269,936
15. Dayton: 262,069
So while Columbus’ downtown is down at the bottom in this list to start, it ends up being a top 5 within just a few miles. Clearly, though, the city needs to do better at getting people in the center.
What about further out? Let’s keep going.
Mile 10
1. Chicago: 2,763,025
2. Minneapolis: 1,312,640
3. Detroit: 1,053,920
4. Columbus: 993,957
5. Milwaukee: 944,415
6. Cleveland: 918,511
7. Indianapolis: 871,050
8. St. Louis: 864,336
9. Cincinnati: 862,932
10. Kansas City: 797,442
11. Omaha: 588,484
12. Dayton: 586,178
13. Akron: 502,710
14. Grand Rapids: 482,599
15. Toledo: 454,859
Mile 20
1. Chicago: 4,738,903
2. Detroit: 2,663,489
3. Minneapolis: 2,542,565
4. St. Louis: 1,878,365
5. Kansas City: 1,618,823
6. Cincinnati: 1,592,905
7. Cleveland: 1,549,799
8. Indianapolis: 1,511,675
9. Columbus: 1,432,067
10. Milwaukee: 1,317,062
11. Omaha: 788,498
12. Dayton: 757,623
13. Akron: 673,654
14. Grand Rapids: 602,220
15. Toledo: 558,219
Columbus seems to hold its own from Mile 2 through about Mile 15 or 16, and then begins to fall back as full metro populations begin to take shape.
So now we know the exact populations by distance, but what about how those are changing over time? Here are the same miles and their total change from 2000 to 2010.
Aggregate Change 2000-2010
By Mile 1
1. Chicago: 48,288
2. Minneapolis: 7,969
3. St. Louis: 5,881
4. Cleveland: 3,174
5. Milwaukee: 2,250
6. Kansas City: 1,009
7. Omaha: -53
8. Columbus: -1,049
9. Detroit: -3,601
10. Indianapolis: -4,739
11. Grand Rapids: -5,236
12. Cincinnati: -6,112
13. Akron: -8,916
14. Toledo: -10,118
15. Dayton: -10,165
By Mile 2
1. Chicago: 31,824
2. Minneapolis: 3,462
3. Omaha: 408
4. St. Louis: -1,523
5. Milwaukee: -2,399
6. Cleveland: -3,388
7. Kansas City: -4,807
8. Columbus: -6,004
9. Grand Rapids: -9,279
10. Detroit: -11,019
11. Indianapolis: -15,532
12. Cincinnati: -15,749
13. Akron: -15,874
14. Toledo: -16,771
15. Dayton: -20,826
By Mile 3
1. Chicago: 13,414
2. Minneapolis: 257
3. Omaha: -28
4. Milwaukee: -4,550
5. Columbus: -8,509
6. Grand Rapids: -8,818
7. St. Louis: -12,153
8. Kansas City: -14,528
9. Akron: -18,107
10. Toledo: -21,469
11. Cleveland: -23,287
12. Indianapolis: -23,973
13. Cincinnati: -24,548
14. Dayton: -27,652
15. Detroit: -29,905
By Mile 4
1. Minneapolis: 2,381
2. Omaha: 1,376
3. Milwaukee: -4,943
4. Grand Rapids: -8,612
5. Columbus: -9,650
6. Chicago: -12,130
7. Kansas City: -17,813
8. Akron: -18,533
9. Toledo: -22,039
10. St. Louis: -22,415
11. Indianapolis: -27,912
12. Dayton: -31,173
13. Cincinnati: -32,342
14. Cleveland: -41,948
15. Detroit: -61,209
By Mile 5
1. Omaha: 1,800
2. Minneapolis: 1,798
3. Milwaukee: -4,090
4. Columbus: -7,924
5. Grand Rapids: -8,112
6. Akron: -19,405
7. Kansas City: -21,986
8. Toledo: -26,094
9. Indianapolis: -28,401
10. Dayton: -33,066
11. St. Louis: 35,038
12. Cincinnati: -38,698
13. Chicago: -48,898
14. Cleveland: -70,067
15. Detroit: -89,973
By Mile 10
1. Columbus: 59,873
2. Indianapolis: 37,721
3. Omaha: 25,330
4. Grand Rapids: 10,284
5. Minneapolis: -1,544
6. Milwaukee: -2,369
7. Akron: -6,207
8. Dayton: -17,223
9. Kansas City: -19,048
10. Toledo: -21,636
11. Cincinnati: -39,767
12. St. Louis: -58,549
13. Cleveland: -120,862
14. Chicago: -172,571
15. Detroit: -239,616
By Mile 20
1. Indianapolis: 213,270
2. Columbus: 183,014
3. Kansas City: 144,634
4. Minneapolis: 141,652
5. Omaha: 97,813
6. Cincinnati: 46,813
7. Milwaukee: 27,876
8. Grand Rapids: 24,505
9. Akron: 8,625
10. Dayton: -7,484
11. Toledo: -9,112
12. St. Louis: -21,917
13. Cleveland: -88,522
14. Chicago: -215,802
15. Detroit: -291,258
Metro Area Demographics provides a greater picture of the Columbus metro’s population and demographic data.

Just a few May project updates. These represent only a small fraction of what’s going on in terms of local development.
Downtown
1. Neighborhood Launch’s expansion with a pair of new 5-story buildings containing 260 apartments continues. Located on E. Long Street, the buildings’ foundation work has been mostly completed and elevator shafts and the first steel frames are now going up, which means construction should really get going now. The timetable for these to be complete is late fall or winter.
2. Over at Columbus Commons, the Highpoint 300-unit residential project continues and at least one of the buildings is now reaching towards its 6th and final floor.
3. The Liberty Place 200+ unit residential expansion in the Brewery District is getting closer to being done with the external work, as brick and finishes are going on.
4. The mess that is the reconstruction of 670/71 also continues, but we’re still a year or so away from that being done… before the next phase begins closer to the 70/71 section.
5. Work continues on the restoration of the LeVeque Tower, but more details have emerged. Up to 70 residential units will be created in the tower section, along with lower floors having a new boutique hotel and office space. The lobby will be restored to its original 2-story look, and the entrance outside will get new marble, planters and lighting. The terra cotta exterior of the building will take up to 5 more years to complete, as 80 years of grime and damage have to be fixed. The other improvements should be done late this year or early next year.
6. Columbia Gas’ new HQ building in the Arena District has reached it’s maximum 6-story height with steel, but no exterior work is done yet.
7. The Flats II 120-unit residential building next door to that project is seeing exterior work being done and should be done later this summer or early fall. Reports have been coming out showing this and other residential projects nearby have extremely high rental interest already.
8. 600 Goodale, the 5-story 174-unit residential building is seeing exterior work now and should be done by the end of summer or fall.
Short North
1. Aston Place, a new residential project on Hubbard Avenue, is moving along and the elevator shaft is just about done, so steel should be going up soon.
2. The Hubbard project continues to the east. The 5-story, 68-unit residential building is all framed out and exterior work is beginning. The adjoining parking garage is complete and the 4 concealing townhomes should begin construction soon.
3. The Out of the Closet development at 5th and High is well underway, now completely framed out.