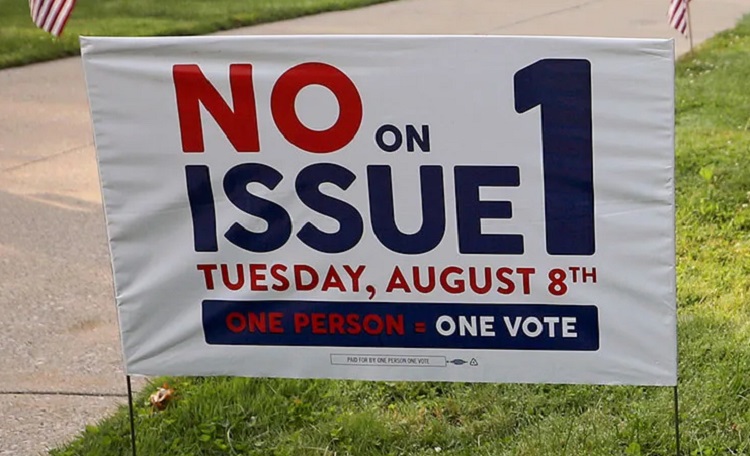
Issue 1 was a contentious, controversial proposal to make it harder for Ohioans to make changes to the state constitution. After a short campaign season, it would go on to defeat by just over 14 points- 57.01% to 42.99%. I provided a state county map with the results on the new Special Issues page. But what were the Issue 1 results in Franklin County and its precincts, specifically?
Today’s Cool Link provides the answer with a precinct map of the county. The map shows the results of Issue 1 for every single precinct, ward or city in Franklin County.
Based on the map, here were the overall margins for all the places in the county. Negative numbers are No wins, and positive numbers are Yes wins. 1. Bexley: -74.35 2. Grandview Heights: -71.19 3. Riverlea: -70.04 4. Marble Cliff: -69.02 5. Urbancrest: -64.16 6. Minerva Park: -63.1 7. Worthington: -61.94 8. Columbus: -61.8 9. Clinton Township: -58.32 10. Upper Arlington: -51.55 11. Sharon Township: -50.76 12. Mifflin Township: -46.54 13. Perry Township: -45.32 14. Whitehall: -43.97 15. Gahanna: -42.54 16. New Albany: -42.43 17. Hilliard: -41.09 18. Blendon Township: -39.79 19. Truro Township: -37.93 20. Reynoldsburg: -36.32 21. Jefferson Township: -36.29 22. Westerville: -36.0 23. Dublin: -35.71 24. Norwich Township: -27.9 25. Valleyview: -26.32 26. Canal Winchester: -18.14 27. Madison Township: -17.75 28. Groveport: -16.1 29. Obetz: -14.03 30. Grove City: -13.66 31. Prairie Township: -11.44 32. Plain Township: -9.12 33. Washington Township: -7.5 34. Franklin Township: -6.7 35. Brown Township: -2.58 36. Pleasant Township: +9.2 37. Jackson Township: +13.71 38. Hamilton Township: +15.04 As we can see, almost no part of the county voted Yes except for a few rural townships on the far south side. Not a single suburb voted yes, including in more conservative suburbs like Grove City and Canal Winchester. This suggests there was a lot of bipartisan opposition within the county.
In the past, I’ve done individual housing market update reports on a monthly basis, but it’s proven to be somewhat impractical from a time management perspective. For 2023, I’ve decided to just do two main updates, one for the mid-year point and the other in December for the year as a whole.
Some changes for the mid-year update format will be that I will include all information January-June for all the Columbus market areas. For the larger tables, you can scroll to see all months.
Top 20 Most Expensive Markets by Median Sales Price January-June
Rank
January
February
March
April
May
June
January-June Median
1
Olentangy LSD: $520,531
New Albany: $921,425
New Albany: $1,112,875
New Albany: $975,000
New Albany: $820,000
New Albany: $788,500
New Albany: $925,000
2
Dublin/Dublin CSD: $519,900
New Albany Plain LSD: $750,000
Grandview Heights: $715,000
New Albany Plain LSD: $899,000
Grandview Heights: $752,000
Powell: $686,255
New Albany Plain LSD: $655,000
3
New Albany: $501,010
Powell: $613,255
New Albany Plain LSD: $684,250
Dublin: $585,000
Upper Arlington CSD: $691,000
New Albany Plain LSD: $655,000
Powell: $620,000
4
Granville CSD: $500,000
Dublin: $590,000
Powell: $612,450
Olentangy LSD: $564,000
Powell: $640,000
Upper Arlington CSD: $625,000
Upper Arlington CSD: $607,000
5
Johnstown-Monroe LSD: $499,000
Bexley: $581,250
Granville CSD: $567,500
Upper Arlington CSD: $550,000
New Albany Plain LSD: $639,900
Dublin: $585,000
Dublin: $570,000
6
Big Walnut LSD: $470,000
Big Walnut LSD: $515,900
German Village: $565,000
German Village: $528,500
Dublin: $580,000
Bexley: $550,500
Olentangy LSD: $540,792
7
Worthington: $467,500
Olentangy LSD: $499,050
Olentangy LSD: $550,000
Bexley: $515,000
Olentangy LSD: $568,000
German Village: $545,000
German Village: $530,000
8
Jonathan Alder LSD: $446,250
Upper Arlington CSD: $467,875
Upper Arlington CSD: $527,500
Powell: $505,000
Dublin CSD: $527,500
Olentangy LSD: $540,000
Bexley: $515,000
9
Buckeye Valley LSD: $445,000
Dublin CSD: $463,975
Dublin: $525,000
Buckeye Valley LSD: $499,000
German Village: $516,500
Granville CSD: $525,000
Dublin CSD: $511,500
10
Powell: $440,000
Worthington: $450,000
Big Walnut LSD: $496,379
Dublin CSD: $485,000
Worthington: $510,444
Buckeye Valley LSD: $508,635
Granville CSD: $500,000
11
New Albany Plain LSD: $430,000
German Village: $450,000
Bexley: $484,250
Big Walnut LSD: $475,000
Big Walnut LSD: $497,000
Dublin CSD: $493,418
Buckeye Valley LSD: $483,900
12
Upper Arlington CSD: $426,250
Hilliard: $438,000
Dublin CSD: $475,000
Sunbury: $462,350
Short North: $495,000
Lithopolis: $485,000
Big Walnut LSD: $480,000
13
Northridge LSD: $405,200
Downtown: $430,000
Buckeye Valley LSD/Sunbury: $438,500
Granville CSD: $450,000
Buckeye Valley LSD: $489,598
Northridge LSD: $480,790
Worthington: $437,500
14
German Village: $405,000
Granville CSD: $420,000
Johnstown-Monroe LSD: $438,000
Short North: $432,000
Granville CSD: $484,950
Short North: $480,000
Short North: $425,000
15
Grandview Heights: $400,000
Beechwold/Clintonville: $407,500
Minerva Park: $432,000
Pickerington: $427,738
Pickerington: $450,000
Grandview Heights: $455,000
Sunbury: $420,000
16
Lithopolis: $383,000
Lithopolis: $405,400
Westerville: $415,000
Beechwold/Clintonville: $425,500
Sunbury: $449,500
Worthington: $450,000
Pickerington: $406,200
17
Bexley: $380,000
Worthington CSD: $400,000
Hilliard: $410,000
Hilliard: $421,200
Jonathan Alder LSD: $445,000
Gahanna Jefferson CSD: $437,500
Johnstown-Monroe LSD: $399,950
18
Pickerington: $370,000
Short North: $386,650
Northridge LSD: $402,690
Pickerington LSD: $415,000
Bexley: $430,000
Jonathan Alder LSD: $436,000
Lithopolis: $396,000
19
Minerva Park: $367,500
Westerville: $379,900
Lithopolis: $396,000
Worthington: $395,000
Northridge LSD: $412,500
Downtown: $427,000
Pickerington LSD: $390,000
20
Sunbury: $339,700
Pickertington/Pickerington CSD: $370,000
Worthington: $391,000
Grandview Heights/Lithopolis: $388,000
Pickerington LSD: $410,000
Hilliard: $420,000
Westerville: $389,888
Top 20 Least Expensive Markets by Median Sales Price January-June
Rank
January
February
March
April
May
June
January-June Avg Median
1
Obetz: $159,900
Miami Trace LSD: $145,000
Circleville CSD: $163,350
Miami Trace LSD: $177,000
London CSD: $190,000
Lancaster CSD: $200,500
Miami Trace LSD: $184,500
2
Miami Trace LSD: $162,500
Whitehall: $165,000
Miami Trace LSD: $170,750
Lancaster CSD: $183,500
Whitehall: $192,000
London CSD: $225,158
Whitehall: $187,500
3
Whitehall: $169,500
Obetz: $186,500
Lancaster CSD: $174,900
Whitehall: $190,000
Newark CSD: $215,000
Miami Trace LSD: $227,000
Lancaster CSD: $199,900
4
Lancaster CSD: $185,500
Lancaster CSD: $195,000
Newark CSD: $178,388
Newark CSD: $198,000
Lancaster CSD: $224,500
Circleville CSD: $229,500
Newark CSD: $209,500
5
Newark CSD: $205,000
Jefferson LSD: $196,400
Whitehall: $199,900
Circleville CSD: $216,000
Circleville CSD: $234,950
Jefferson LSD: $240,000
Circleville CSD: $228,000
6
Columbus CSD: $214,000
Hamilton LSD: $205,900
Columbus CSD: $229,900
Hamilton LSD: $235,000
Miami Trace LSD: $242,450
Newark CSD: $243,500
Hamilton LSD: $237,500
7
London CSD: $215,000
Grandview Heights: $209,500
Hamilton LSD: $249,000
Groveport Madison LSD: $235,500
Hamilton LSD: $250,000
Hamilton LSD: $245,000
Jefferson LSD: $238,000
8
Hamilton LSD: $217,000
Newark CSD: $217,500
Groveport Madison LSD: $250,000
Jefferson LSD: $250,425
Columbus CSD: $255,000
Whitehall: $245,900
London CSD: $240,158
9
Jefferson LSD: $223,500
Minerva Park: $223,000
Jefferson LSD: $255,000
Columbus CSD: $255,000
Obetz: $268,000
Obetz: $250,000
Columbus CSD: $243,000
10
Groveport Madison LSD: $225,000
London CSD: $224,038
Columbus/Reynoldsburg CSD: $255,000
London CSD: $257,500
Groveport Madison LSD: $270,000
Groveport Madison LSD: $261,500
Groveport Madison LSD: $250,000
11
Columbus: $230,000
Columbus CSD: $231,750
South-Western CSD: $285,000
Columbus: $270,000
Columbus: $280,000
Columbus CSD: $265,000
Columbus: $265,000
12
Reynoldsburg CSD: $240,000
Groveport Madison LSD: $243,500
Blacklick: $317,000
Obetz: $285,000
South-Wester CSD: $300,000
Reynoldsburg CSD: $270,000
Obetz: $276,000
13
Circleville CSD: $249,900
Columbus: $250,000
Gahanna: $317,049
South-Western CSD: $287,950
Minerva Park: $300,500
Columbus: $283,500
South-Western CSD: $287,000
14
South-Western CSD: $263,500
Circleville CSD: $250,000
Delaware CSD: $322,500
Marysville CSD: $300,000
Reynoldsburg CSD: $313,000
South-Western CSD: $300,000
Marysville CSD: $322,000
15
Worthington CSD: $273,500
South-Western CSD: $260,000
Marysville CSD: $325,000
Blacklick: $309,500
Canal Winchester CSD: $320,000
Marysville CSD: $318,750
Canal Winchester CSD: $325,000
16
Canal Winchester CSD: $295,000
Reynoldsburg CSD: $293,500
Canal Winchester CSD: $327,500
Johnstown-Monroe LSD: $311,000
Pataskala: $339,500
Blacklick: $348,000
Blacklick: $330,100
17
Blacklick: $299,000
Marysville CSD: $299,900
Gahanna Jefferson CSD: $329,750
Teays Valley LSD: $312,900
Marysville CSD: $342,500
Teays Valley LSD: $348,810
Pataskala: $344,000
18
Teays Valley LSD: $300,000
Buckeye Valley LSD: $302,450
Pataskala: $340,000
Canal Winchester CSD: $325,000
Westerville CSD: $346,000
Grove City: $352,041
Teays Valley LSD: $345,000
19
Delaware CSD: $310,000
Gahanna: $303,500
Beechwold/Clintonville: $343,500
Worthington CSD: $329,101
Downtown/Grove City: $350,000
Delaware CSD: $360,000
Grove City: $350,000
20
Westerville CSD: $324,900
Grove City: $310,000
Obetz/Hilliard CSD: $345,000
Reynoldsburg CSD: $330,000
Gahanna: $353,500
Pataskala: $367,500
Delaware CSD: $350,500
Top 10 Markets with the Largest Median Sales Price Change Year-to-Date June 2022 to June 2023
Rank
Year to Date June 2022 to June 2023
1
New Albany: $100,000
2
Dublin CSD: $66,500
3
Minerva Park: $55,400
4
Bexley: $55,000
5
German Village: $50,000
6
Upper Arlington CSD: $46,550
7
Dublin: $45,000
8
Buckeye Valley LSD: $41,900
9
Newark CSD: $39,723
10
Lithopolis: $36,000
Top 10 Markets with the Smallest Median Sales Price Change Year-to-Date June 2022 to June 2023
Rank
Year-to-Date June 2022 to June 2023
1
Grandview Heights: -$70,000
2
Granville CSD: -$25,000
3
Canal Winchester CSD: -$20,750
4
Pataskala: -$20,000
5
Miami Trace LSD: -$9,500
6
Jefferson LSD: -$3,200
7
Marysville CSD: -$2,700
8
London CSD: -$1,842
9
Pickerington LSD: -$350
10
Gahanna: -$250
Top 10 Markets with the Most New Listings Year-to-Date June 2022 to June 2023
Rank
January-June Total Closed Sales
Year-to-Date Change June 2022 to June 2023
1
Columbus: 4,526
-19.8%
2
Columbus CSD: 3,060
-21.1%
3
South-Western CSD: 805
-16.3%
4
Olentangy LSD: 678
-1.2%
5
Hilliard CSD: 539
-10.9%
6
Westerville CSD: 523
-20.0%
7
Dublin CSD: 476
-16.8%
8
Pickerington LSD: 367
+4.6%
9
Grove City: 319
-22.6%
10
Worthington: 319
-15.6%
Top 10 Markets with the Most Closed Sales Year-to-Date June 2022 to June 2023
Rank
January-June Total Closed Sales
Year-to-Date Change June 2022 to June 2023
1
Columbus: 4,526
-19.8%
2
Columbus CSD: 3,060
-21.1%
3
South-Western CSD: 805
-16.3%
4
Olentangy LSD: 678
-1.2%
5
Hilliard CSD: 539
-10.9%
6
Westerville CSD: 523
-20.0%
7
Dublin CSD: 476
-16.8%
8
Pickerington LSD: 367
+4.6%
9
Grove City: 319
-22.6%
10
Worthington: 319
-15.6%
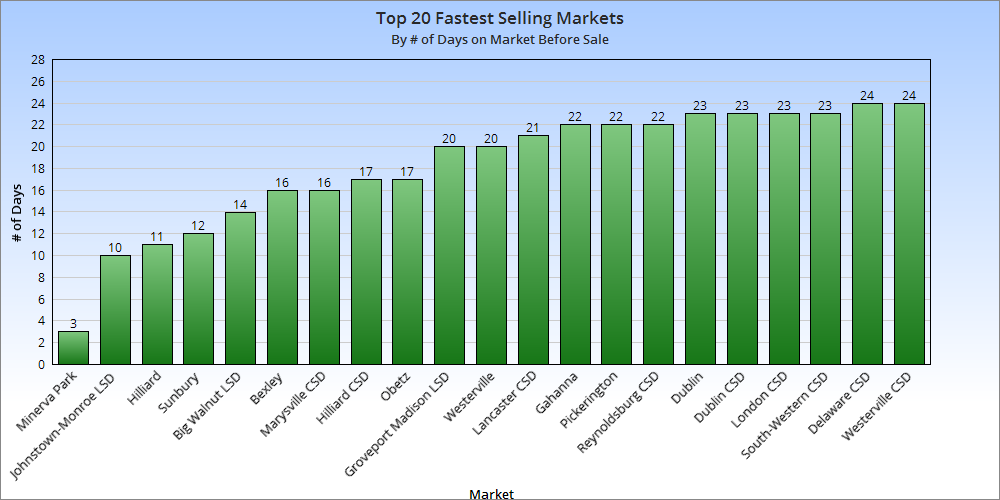
Top 10 Fastest-Selling Markets Year-to-Date 2023 by # of Days on Market Before Sale
Rank
# of Days Before Sale
Year-to-Date 2022 to 2023
1
Westerville: 10
66.7%
2
Westerville CSD: 13
62.5%
3
Gahanna: 14
133.3%
4
Hilliard: 14
100%
5
Minerva Park: 14
180%
6
New Albany Plain LSD: 14
-17.6%
7
Dublin: 15
50%
8
Worthington CSD: 15
114.3%
9
Bexley: 17
13.3%
10
German Village: 17
41.7%
11
Worthington: 17
142.9%
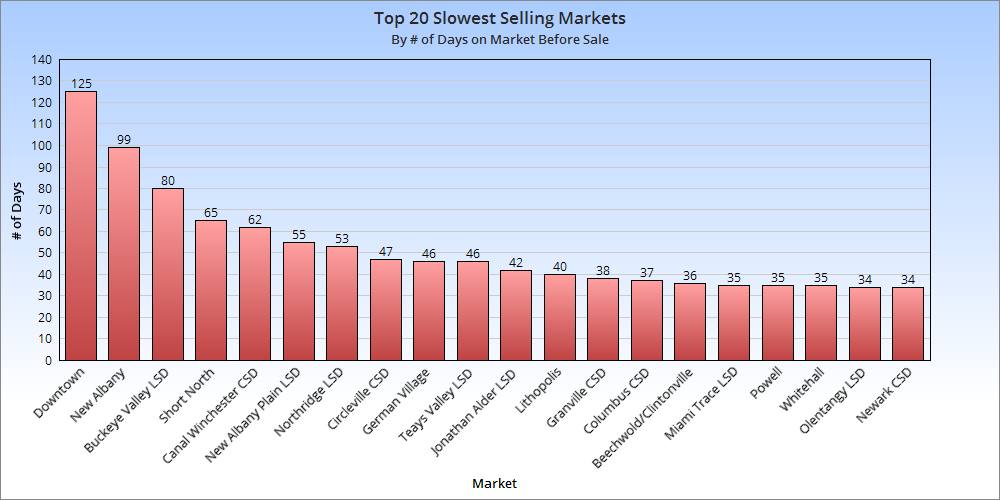
Top 10 Slowest-Selling Markets Year-to-Date 2023 by # of Days on Market Before Sale
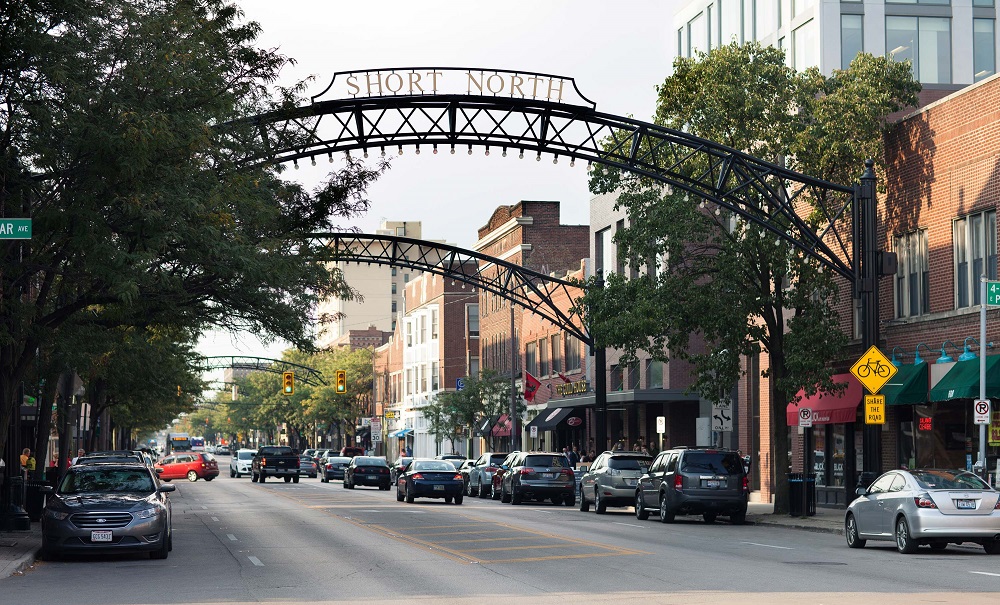
There’s been a lot of media attention to recent shootings in the Short North this year. It’s supposedly gotten so bad, that Mayor Ginther has asked local businesses in the neighborhood to close by Midnight. But has the violence really spiraled out of control, especially compared to other areas in the city. Is the Short North dangerous now? Or is the area just getting more attention due to its status as a hot neighborhood popular with locals and tourists alike?
First, let’s take a look at homicides and homicide rates across Franklin County by Census Tract. The numbers are through May 17th and the rates are total homicides divided by the 100K people per tract.
The first thing that sticks out is that the map has a whole lot of white areas, meaning most of the county and most of Columbus have seen zero homicides so far this year. The areas that have seen them do not appear to be much different than previous years- Hilltop, the Far West, the Near South, parts of Linden, and Northland. The Short North has had 1 homicide this year, which is certainly more than normal, but arguably not an epidemic even if gun violence overall is up. The other thing that sticks out is that most homicides are occurring in relatively small areas, and are often tied to certain streets or even certain businesses or residential complexes.
Using this map, we’ll next take a look at the overall homicide rates of specific neighborhoods and areas in and around Columbus to see where the whole of the Short North really ranks.
The ranking gives the neighborhood, how many tracts make it up, the 2020 population, total homicides and the homicide rate per 100,000 people. 1. Franklinton- 3 Tracts- 6,482- 3 Homicides- 46.28 Franklinton is still the most dangerous part of Columbus, and it’s really not even close. This is despite significant redevelopment in the neighborhood. 2. Near South- 13 Tracts- 35,026- 7 Homicides- 19.99 The Near South comes in a distant 2nd place. It includes a much larger area than Franklinton, but about half of the homicides occurred in the 3 tracts to the southeast of Nationwide Children’s Hospital. Places like German and Merion Village have had none. 3. Weinland Park- 2 Tracts- 6,393- 1 Homicide- 15.64 It seems a little unfair to rank Weinland Park 3rd when it’s only had a single homicide, but that’s just how the math works out. The single homicide has been lumped in with the Short North by some media, but it occurred well north across from Campus. 4. Near East- 9 Tracts- 21,841- 3 Homicides- 13.74 The Near East Side ranks 4th for the year so far. It’s been somewhat quieter than normal in this part of the city. 5. Linden- 14 Tracts- 41,627- 5 Homicides- 12.01 Similar to the Near East, Linden has been a bit more quiet than normal despite the relatively bad year Columbus is having. 5. Hilltop- 16 Tracts- 68,045- 8 Homicides- 11.76 Hilltop has had the 2nd most homicides of any of the neighborhoods looked at, but it’s also one of the largest and highest-populated as well, so the rate was lower than those above. 6. Northland- 18 Tracts- 89,165- 9 Homicides- 10.09 Northland has had the most homicides so far of any area of the city or county. Like Hilltop, however, its higher population means its rate is still relatively lower. 7. Short North- 4 Tracts- 12,472- 1 Homicide: 8.07 The Short North’s single homicide puts the neighborhood in 7th place overall. The rate itself is only slightly above that of the entirety of Columbus, so it doesn’t seem to be much of an outlier. 8. Far West- 11 Tracts- 51,308- 3 Homicides- 5.85 The Far West is the only neighborhood looked at that is entirely outside of I-270. It’s rate is only about 60% of the overall Columbus rate at this point in the year. 9. OSU Campus- 12 Tracts- 55,281- 2 Homicides- 3.62 Another large and heavily-populated area, the Campus neighborhood has been fairly safe so far this year. 10. Downtown- 5 Tracts- 12,297- 0 Homicides- 0.0 Downtown has had no homicides so far this year, a departure from last year in which it had already seen 1 at this point on its way to a total of 4 for 2022. 11. Whitehall- 8 Tracts- 23,054- 0 Homicides- 0.0 Another area I think that has had a somewhat negative reputation for crime is Whitehall, the only non-Columbus area looked at. It’s also had no homicides so far this year.
Overall, the neighborhoods above have accounted for 42 of the 65 total homicides so far this year, or about 65%. Most of the rest were very scattered.
So is the Short North dangerous? Not in terms of homicides, no, but that doesn’t mean that recent crime trends should be ignored. That said, it’s pretty clear other neighborhoods are much more deserving of attention in this regard, but may not have the economic or social clout to demand it. Of course, it also needs to be said that homicides are just a single type of crime. An examination of other types of crime may show a completely different story, but those other types rarely get the kind of breathless, hyperbolic reporting that homicides do.
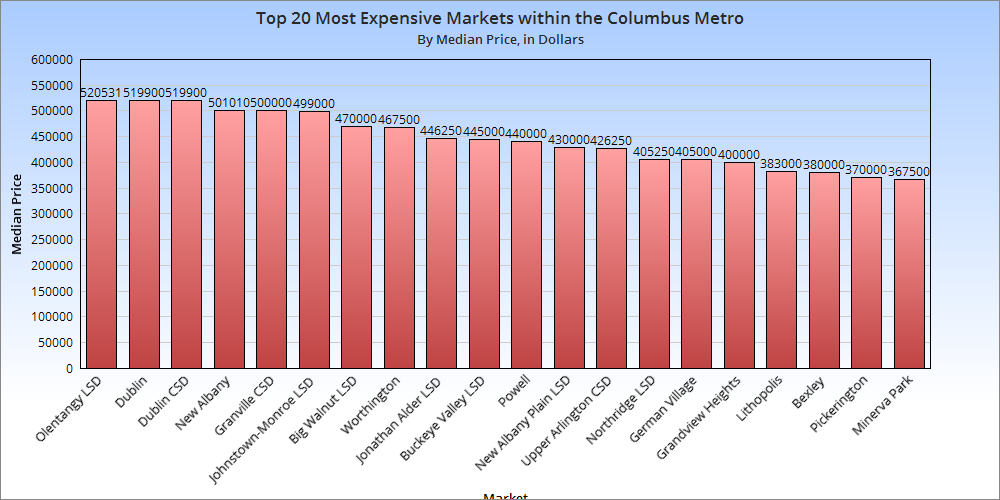
The Housing Market Update January 2023 data, the first of the new year, from Columbus Realtors showed that home sales and overall supply continued to decline, helping to ensure most areas saw continued increases in median prices.
Note: LSD= Local School District, CSD= City School District. In both cases, school district boundaries differ from city boundaries.
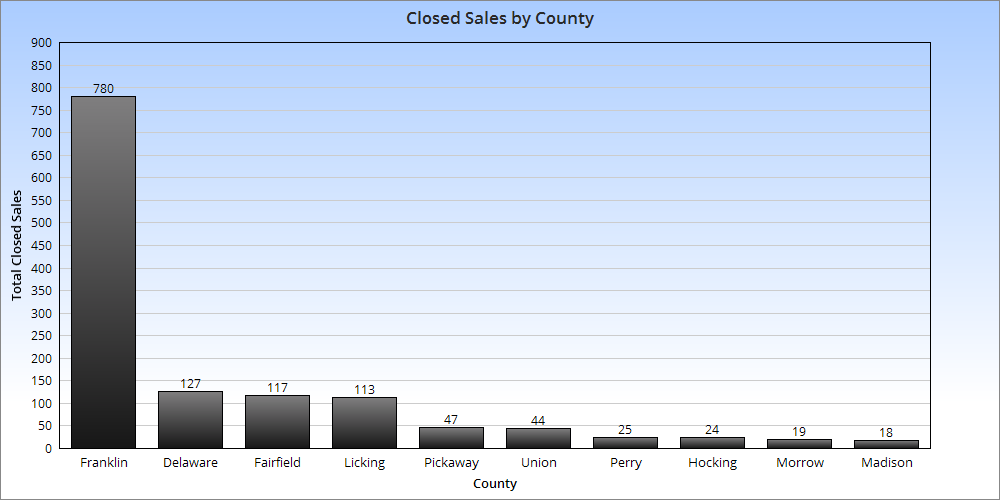
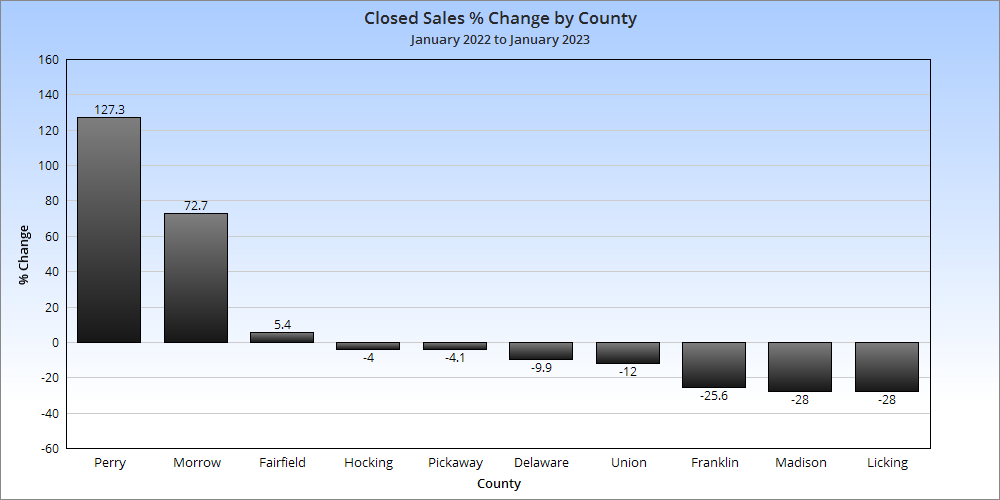
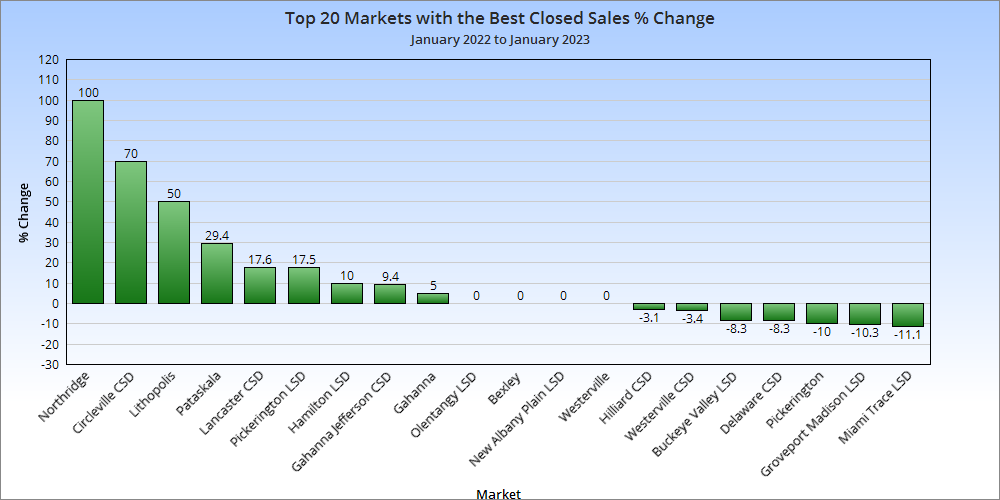
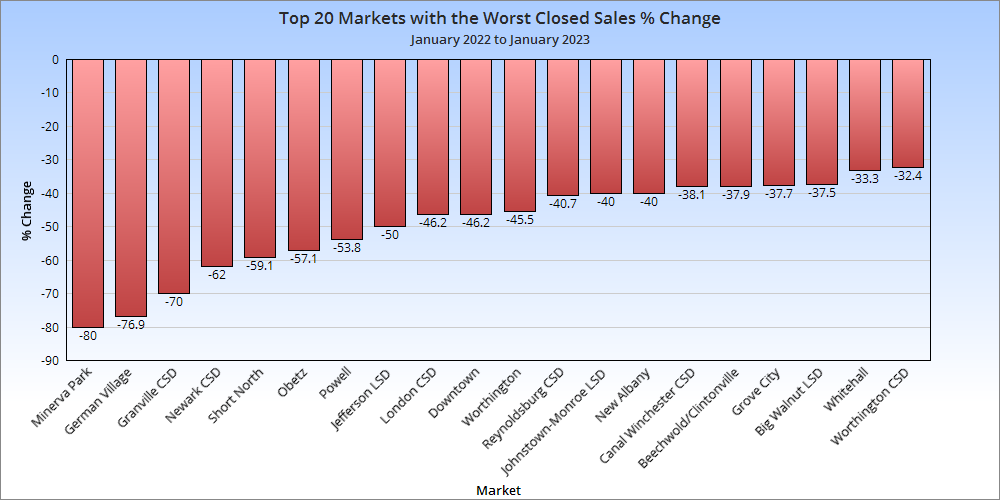
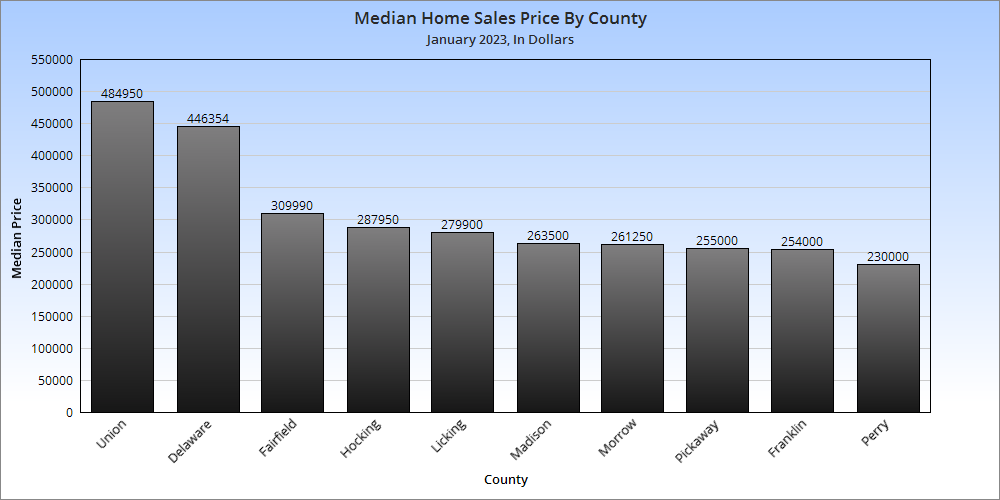
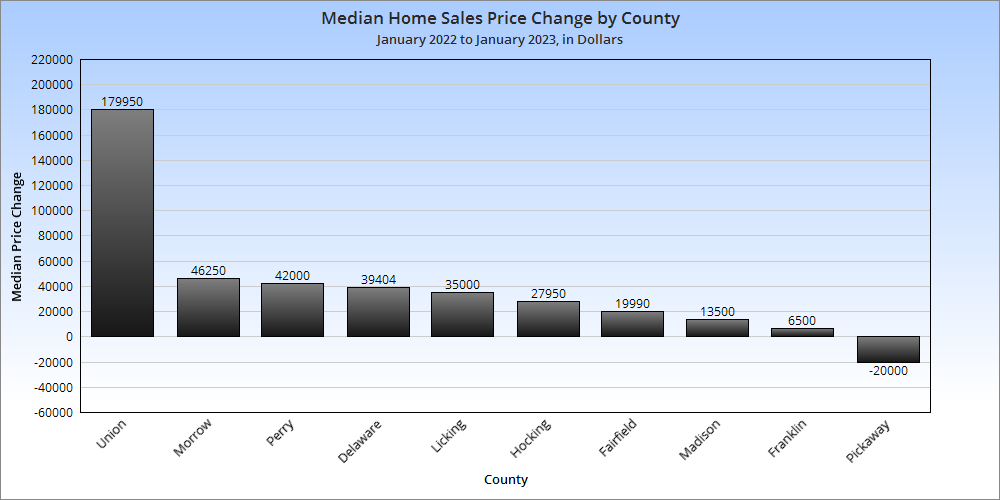
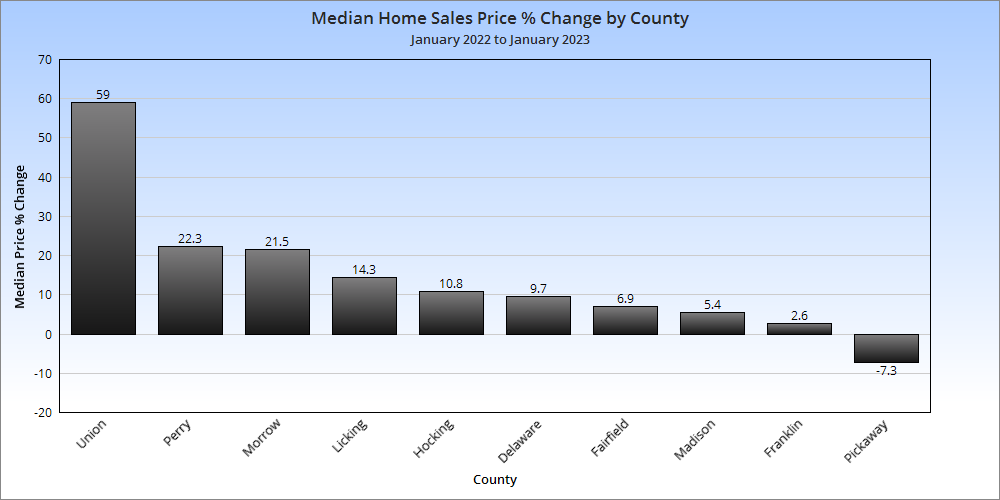
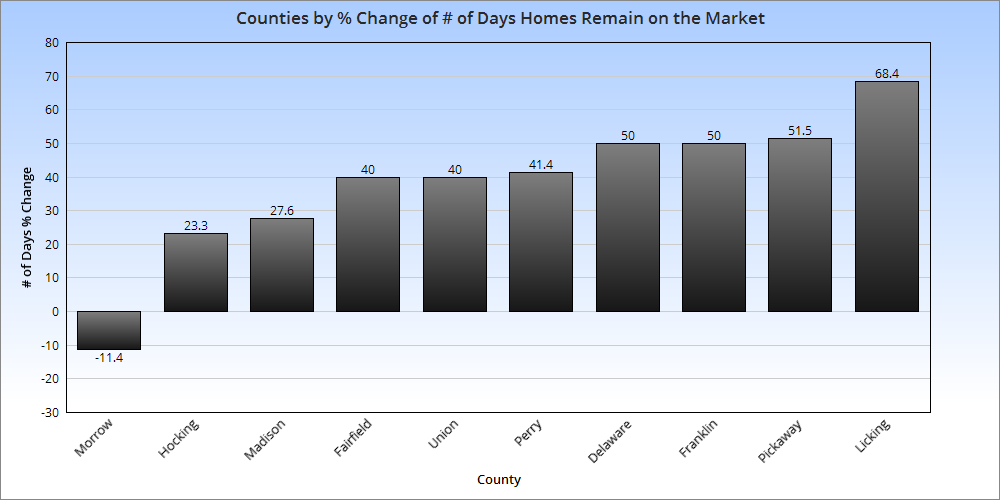
Closed sales are those sales that were completed during the month. 7 of the 10 metro counties saw declines in January Only 9 of more than 40 local markets were up year-over-year. Not sure what was going on in Union County in January, but it was well above all other counties for the month. The market overall continued to be up on price year-over-year, except in Pickaway County. Overall Market Median Sales Price in January 2023: $307,289 Based on the 10 Columbus Metro Area counties, the metro price saw a more than $39,000 increase over January, 2022. Overall Market Median Sales Price % Change in January, 2023 vs. January, 2022: +14.6% Continuing home sale declines had relatively little impact on home prices overall, which saw a strong increase over the year. It seems the Intel project’s impact may finally be making an appearance in housing numbers, with the Johnstown district seeing a huge increase in median home prices versus January 2022, 2 months before the project became official. That said, New Albany had one of the areas largest declines, but that could be due to it generally being one of the most expensive markets last year. New listings across most of the metro area were down, accounting for most of the median price increase as demand remains strong in the region. Most of the decrease came from Franklin County. Total Metro New Listings in January, 2023: 1,612 Total Metro New Listings Change from January, 2022 to January, 2023: -316 Average # of Days Homes Remain on the Market Before Sale for the Metro Overall in January, 2023: 34.0 # of Days Homes Remain on the Market Before Sale for the Metro January, 2022 to January, 2023: +8.8 Homes continued to sell more slowly than they did a year ago, now more than a week more slowly on average.
The Housing Market Update October 2022 data from Columbus Realtors showed a significant slowdown in home sales, but that it didn’t mean homes got cheaper in the process.
Note: LSD= Local School District, CSD= City School District. In both cases, school district boundaries differ from city boundaries.
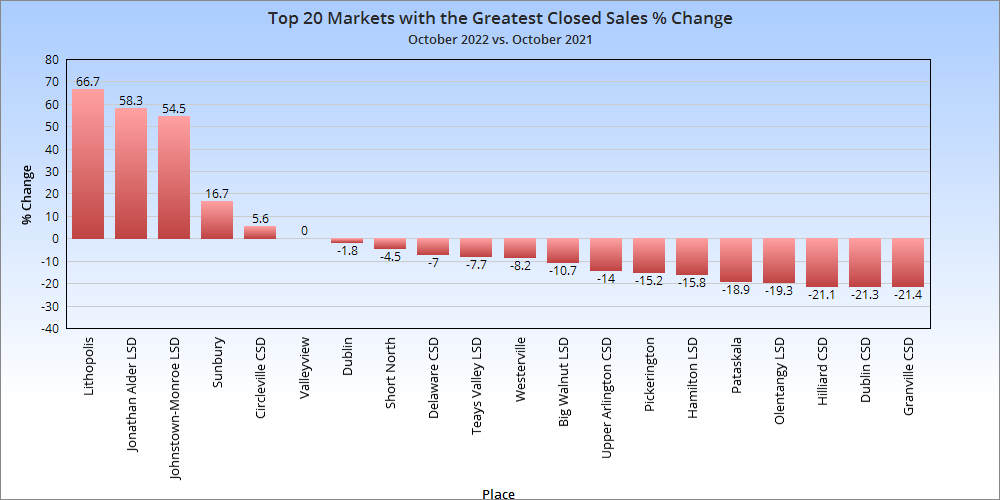
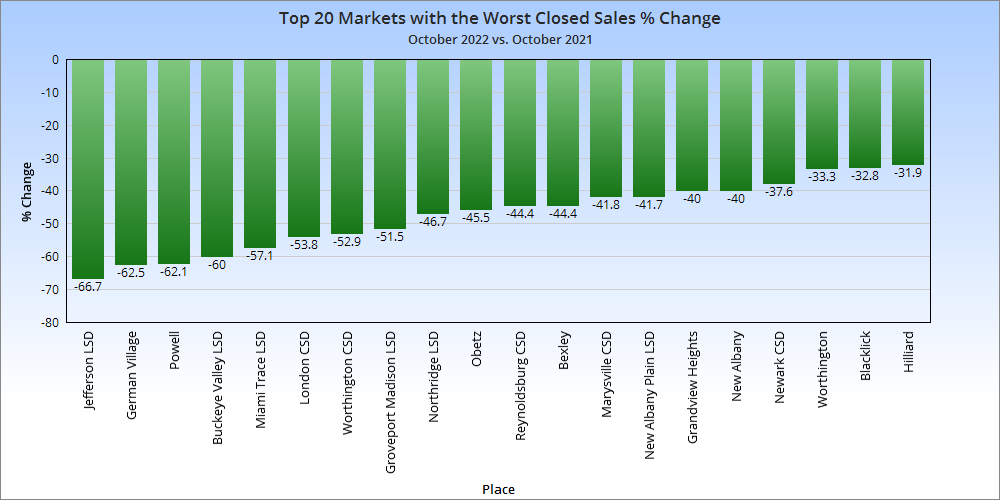
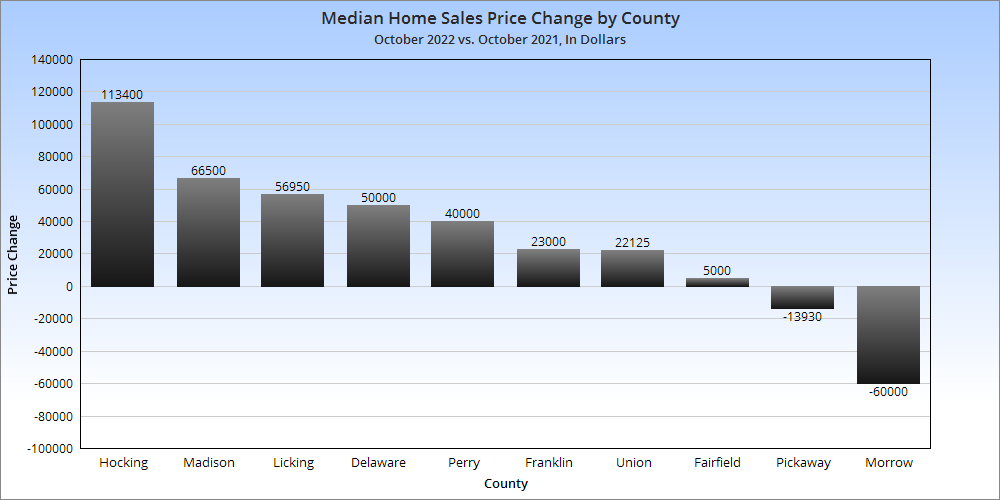
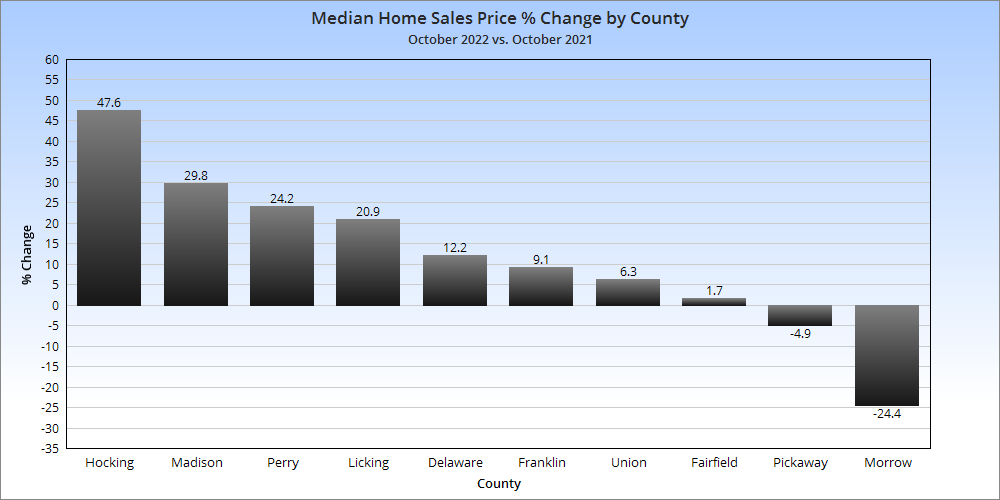
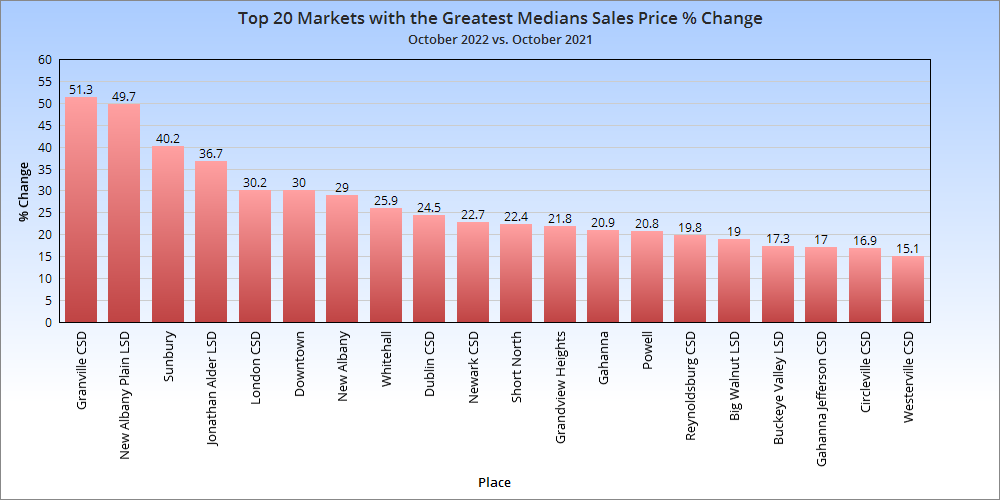
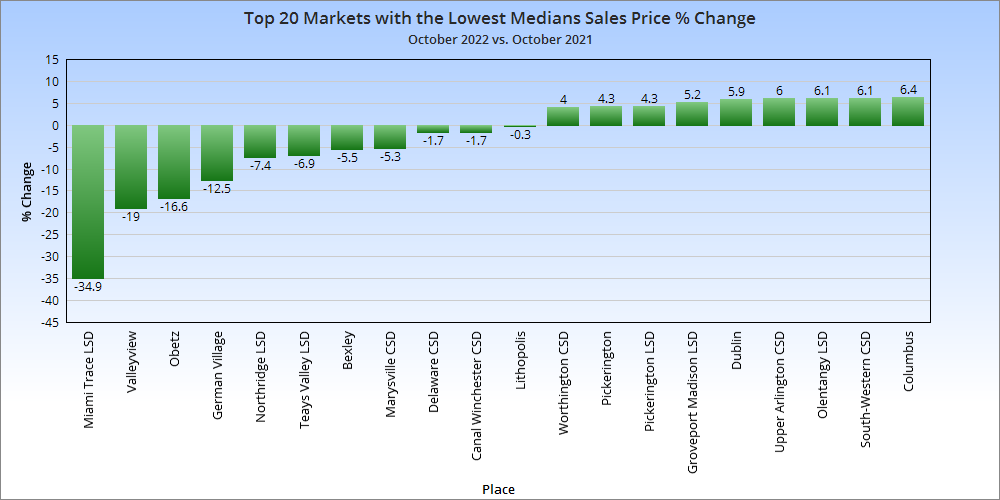
Closed sales are those sales that were completed during the month. They dropped significantly in most counties year-over-year as rising interest rates slowed the white-hot market. But what markets slowed down the most? Only a handful of markets saw an increase, including Johnstown, which is presumably seeing movement due to the Intel project. Most places on this list tended to be among the most expensive local markets, but not all.
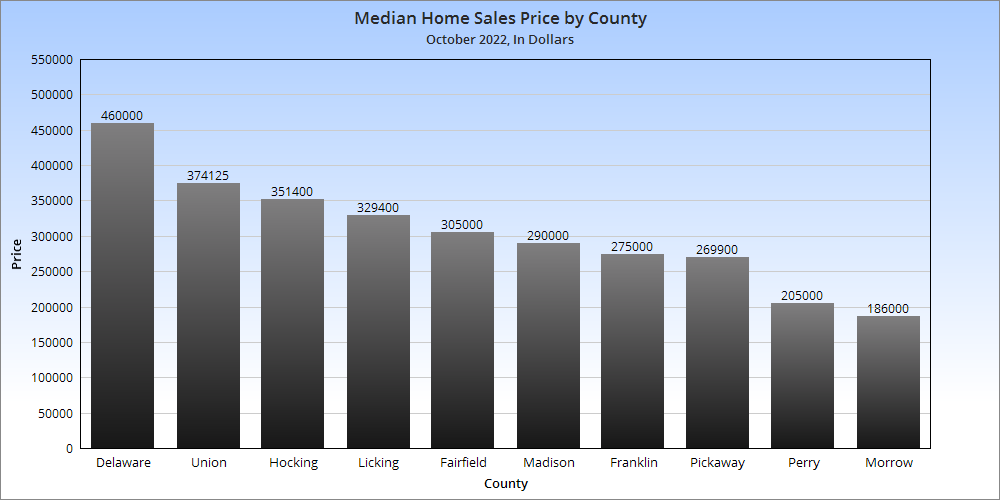
Most counties continued to see price increases, though some were much more modest than others. Franklin County was in the middle of the pack.
Overall Market Median Sales Price in October 2022: $304,583 Based on the 10 Columbus Metro Area counties, the metro price saw about a $12,000 increase vs September, 2022 and a more than $30,000 increase over October, 2021. Overall Market Median Sales Price % Change in October, 2022 versus October, 2021: +10.6%
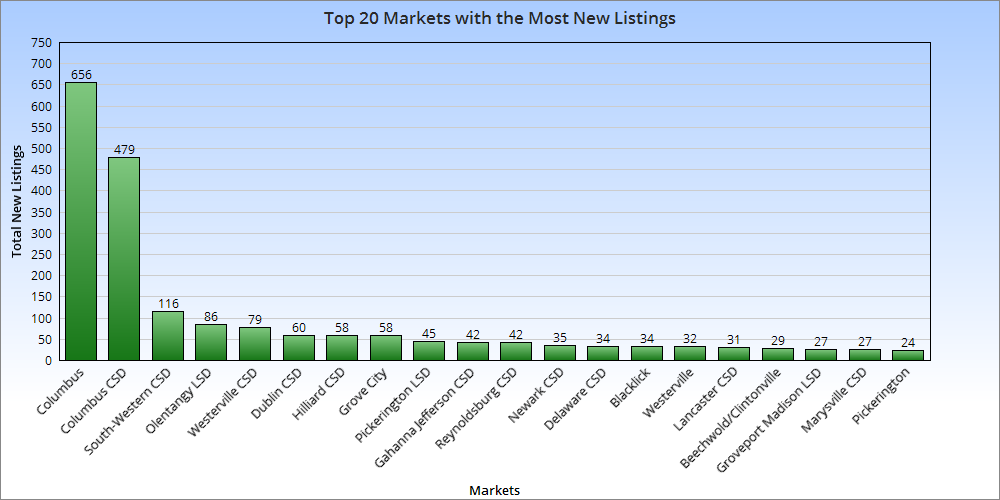
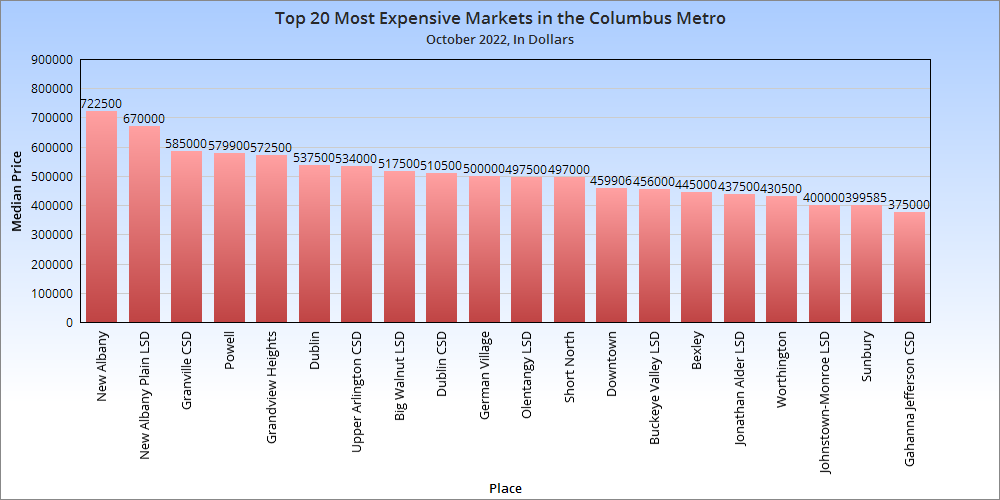
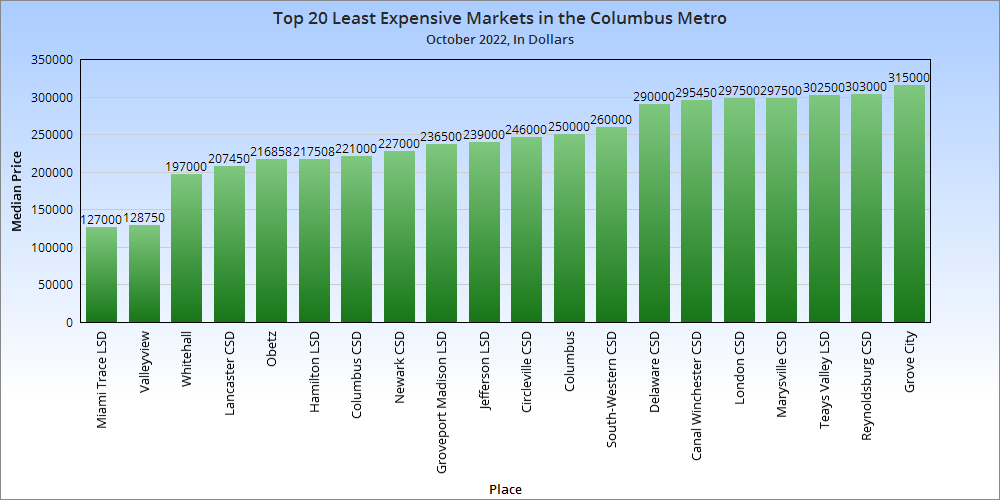
Now let’s take a look at individual neighborhoods and places within the metro area.
There are few surprises on this chart.
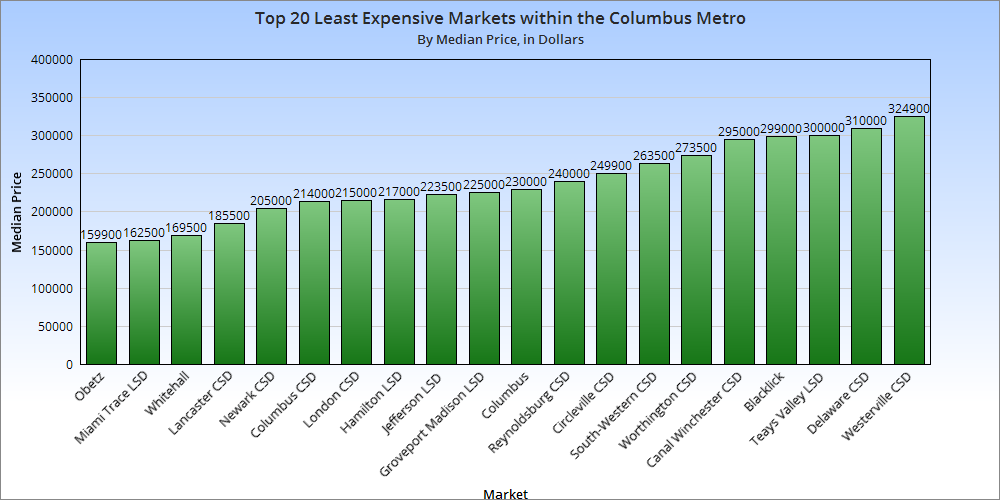
Only 3 markets had a median price below $200,000, 2 of which were within I-270.
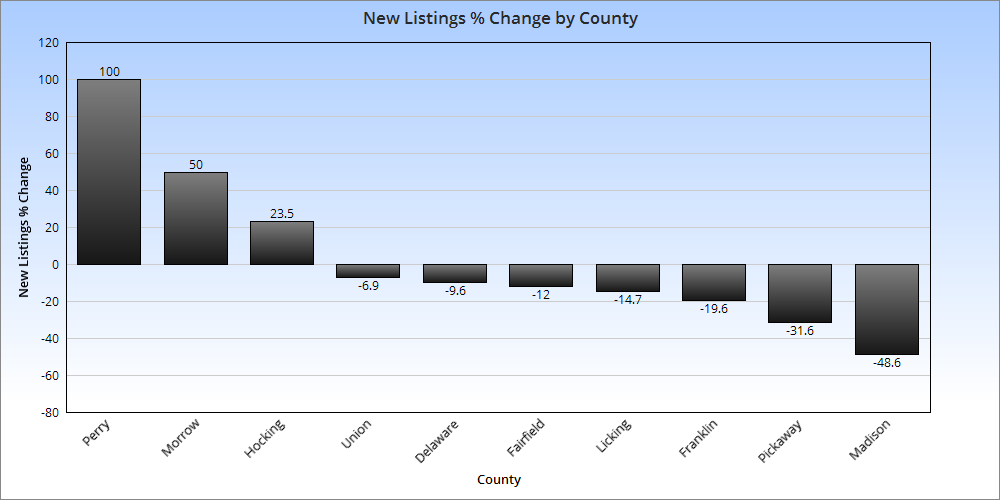
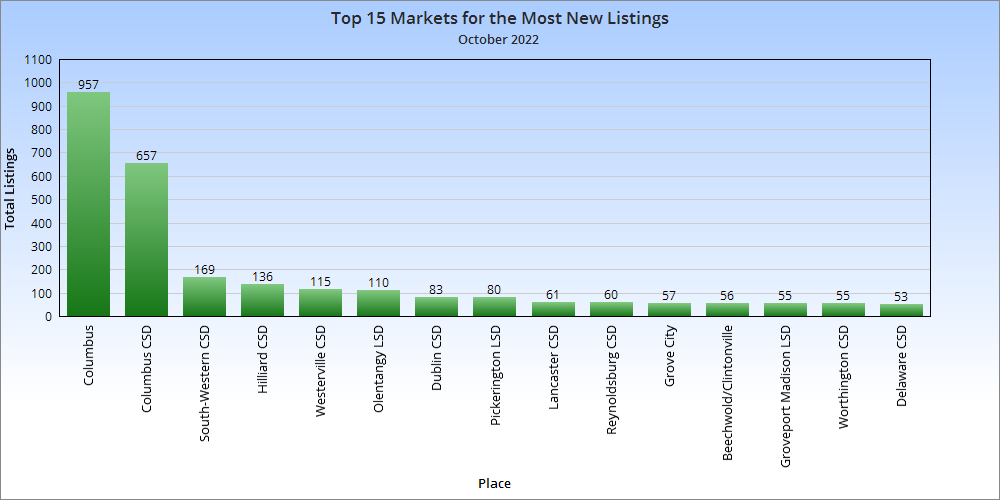
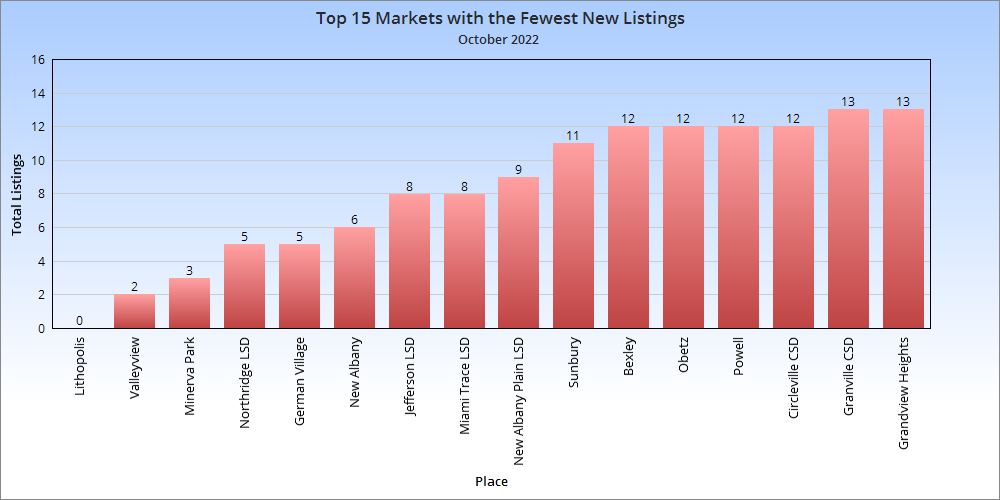
Most counties saw new listing totals drop year-over-year. This is one of the reasons prices remained higher despite large sales drops.
Total Metro New Listings in October, 2022: 2,401 Total Metro New Listings Change from October, 2021 to October, 2022: -497 Year-over-year, new listings were down yet again.
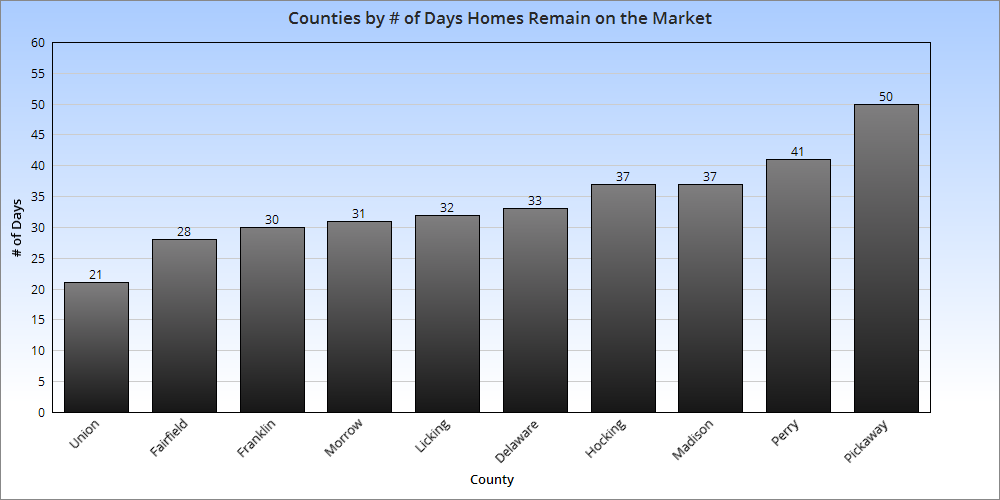
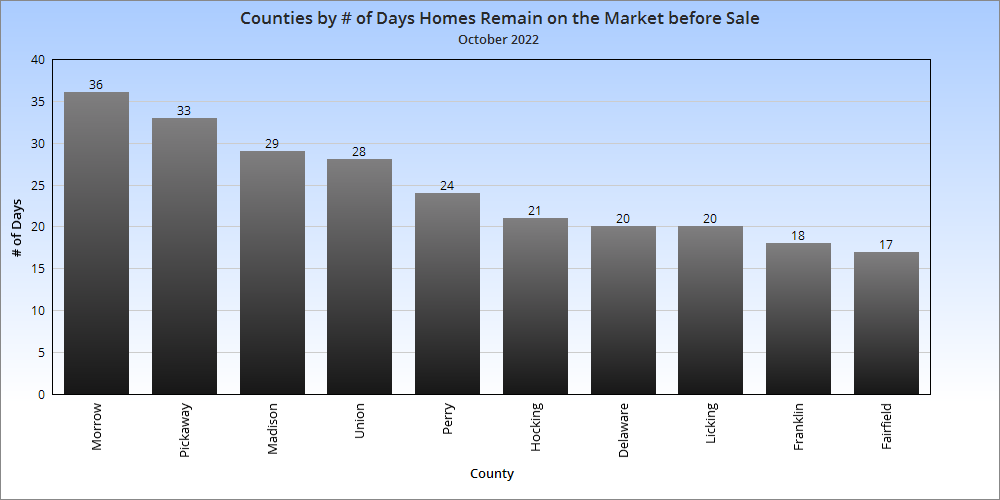
Average # of Days Homes Remain on the Market Before Sale for the Metro Overall in October, 2022: 24.6 # of Days Homes Remain on the Market Before Sale for the Metro October, 2021 vs. October, 2022: +8.2 Homes across the market sold more than a week more slowly year-over year in October.
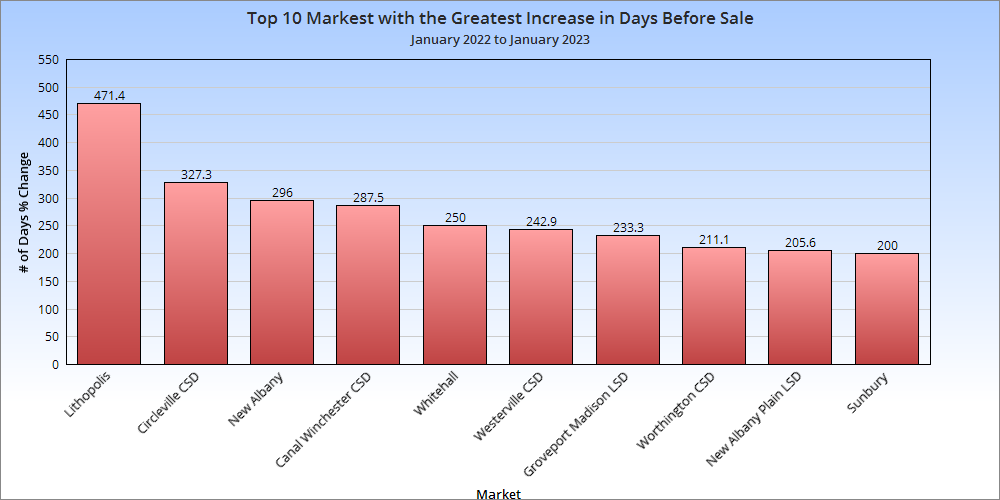
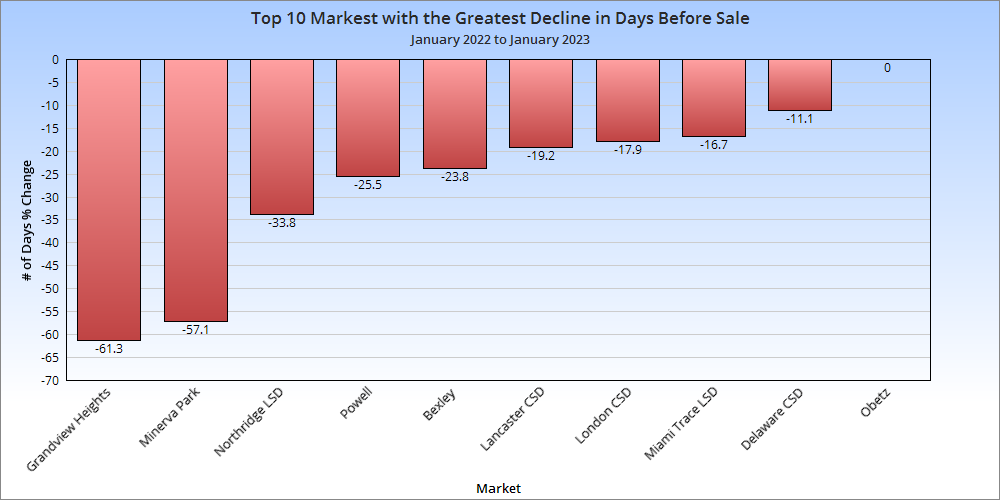
Aside from the half-dozen markets that saw declines, most saw fairly significantly increases in the number of days before sale year-over year.
Overall, the October housing market showed strong signs of a slowdown, but so far, this hasn’t prevented further price increases. Demand for homes seems to be continuing to outpace supply, but perhaps not quite to the level it was earlier in the year.