And here were the top 25 cities with the highest numeric growth 2010-2018. 1. Columbus: +105,500 2. Hilliard: +7,979 3. Dublin: +6,896 4. Grove City: +6,050 5. Cincinnati: +5,662 6. Delaware: +5,177 7. North Ridgeville: +4,424 8. Westerville: +4,267 9. New Albany: +3,165 10. Pickerington: +2,910 11. Mason: +2,874 12. Newark: +2,456 13. Reynoldsburg: +2,385 14. Gahanna: +2,303 15. Wadsworth: +2,214 16. Beavercreek: +2,198 17. Marysville: +2,173 18. Avon: +2,070 19. Powell: +1,809 20. Grandview Heights: +1,785 21. Upper Arlington: +1,751 22. Harrison: +1,711 23. Lancaster: +1,634 24. Oxford: +1,514 25. Sunbury: +1,485
Columbus’ growth is very impressive in Ohio, but it has also been a top 15 fastest-growing city in the country for the past few years now, and there appears to be little standing in the way of that continuing.
Columbus’s foreign-born population origins are much more varied, and the overall population larger, than what one might expect. As of 2017, they made up 12% of the city’s population, the highest in more than 100 years. I’ve looked at such numbers before, but I wanted to update for the most recent available numbers.
A lot has happened in the past week, so Week in Review 4 is jammed full with site updates.
First up, the proposed new Hilton Hotel at the Convention Center continues to get taller, and now stands currently proposed for 28 stories. Construction is not set to begin until possibly next fall, so we have a while to see if any further changes occur.
The latest rendering.
Crew fans got huge news a few months back that a new ownership group was looking to buy the team and keep them in Columbus. This week, it was announced as to what would happen to both Mapfre Stadium, as well as the first renderings and location of a brand new Arena District stadium. The new stadium would be built along with a new mixed-use neighborhood called Confluence Village. It would include offices, restaurant/retail space, 885 apartments and a riverfront park.
Franklinton continues to move up in the world with the new renderingsof the CoverMyMeds campus. The $240 million project would be one of the largest investment in the neighborhood in perhaps… ever.
Other news… Google may build a $600 million data center in New Albany.
And “Planet Oasis”, the proposed $2 billion entertainment complex in Delaware county, still looks unlikely to happen as the feud between its former development partners continues.
The oldest buildings on Capital Square finally received some funding for the proposal to renovate them into office space. The buildings date to 1869 and 1901.
The former Graham Ford dealership in Franklinton was purchased by Pizzuti Companies. The 7-acre site is to the west of 315, away from where recent development has been concentrated, so the site may remain undeveloped for a while yet. But it indicates where the future of Franklinton overall is headed.
https://mappingstudentdebt.org/#/map-1-an-introduction This link shows total student debt mapped by zip code for the entire country. Scroll down to any city to find out student debt delinquency rates, incomes and loan balances.
Given that the 2017 demographic information was released yesterday by the US Census, it’s time to revisit this Columbus foreign-born population comparison and update it with the new data.
First up, let’s take a look at total foreign-born populations. I have looked at this topic some in the past, but I have never done a full-scale comparison for this topic.
Total Foreign-Born Population Rank by City 2000, 2010 and 2017 2000—————————————-2010———————————-2017 1. Chicago, IL: 628,903———–1. Chicago: 557,674—————1. Chicago: 563,688 2. San Jose, CA: 329,750——–2. San Jose: 366,194————-2. San Jose: 417,148 3. San Antonio, TX: 133,675—-3. San Antonio: 192,741———-3. San Antonio: 212,109 4. Austin, TX: 109,006————4. Austin: 148,431——————4. Austin: 177,844 5. Las Vegas, NV: 90,656——-5. Las Vegas: 130,503————-5. Charlotte: 147,074 6. Sacramento, CA: 82,616—–6. Chalotte: 106,047—————6. Las Vegas: 139,790 7. Portland, OR: 68,976———7. Sacramento: 96,105————-7. Sacramento: 111,904 8. Charlotte, NC: 59,849——–8. Columbus: 86,663—————-8. Columbus: 105,826 9. Minneapolis, MN: 55,475—–9. Portland: 83,026—————–9. Indianapolis: 89,465 10. Columbus: 47,713———–10. Indianapolis: 74,407———–10. Portland: 89,050 11. Milwaukee, WI: 46,122—–11. Nashville: 73,327—————11. Nashville: 86,271 12. Detroit, MI: 45,541———–12. Minneapolis: 57,846———–12. Minneapolis: 69,567 13. Providence, RI: 43,947—–13. Milwaukee: 57,222————-13. Orlando: 68,811 14. St. Paul, MN: 41,138——-14. Providence: 52,920————14. St. Paul: 64,056 15. Nashville, TN: 38,936——-15. St. Paul: 50,366—————-15. Milwaukee: 59,443 16. Indianapolis, IN: 36,067—-16. Orlando: 43,747—————-16. Providence: 54,520 17. Virginia Beach, VA: 28,276–17. Virginia Beach: 40,756—–17. Omaha: 51,041 18. Wichita, KS: 27,938———18. Omaha: 39,288—————18. Virginia Beach: 42,319 19. Orlando, FL: 26,741——–19. Wichita: 39,128—————–19. Detroit: 41,374 20. Omaha, NE: 25,687———-20. Kansas City: 35,532———20. Wichita: 40,427 21. Kansas City, MO: 25,632—21. Detroit: 34,307—————-21. Kansas City: 37,833 22. Cleveland: 21,372————22. Madison: 24,929————–22. Madison: 32,066 23. Grand Rapids, MI: 20,814—23. St. Louis: 23,011————23. Des Moines: 29,876 24. St Louis, MO: 19,542——–24. Lincoln: 22,214—————24. Pittsburgh:26,504 25. Pittsburgh, PA: 18,874——-25. Des Moines: 20,798——–25. Grand Rapids: 26,014 26. Madison, WI: 18,792———26. Pittsburgh: 18,698———–26. Lincoln: 25,689 27. Des Moines, IA: 15,713—–27. Cleveland: 17,739————27. St. Louis: 23,659 28. Lincoln, NE: 13,246———-28. Grand Rapids: 16,615——-28. Fort Wayne: 22,186 29. Cincinnati: 12,461————29. Cincinnati: 16,531————29. Cleveland: 21,992 30. Fort Wayne, IN: 10,187—–30. Fort Wayne: 15,286———30. Cincinnati: 19,085 31. Toledo: 9,475——————31. Toledo: 11,159—————31. Akron: 13,423 32. Akron: 6,911——————-32. Akron: 8,524——————-32. Toledo: 11,260 33. Dayton: 3,245—————–33. Dayton: 5,102——————33. Dayton: 6,743 34. Youngstown: 1,605———-34. Youngstown: 3,695———–34. Youngstown: 1,401
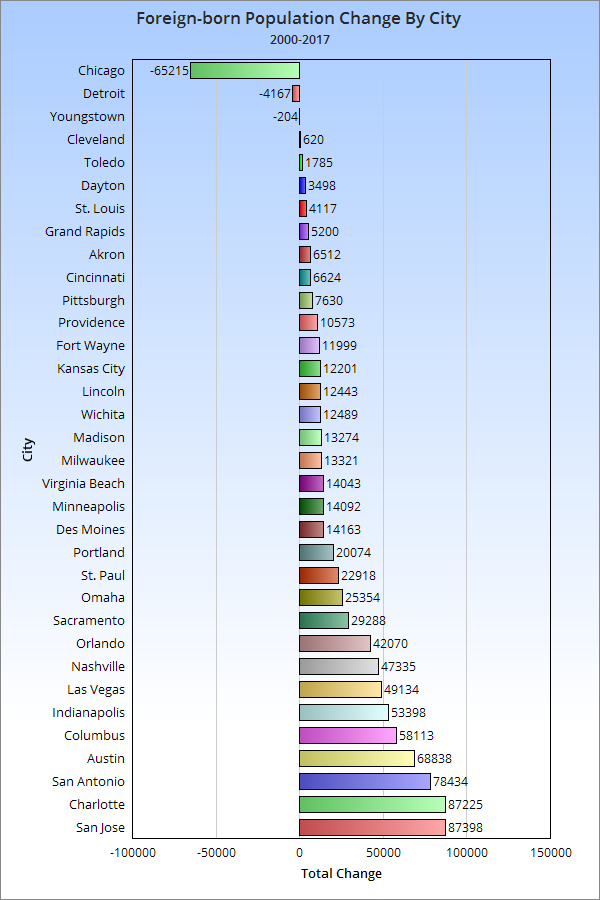
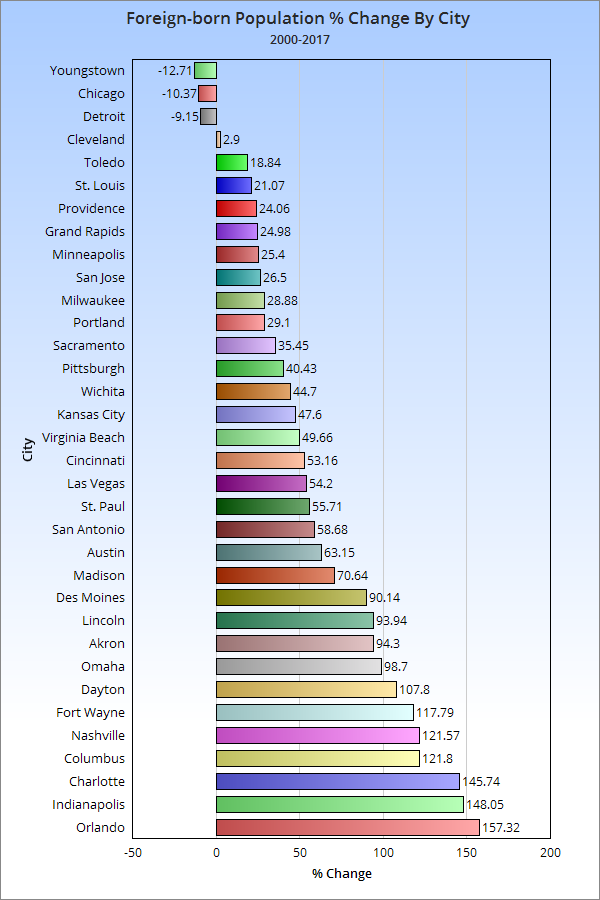
Here’s the 2000-2017 total change. And the 2000-2017 change by %.
So Columbus has had above average total and % growth compared to its peers nationally since 2000. What about more recently?
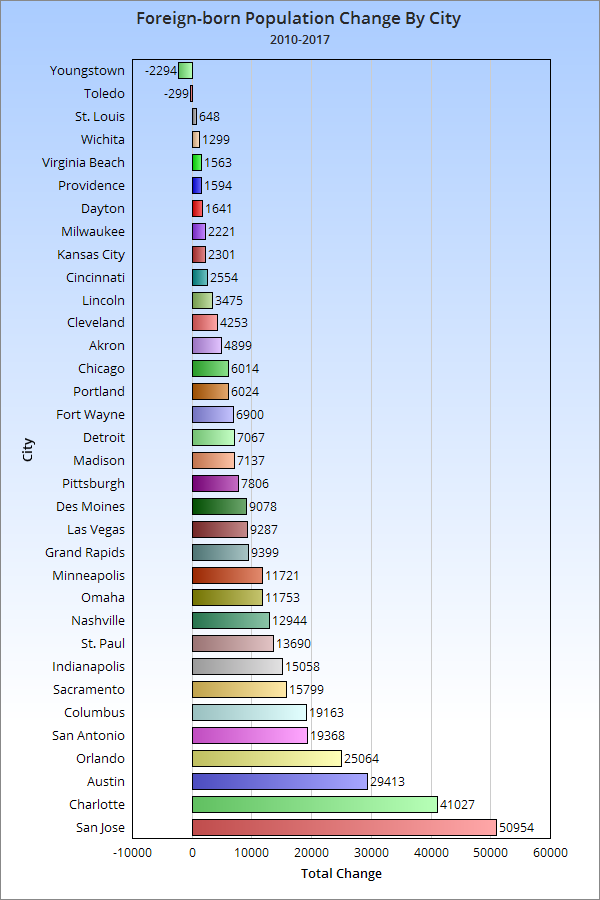
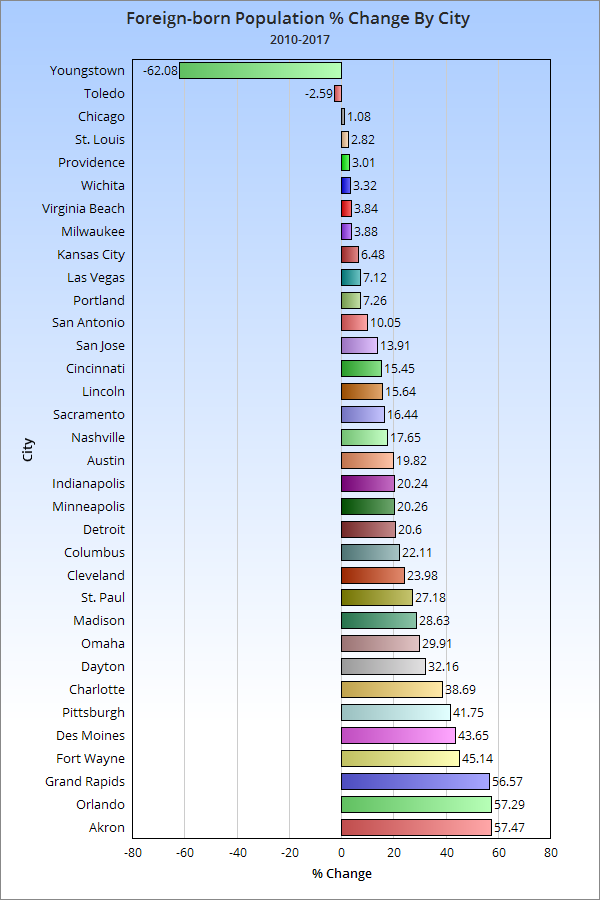
Total change 2010-2017. And the 2010-2017 change by %. So now that we know how many foreign-born immigrants are arriving, let’s take a look at where they are coming from.
Total Foreign-Born Residents From Europe in 2000 and 2017 2000———————————————–2017 1. Chicago: 145,462———————1. Chicago: 96,656 2. San Jose: 21,904———————2. San Jose: 25,147 3. Portland: 17,572———————-3. Portland: 16,548 4. Las Vegas: 9,070———————4. Austin: 13,337 5. Cleveland: 8,796———————-5. Charlotte: 9,775 6. St. Louis: 8,543———————–6. Las Vegas: 8,536 7. San Antonio: 8,323——————7. San Antonio: 7,852 8. Sacramento: 8,204——————8. Virginia Beach: 7,368 9. Milwaukee: 7,841——————–9. Columbus: 6,860 10. Charlotte: 7,487——————–10. Indianapolis: 6,344 11. Austin: 7,474————————11. Sacramento: 6,008 12. Pittsburgh: 7,413——————-12. Nashville: 5,778 13. Columbus: 7,017——————-13. Orlando: 5,516 14. Indianapolis: 6,543—————-14. Minneapolis: 5,477 15. Virginia Beach: 6,333————-15. Milwaukee: 4,388 16. Detroit: 5,600————————16. Pittsburgh: 4,265 17. Minneapolis: 5,409—————–17. Providence: 4,022 18. Providence: 5,126——————18. Lincoln: 3,908 19. Nashville: 4,859——————–19. St. Louis: 3,680 20. Cincinnati: 3,851——————-20. Cincinnati: 3,556 21. Grand Rapids: 3,396————–21. Omaha: 3,483 22. Omaha: 3,320———————–22. Cleveland: 3,399 23. St. Paul: 3,255———————-23. Kansas City: 3,362 24. Des Moines: 3,216—————-24. Madison: 2,867 25. Kansas City: 2,985—————-25. St. Paul: 2,394 26. Madison: 2,871——————–26. Detroit: 2,393 27. Lincoln: 2,701———————-27. Fort Wayne: 2,388 28. Akron: 2,687———————–28. Des Moines: 2,156 29. Orlando: 2,509——————–29. Wichita: 1,660 30. Fort Wayne: 2,076—————30. Grand Rapids: 1,517 31. Toledo: 2,020———————31. Akron: 1,286 32. Wichita: 2,004———————32. Toledo: 1,242 33. Dayton: 901———————–33. Dayton: 877 34. Youngstown: 870—————-34. Youngstown: 173
Columbus had a high number of Europeans versus most peers, but almost all cities saw drops in this demographic between 2000 and 2017, some quite drastic. Columbus’ drop was relatively minor.
Total Foreign-born Population from Asia 2000 and 2017 2000————————————————–2017 1. San Jose: 182,712—————————1. San Jose: 262,208 2. Chicago: 112,932—————————-2. Chicago: 140,434 3. Sacramento: 40,253————————-3. Austin: 57,584 4. Portland: 26,271——————————4. Sacramento: 53,731 5. Austin: 25,036——————————–5. Charlotte: 46,698 6. St. Paul: 23,245——————————6. Columbus: 43,706 7. Columbus: 22,354—————————7. San Antonio: 40,642 8. Minneapolis: 17,376————————8. Portland: 38,224 9. Las Vegas: 17,062————————–9. Las Vegas: 35,087 10. San Antonio: 15,840———————-10. St. Paul: 34,678 11. Charlotte: 15,734————————–11. Nashville: 26,155 12. Virginia Beach: 15,176——————-12. Indianapolis: 23,934 13. Detroit: 15,114——————————13. Virginia Beach: 23,625 14. Nashville: 12,573—————————14. Madison: 18,795 15. Milwaukee: 12,114————————-15. Detroit: 18,681 16. Wichita: 10,826—————————–16. Milwaukee: 17,838 17. Madison: 9,736—————————–17. Minneapolis: 15,967 18. Indianapolis: 9,190————————-18. Pittsburgh: 15,873 19. Pittsburgh: 7,938—————————-19. Wichita: 15,466 20. Providence: 7,871————————–20. Omaha: 14,504 21. Kansas City: 7,312————————-21. Lincoln: 13,804 22. Lincoln: 6,691——————————-22. Kansas City: 12,043 23. St. Louis: 6,425—————————–23. Fort Wayne: 10,972 24. Omaha: 6,302——————————-24. Des Moines: 10,691 25. Cleveland: 6,213—————————25. St. Louis: 9,632 26. Des Moines: 5,239————————26. Orlando: 8,122 27. Orlando: 4,530—————————–27. Akron: 7,862 28. Cincinnati: 4,326————————–28. Cleveland: 7,450 29. Toledo: 3,847——————————29. Providence: 6,668 30. Grand Rapids: 3,206———————30. Grand Rapids: 6,585 31. Akron: 3,099——————————-31. Toledo: 6,196 32. Fort Wayne: 2,792————————32. Cincinnati: 6,002 33. Dayton: 903———————————33. Dayton: 1,614 34. Youngstown: 338————————–34. Youngstown: 448
Columbus ranks even higher with its foreign-born Asian population.
Total Foreign-born Population from Africa 2000 and 2017 2000—————————————————2017 1. Minneapolis: 12,765——————–1. Columbus: 33,607 2. Chicago: 12,613————————-2. Chicago: 26,995 3. Columbus: 9,530————————3. Minneapolis: 25,286 4. San Jose: 5,189————————-4. Nashville: 18,387 5. Charlotte: 4,722————————–5. Charlotte: 18,234 6. St. Paul: 4,697—————————-6. Indianapolis: 17,452 7. Nashville: 4,183————————–7. St. Paul: 15,926 8. Detroit: 3,249—————————–8. Omaha: 7,496 9. Providence: 3,138———————–9. San Jose: 7,400 10. Indianapolis: 2,650——————–10. Portland: 7,059 11. Portland: 2,430————————-11. Austin: 6,469 12. Austin: 2,263—————————-12. Des Moines: 6,124 13. Kansas City: 2,192——————–13. San Antonio: 5,718 14. Cincinnati: 1,781———————–14. Kansas City: 5,051 15. St. Louis: 1,500————————-15. St. Louis: 4,977 16. Omaha: 1,497—————————16. Providence: 4,697 17. San Antonio: 1,358——————–17. Milwaukee: 4,423 18. Milwaukee: 1,332———————-18. Cincinnati: 4,207 19. Cleveland: 1,075———————–19. Grand Rapids: 3,754 20. Sacramento: 1,051——————–20. Sacramento: 2,955 21. Des Moines: 1,038——————–21. Pittsburgh: 2,731 22. Madison: 991—————————22. Cleveland: 2,728 23. Orlando: 983—————————23. Orlando: 2,552 24. Wichita: 946—————————-24. Akron: 2,311 25. Las Vegas: 916———————–25. Madison: 2,180 26. Pittsburgh: 905————————26. Wichita: 2,142 27. Virginia Beach: 840——————27. Las Vegas: 1,846 28. Grand Rapids: 718——————-28. Lincoln: 1,680 29. Toledo: 638—————————-29. Dayton: 1,397 30. Lincoln: 637—————————30. Detroit: 1,082 31. Dayton: 522—————————-31. Virginia Beach: 847 32. Fort Wayne: 384———————-32. Fort Wayne: 628 33. Akron: 197—————————–33. Toledo: 615 34. Youngstown: 50———————-34. Youngstown: 0
Columbus has claimed the number 1 spot in its foreign-born African population, passing previous top city Minneapolis.
And finally, the total foreign-born population from the Americas in 2000 and 2017 2000—————————————————-2017 1. Chicago: 357,235————————–1. Chicago: 297,926 2. San Jose: 117,989————————2. San Antonio: 157,629 3. San Antonio: 107,906——————–3. San Jose: 120,657 4. Austin: 73,935——————————4. Austin: 99,482 5. Las Vegas: 63,277————————5. Las Vegas: 93,693 6. Charlotte: 31,625————————–6. Charlotte: 72,211 7. Sacramento: 28,927———————-7. Orlando: 52,421 8. Providence: 27,649———————–8. Sacramento: 42,632 9. Milwaukee: 24,781————————9. Indianapolis: 41,554 10. Detroit: 21,527—————————10. Providence: 39,093 11. Portland: 20,939————————-11. Nashville: 35,719 12. Minneapolis: 19,648——————–12. Milwaukee: 32,630 13. Orlando: 18,639————————-13. Portland: 25,417 14. Indianapolis: 17,530——————–14. Omaha: 25,385 15. Nashville: 17,125————————15. Minneapolis: 22,688 16. Omaha: 14,467————————–16. Columbus: 21,578 17. Wichita: 13,988—————————17. Wichita: 20,983 18. Grand Rapids: 13,477——————18. Detroit: 19,143 19. Kansas City: 12,948———————19. Kansas City: 17,377 20. St. Paul: 9,804—————————-20. Grand Rapids: 14,158 21. Columbus: 8,596————————21. St. Paul: 10,878 22. Des Moines: 6,201———————-22. Des Moines: 10,627 23. Virginia Beach: 5,754——————23. Virginia Beach: 10,415 24. Cleveland: 5,192————————24. Cleveland: 8,386 25. Madison: 5,080————————–25. Fort Wayne: 8,198 26. Fort Wayne: 4,930———————-26. Madison: 8,031 27. Lincoln: 3,106—————————-27. Lincoln: 6,190 28. St. Louis: 2,961————————–28. Cincinnati: 5,320 29. Toledo: 2,942—————————-29. St. Louis: 5,008 30. Pittsburgh: 2,463————————30. Pittsburgh: 3,443 31. Cincinnati: 2,432————————31. Toledo: 3,207 32. Dayton: 919——————————32. Dayton: 2,855 33. Akron: 891——————————-33. Akron: 1,699 34. Youngstown: 333———————–34. Youngstown: 780
Columbus does the worst with this group, but even here it moved up 5 spots in the rankings.
The rest of the foreign-born population is made up of small groups of people from Oceania- or basically island nations.