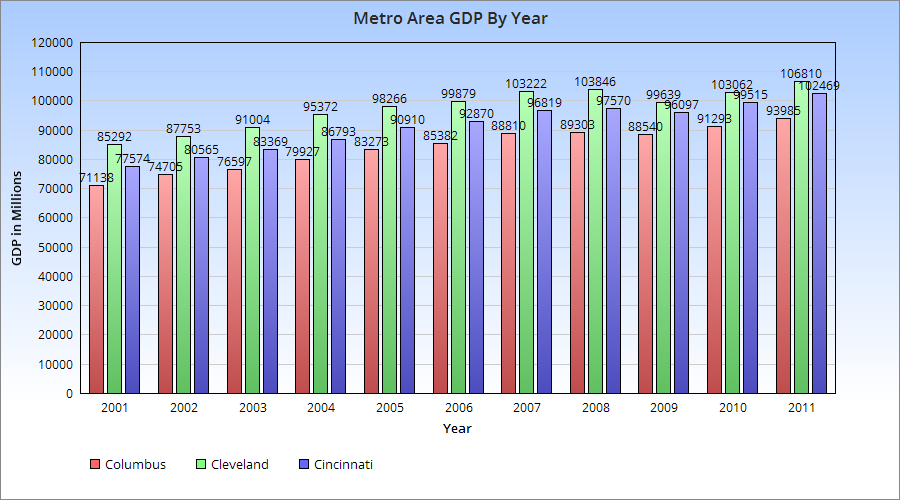
Recently the US Bureau of Economic Analysis released GDP numbers for metro areas for 2011. Below is a chart for Ohio’s 3-Cs of GDP from 2001 to 2011.
All the metros saw GDP growth during this period, and all saw dips during the recession before growing again the past few years.
Total Growth (in Millions) 2001-2011 Cincinnati: $24,795 Columbus: $22,850 Cleveland: $21,518
GDP % Growth 2001-2011 Columbus: 32.1% Cincinnati: 31.9% Cleveland: 25.2%
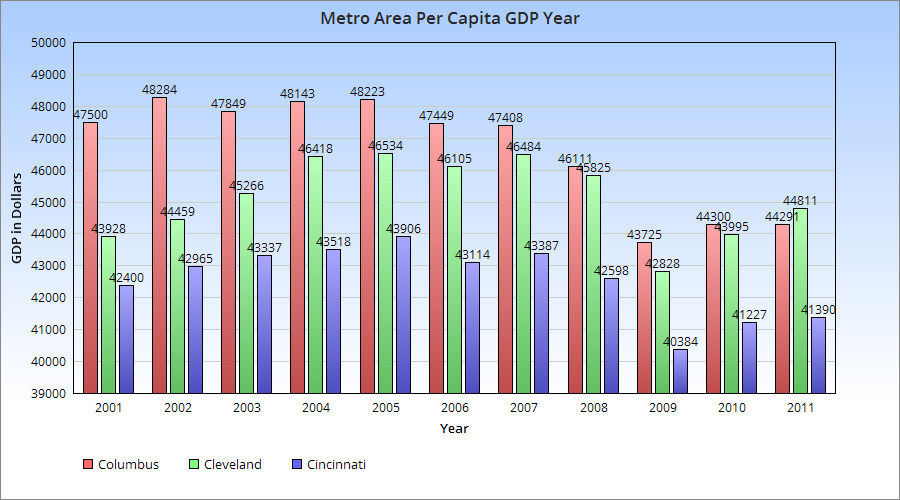
So this shows that the Columbus metro has had the fastest growth the past 10 years in its GDP, albeit only a bit faster than Cincinnati. The graph above shows the metro GDP per capita. Columbus was clearly ahead the first half of the last decade, but has fallen since. There are two reasons for this: Continuously growing population and the recession. A growing population and stagnant GDP during the recession meant that the GDP was diluted between more people. Neither of the other two faced the strong population growth during the recession. I expect the trends will reverse again over the next few years, however.
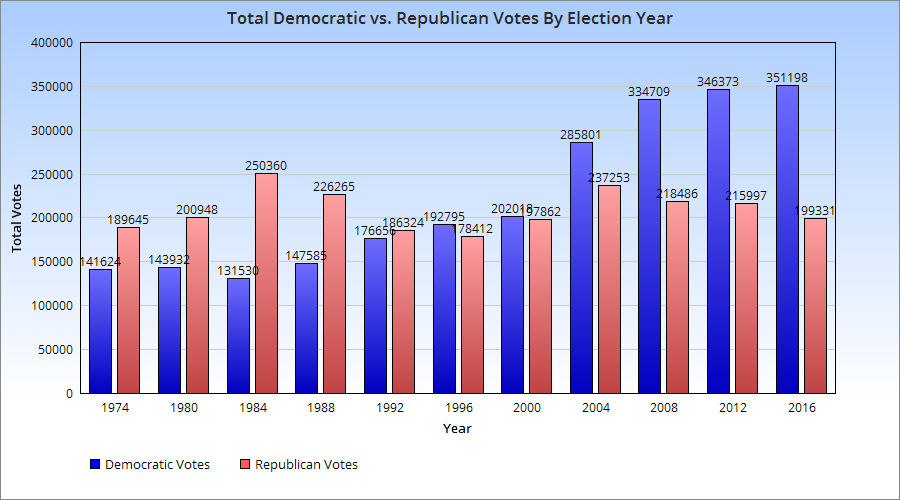
With the presidential election just a few months ago, I thought it might be interesting to look at how Franklin County has voted over time. I went back to the presidential election of 1976 as that is the earliest I could find individual county totals.
First, let’s look at the total number of votes that were for the Democratic candidates vs the total number of votes for the Republican candidate. As the graph above shows, the number of Democratic votes has gradually been rising, and first surpassed Republican votes in the 1996 election. Meanwhile, Republican votes have more or less held steady, seeing no appreciable gains or declines over the course of the period of record.
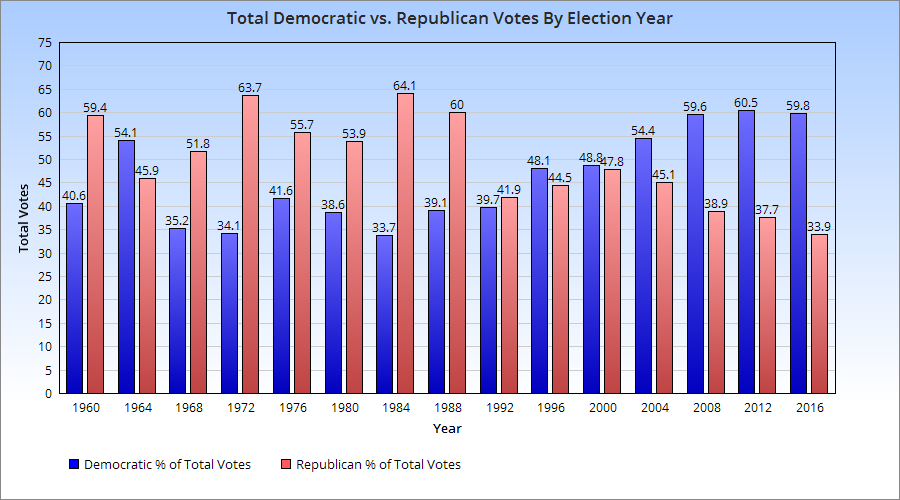
What about votes as a %? For this, I was able to go back a bit further in the records. This graph shows a very similar story, only a bit more stark, with Republicans clearly losing its share of the vote over the period with Democrats gaining.
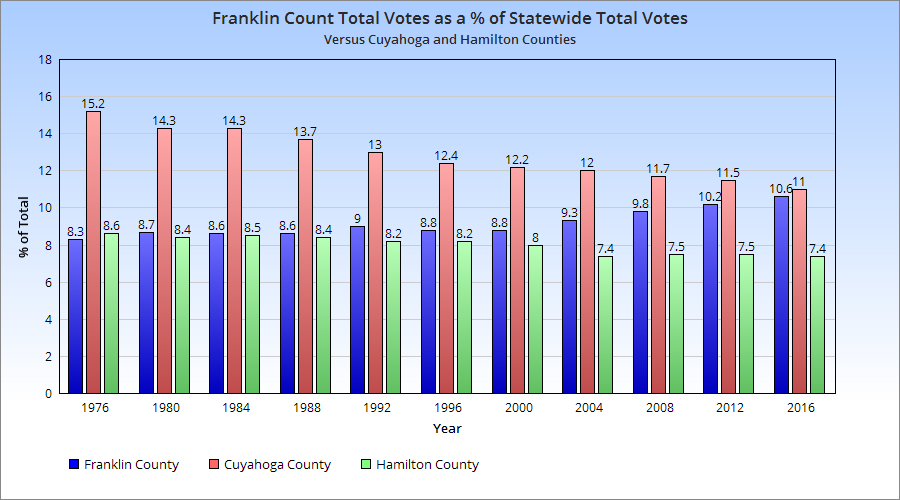
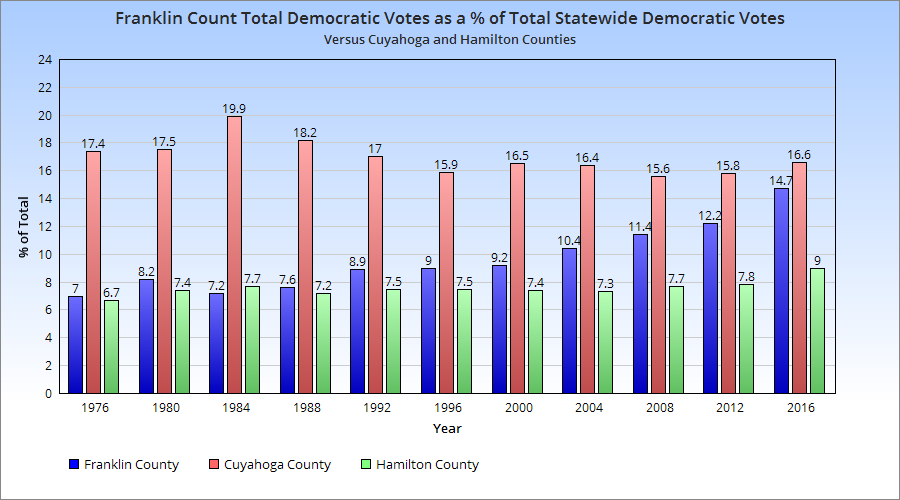
Not only are the voting habits of the county changing, but Franklin County’s share of the statewide vote is also growing. In the graph below, Franklin County is compared to Cincinnati’s Hamilton County and Cleveland’s Cuyahoga County showing the % share of total statewide votes for each. Franklin County’s has been steadily rising over time, while both other counties have lost some share over the period. And it is also becoming a bigger player in the statewide % of Democratic votes. If these trends continue, Columbus’ Franklin County may end up passing Cuyahoga County not only as the most “Blue” county in the state, but the most influential county as well.
In Part 1 I talked a little about the history of passenger rail in Columbus and how no such service has existed within the city since 1977. In Why Columbus doesn’t have rail Part 2, we review the bad luck, bad decisions and just plain confusion that has prevented the otherwise very successful city from going beyond the bus.
Rail was being mentioned to make a comeback as early as the dawn of the 1980s. In 1980, COTA (Central Ohio Transit Authority) was able to convince area residents to pass a 0.5% sales tax to fund a list of ambitious projects, as well as promising free Downtown service. When the money from the sales tax came in, COTA decided to overreach and proposed a controversial plan to use the extra money. Called Transit80+, the plan had transit goals of articulated buses and a Downtown transit mall, as well as a proposal for a North Side light rail system (Why there, I don’t know). The development would be paid for with the $76 million surplus that COTA was running. Ironically, these projects largely died because of funding and support issues. Within a few years, COTA’s financial situation was changing. Federal budget cuts and the expiration of the sales tax in 1984 began to shrink the overall transit budget. Beyond the money, however, the public had reacted overwhelmingly negatively to the 1980 plan. Many felt that COTA needed to improve its already-existing bus service before spending money by jumping into other forms of transit. Consider this was only about 5 years after passenger rail left the city, and many people did not feel like it needed to be brought back.
Union Station demolition in 1977.
In 1987, talk mounted for a monorail system in the Downtown area. The $40 million proposal included a large loop that wound through the Ohio Pen site (Arena District), the Scioto Peninsula, the county office complex on South High and then up to the City Center site (Columbus Commons). A feasibility study was never completed (there was no money for it), and COTA had steadily shrinking money on hand when levies failed in 1986 and 1988. A 0.25% sales tax did pass in 1989, but most of that money was used to rebuild the budget and maintain existing services.
For a few years after that, there was scant mention of rail beyond COTA’s continued long-term goal planning. A 1991 study by COTA only mentioned a light rail system to be put into place by 2020, and it seemed like the city would not see it for decades. However, only a year later, in 1992, rail came up again when the city hosted the international floral show, AmeriFlora ’92 at Franklin and Wolf parks. The show sparked much conversation about Columbus’ future as a city and what was needed to revitalize the urban core, something that City Center and other developments had, up to then, failed to really do. A light rail system was part of that discussion, and by 1993, there was a flurry of news related to this development.
A Columbus version of Grand Central Station was being proposed for Downtown that would connect taxis, cars, buses, light rail and high-speed heavy rail that would link Ohio’s large cities. MORPC (the Mid-Ohio Regional Planning Commission) was deep into looking at potential locations, most of which were near the Ohio Pen site and the new convention center. Future mayor Michael Coleman was quoted in early 1993 saying, “We’re moving into the 21st century, and we need to prepare for that challenge.”
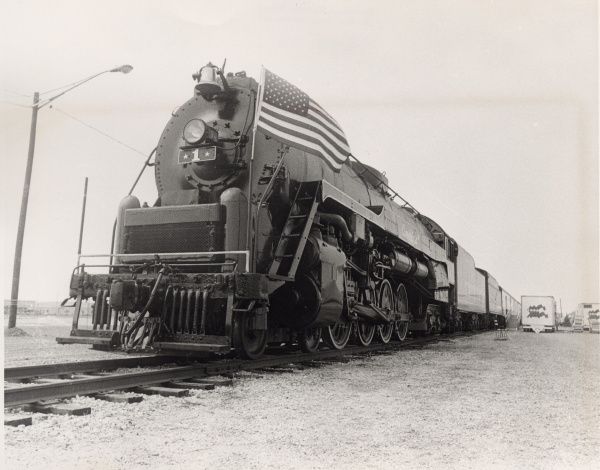
Beyond a city light rail system, suburbs and exurbs were also talking about a train. A proposal for a Columbus to Lancaster train was put forth. This was a proposal in addition to the Rt 33 bypass around Lancaster (which was eventually built) that would relieve growing congestion on the freeway. Also, a 3-C high speed train was being proposed and the idea was to have this system in place by 1995 with a connection at the proposed transit terminal near the convention center. The $3.2 billion high-speed 3-C train would’ve had an average speed of about 110mph with a max speed of 186mph, making the trip between Cincinnati and Cleveland in about 2 1/2 hours, even with stops.
Another proposal brought back the idea of a monorail system, though instead of a Downtown loop, the overhead system would run from just north of 270/Rt 23 to Downtown. The $110 million, 11-mile proposal would’ve been built in a corridor between Olentangy River Road and Cleveland Avenue and be capable of speeds of up to 75mph. The trains would’ve had 30 cars each and carry up to 5,000 people per hour.
Much of these developments (and others) were proposed to be completed by 2001.
The first snag came near the end of December 1993, when Nationwide refused to consider selling 5.3 acres it owned near the convention center that MORPC and COTA were interested in buying for the transit terminal. Nationwide insisted it hadn’t been consulted on the site bordered by High, Front, Nationwide and Spruce and had no interest in selling the property. The following month, the managing director of COTA and one of the biggest proponents of the hub and rail projects, announced he was leaving for Atlanta. The double-blow was bad, but not the end, yet. COTA and MORPC regrouped but still wanted the Nationwide site, which Nationwide still didn’t want to sell. The entire light-rail system’s proposed cost had risen to $522 million. In July 1994, COTA’s 13-member board approved the project moving forward… it only needed a 0.25% sales tax increase, with a vote scheduled for November 1995.
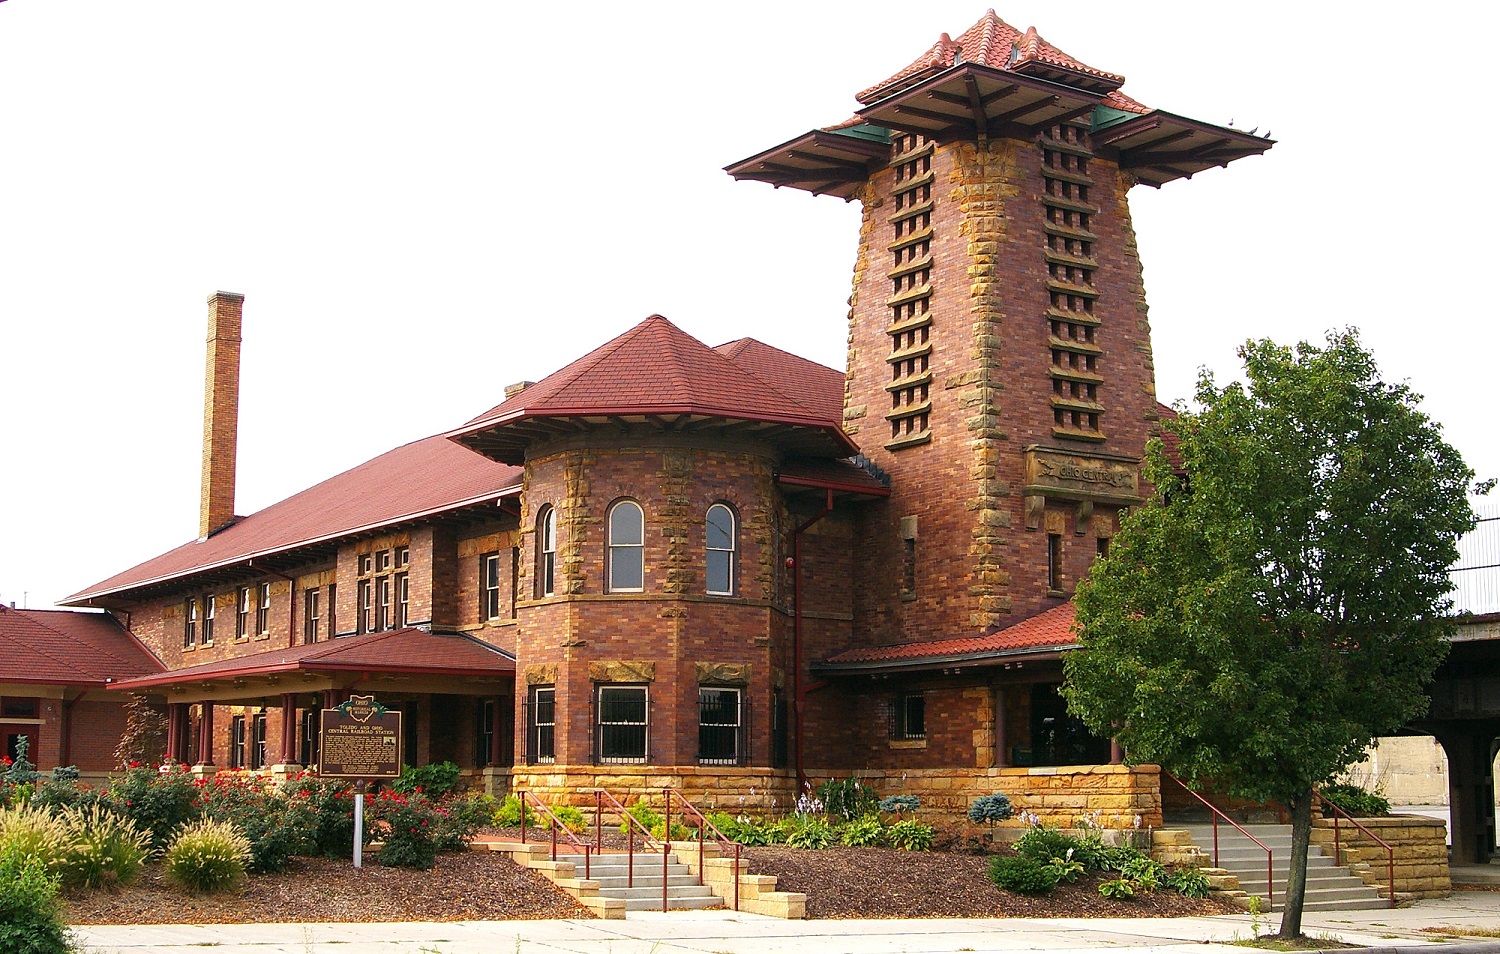
The old Toledo and Ohio Central Railroad Depot in Franklinton.
And then it all fell apart. Federal mass transit subsidies were cut by 12%, capital funding for bus replacement by 60% and state operating assistance by 4% Not only that, but future Ohio governor John Kasich, a Westerville US House representative, put forth a bill with massive mass transit cuts, especially to fixed systems like light rail. Without this money, the system would’ve had to have been entirely locally supported with another $65 million borrowed. The ambitious system suddenly proved too costly and COTA voted to pull the plan from its agenda. Columbus was not alone, as 25 other cities had to kill future or expansion rail plans. One has to wonder if Kasich had seen the momentum for rail in central Ohio and targeted these projects specifically with his national bill. This would not be the final time he would stand in the way of mass transit in Ohio. Ironically, in a poll taken the same week that COTA killed light rail plans, nearly 60% of the public surveyed in Columbus said they would’ve voted to support the November levy that would’ve built it. Instead, without the plans, the November 1995 levy failed. The location of the hub no longer mattered.
Three years later, in 1998, President Clinton signed a $217 billion package that would help fund 191 light rail projects nationally. COTA had no current rail plan and failed to submit any, so therefore was passed up on the funding. Despite this, COTA and MORPC once again prepared to sell the city on light rail, this time in order to pass a levy at the end of 1999. The hub idea was also revived, and the new location was directly across High Street from the convention center, in parking lots along N. Wall Street between Front and High.
Along with the hub, 8 commuter lines and a Downtown loop were proposed. The 8 lines were: -A northbound from Downtown to the Crosswoods area -A northwest line to Dublin along Rt 315 -A northeast line to Easton/Westerville parallel to Cleveland Avenue -An eastbound line to Gahanna and Reynoldsburg -A track along 33 northwest to southeast -A west track along Broad Street -A south track along Rt 3 The plan was once again ambitious, but COTA no longer had a good sales team. A public meeting for the plan in November 1998 only attracted 4 people. The word simply wasn’t getting out.
Leading up to the 1999 sales tax vote to pay for the new system, public reaction was generally positive, but there was still a lack of information available and the public seemed confused as to what would and wouldn’t happen and how it would be paid for. On voting day, the ballot seemed to lack any mention of rail whatsoever, as COTA had been barred from stating the purpose of the tax increase on the ballot. Not only that, but the ballot initiative was split into two parts. Issue 20 was a permanent 0.25% increase on sales tax while Issue 21 was for 10 years at the same rate. While the public was generally supportive of the rail plan, the split and the lack of wording on what the taxes were actually for confused many and they ended up going down to defeat. Columbus’ first (and last) vote on rail had gone down due to confusion and poor management by COTA.
Almost a decade later, Mayor Coleman once again revived the prospect of a rail system in 2007, though this time for streetcars Downtown and perhaps north and south along High Street. The idea was supported by COTA and MORPC, as well as through public polling, but many felt like streetcars really didn’t go far enough with the light rail concept, so many urban and light rail enthusiasts seemed to be underwhelmed by it all. Regardless of the lukewarm response, the proposal seemed to be moving forward. The following year, however, the economy began to crash into the Great Recession, and by 2010, with the election of John Kasich as governor, all mass transit projects at the time pretty much died. The revived 3-C high-speed train was single-handedly killed off by Kasich and it became very clear he would do everything he could to prevent mass transit projects from getting state funding. Cincinnati was able to get a streetcar passed, but almost exclusively from local support. The double whammy of the worst economic times since the Great Depression combined with state leadership that was wholly unfriendly to mass transit effectively shelved the streetcar proposal before it ever went very far.
Today, in early 2013, conditions have changed somewhat. The economy is gradually improving and COTA is running in the black, having the fastest growing ridership in the nation. More importantly, people seem to want to live in the city again, a development that no project like City Center could ever accomplish. Thousands of residential units are under construction or planned for the urban core of Columbus, Downtown is seeing dozens of new restaurants open, along with a new park, concert stage and the Scioto Mile. After 60 years of suburban-driven population growth, the city is making a dramatic and welcome return. But more than that, Columbus continues to grow, with the metro adding over 40,000 people in the past few years alone, and the city adding about half that. A recent article came out suggesting that Columbus now has the worst congestion of Ohio’s cities, and it is steadily getting worse.
These trends bode well for light rail and other forms of mass transit. The next time rail is brought up, it should (finally) move forward barring some major economic meltdown. Of course, given Columbus’ history of following Murphy’s Law when it comes to this subject, an alien invasion seems entirely possible.
To an urbanist, the following sets of photos are truly disturbing. I’ve heard it said many times over that Columbus is a new city filled with suburban design, and that it never really had a true urban, historic core. The sad thing is that that is dead wrong, and I say it’s sad because so much of it was lost in the name of progress. 99 years ago, Downtown was truly a beautiful, vibrant place, and the present-day shots only serve to make the transformation all that much more awful. You have to wonder what people were thinking in terms of design and the way that they systematically destroyed the environment that made the city what it was.
In any case, the photo set from 1914 was apparently taken by a photographer that walked the length of High Street starting from the intersection of Town Street all the way up to Goodale Avenue at the beginning of the Short North. They are some of the best historic photographs I’ve ever seen of Downtown Columbus. Let’s begin the tour.
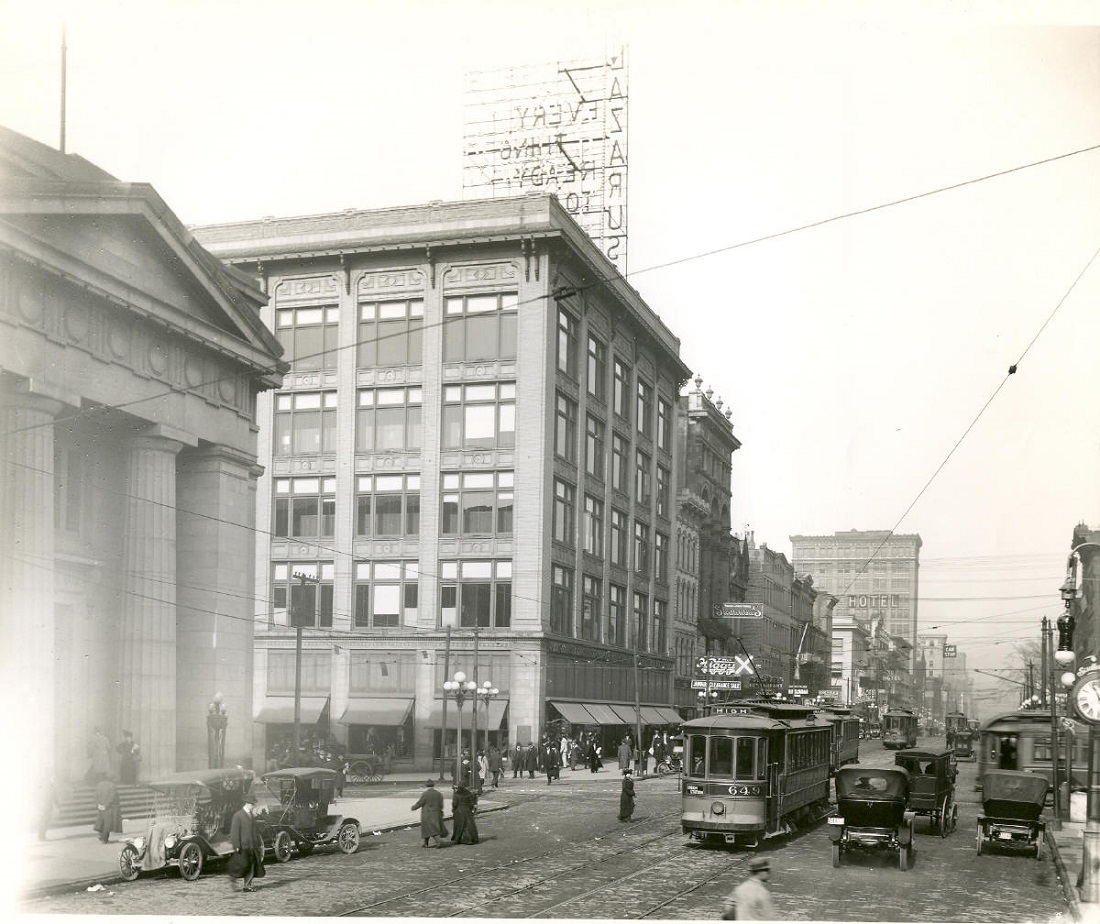
Photo taken at High and Town looking north.
The photo above at Town and High shows Lazarus Department Store on the left. It is one of the few buildings that remains today, as shown below.
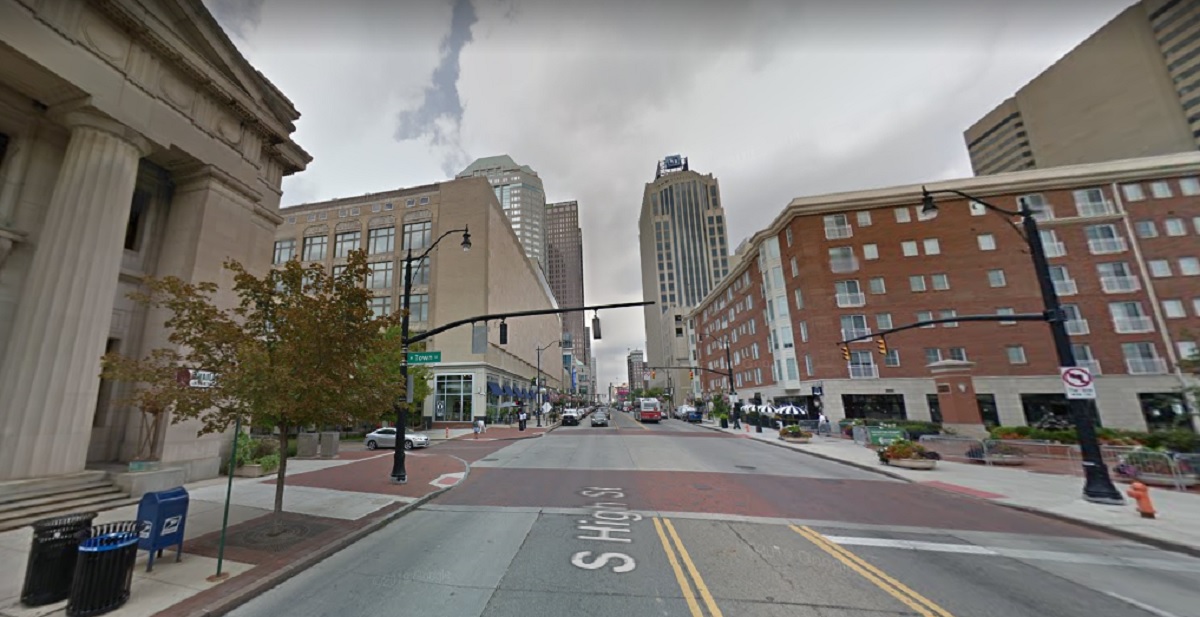
Town and High in 2016.
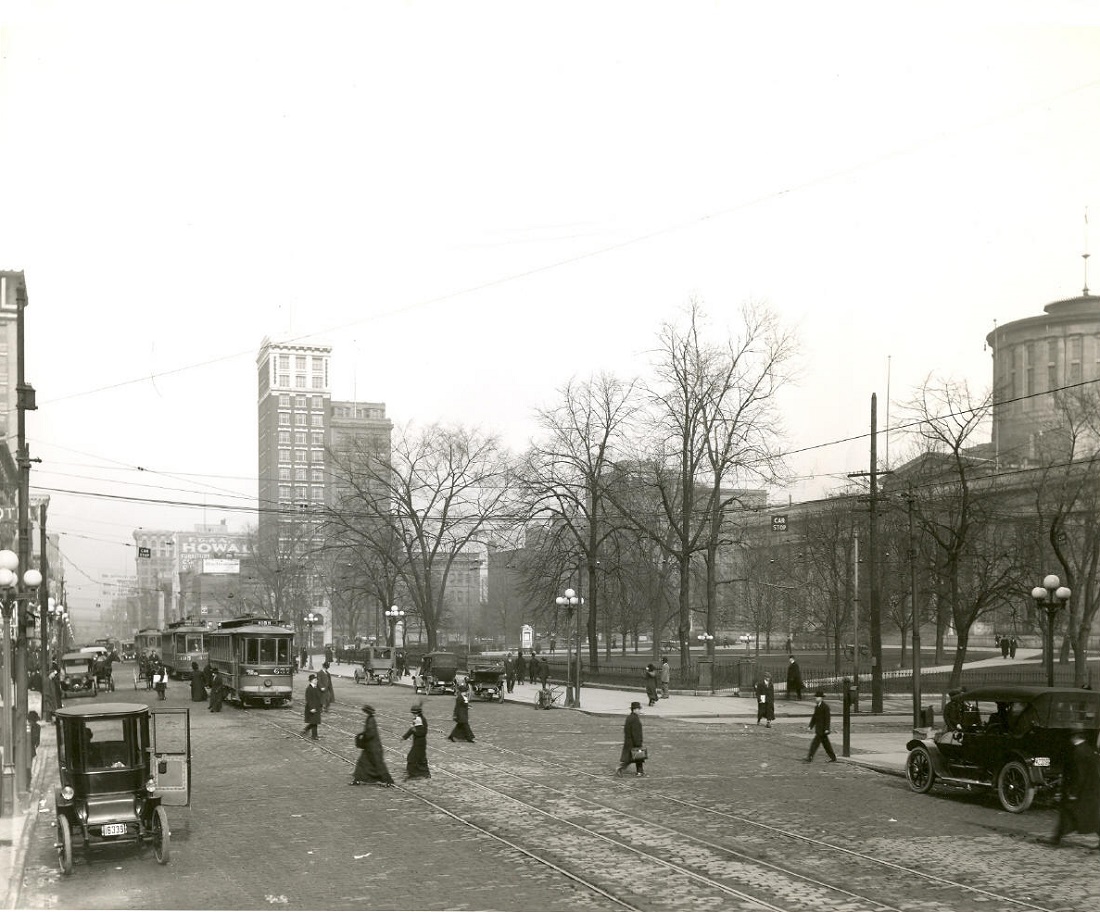
The next set is the before and after from Capital Square, just south of the Broad and High intersection. The tall building in the center of the photo is 8 E. Broad and one of the few still standing today.
Capital Square looking north.
Capital Square in 2016.
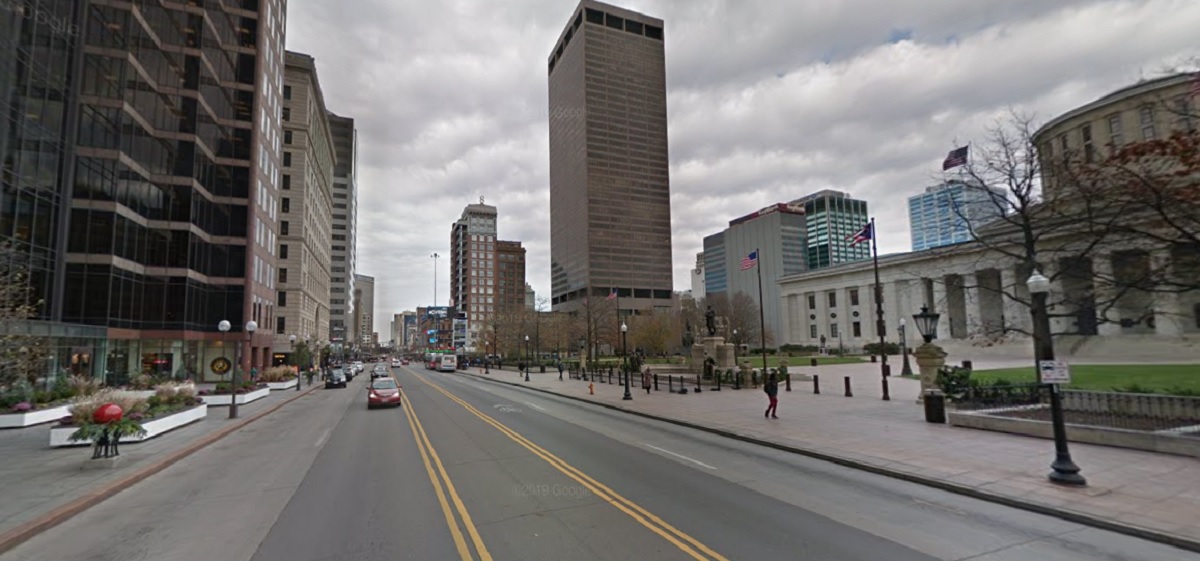
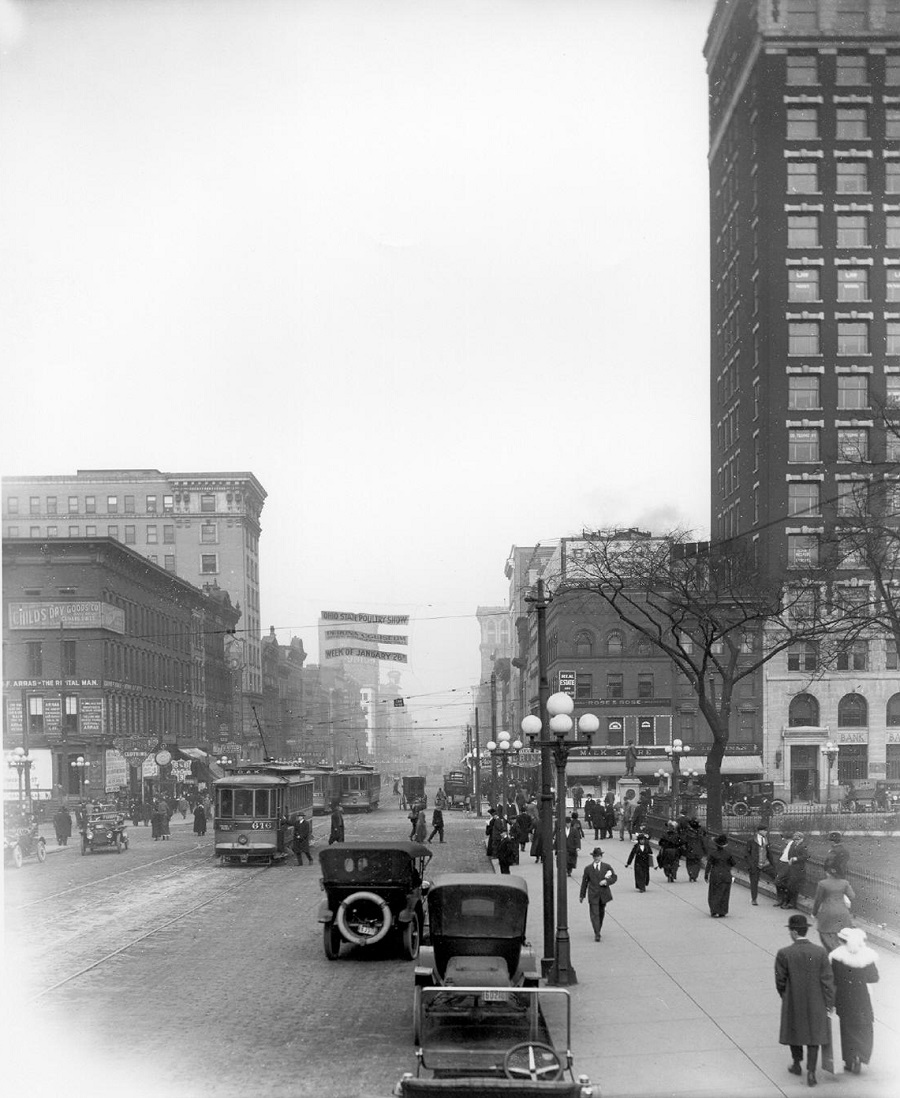
The next few photographs show the very heart of Downtown, the intersection of Broad and High. A few buildings remain, but most is gone.
Broad and High looking north.
Broad and High in 2018.
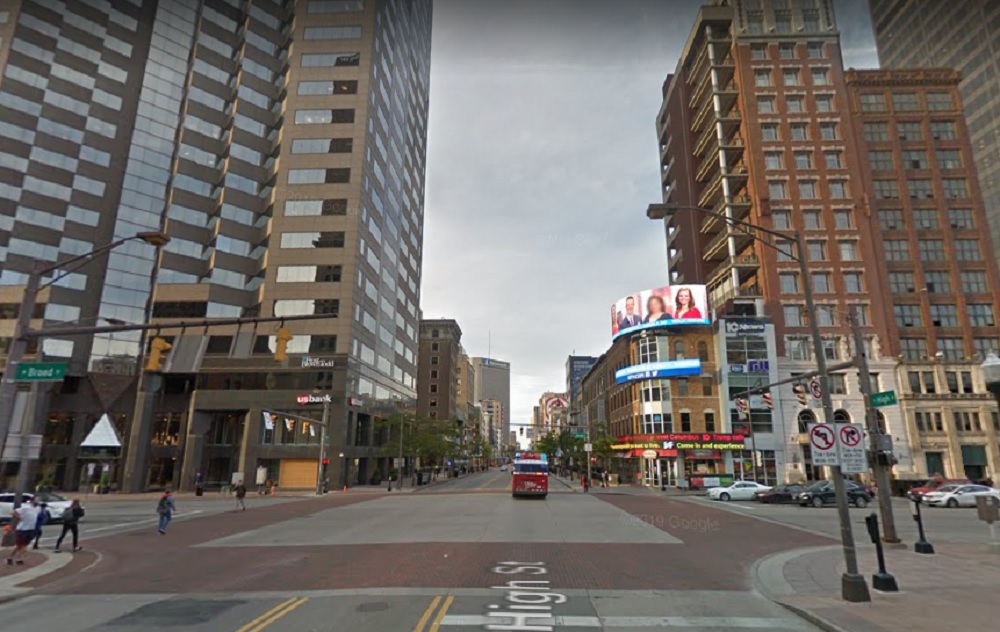
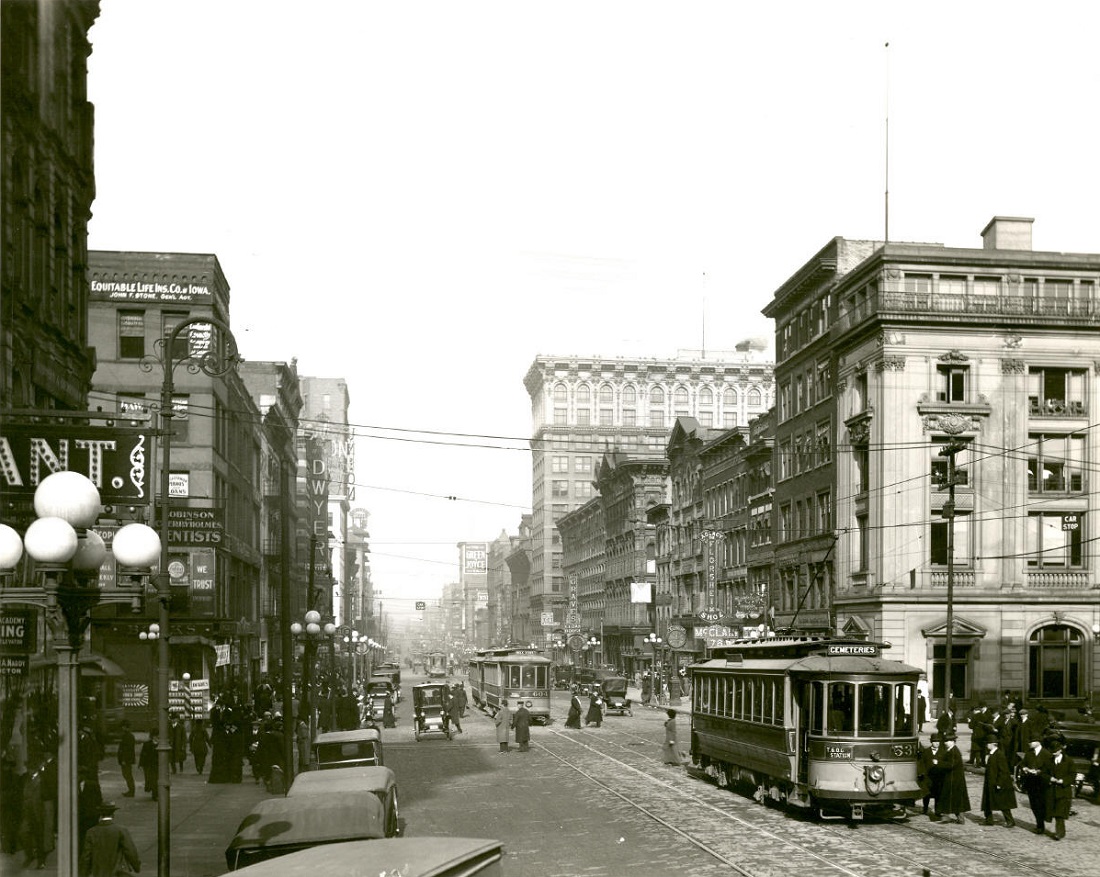
Next is High Street just north of Broad and looking north. Notice just how many buildings are gone.
High and Gay Street, looking north.
High and Gay in 2017.
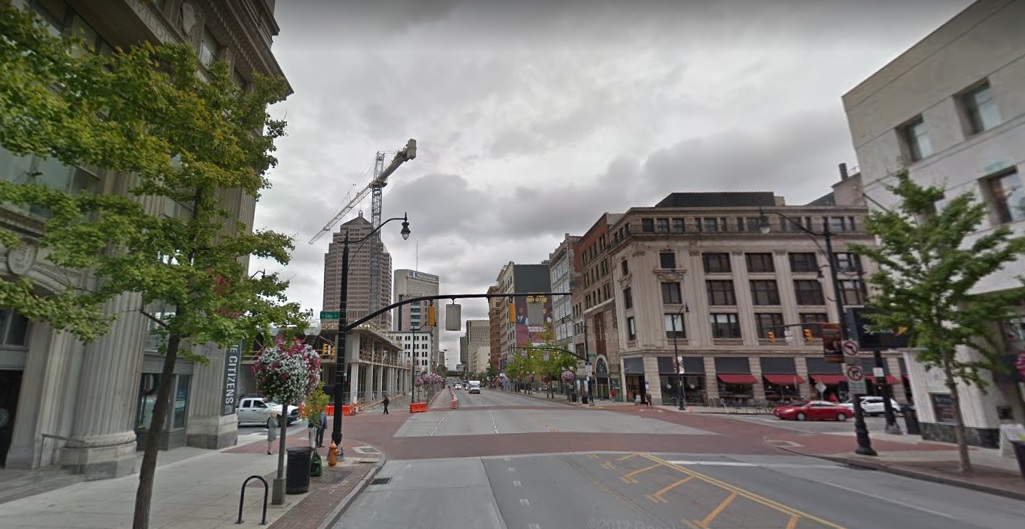
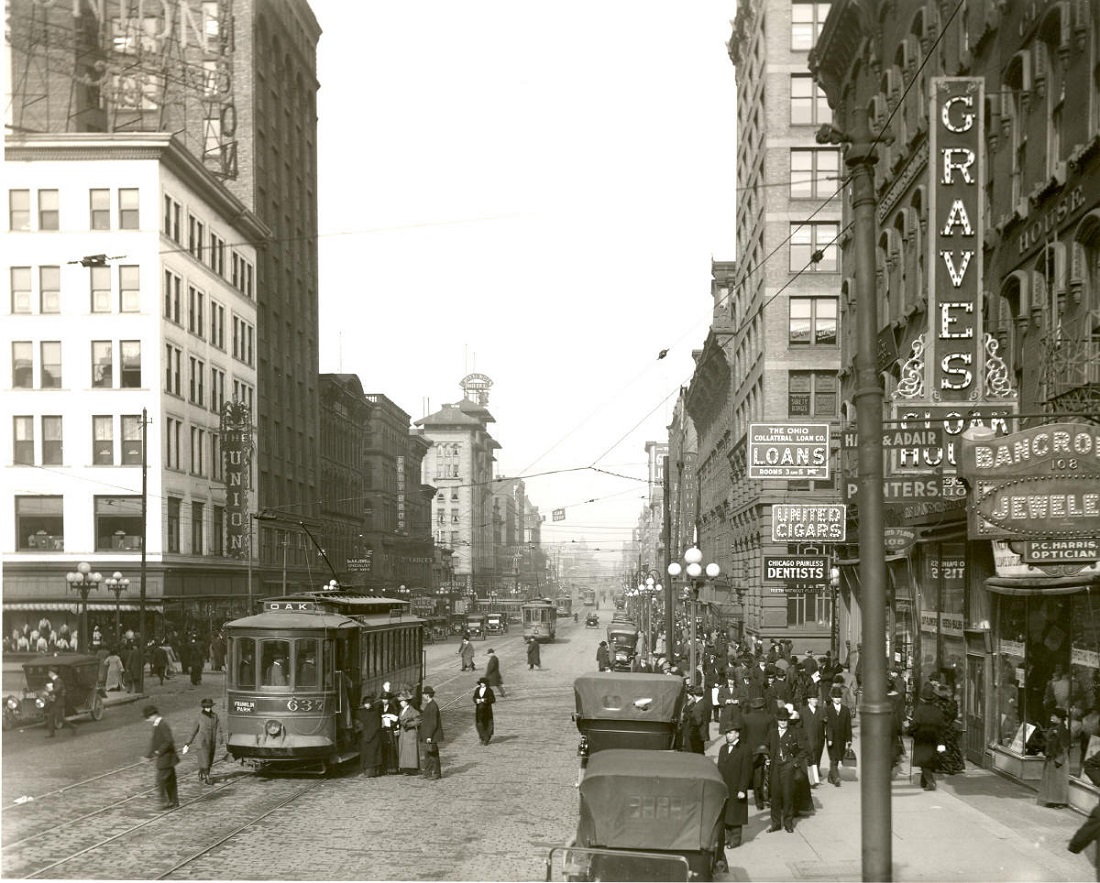
Up next is the intersection of Long and High, just south of the Atlas building (on the right). The Atlas Building still exists and is in the process of renovation. There are also a few buildings across the street that survived. Few others did.
Long and High in 1914.
Long and High in 2018.
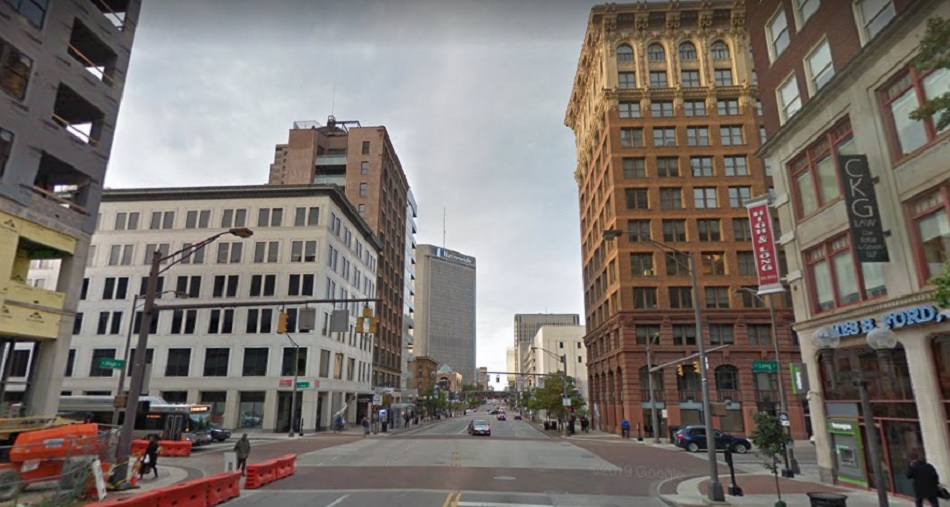
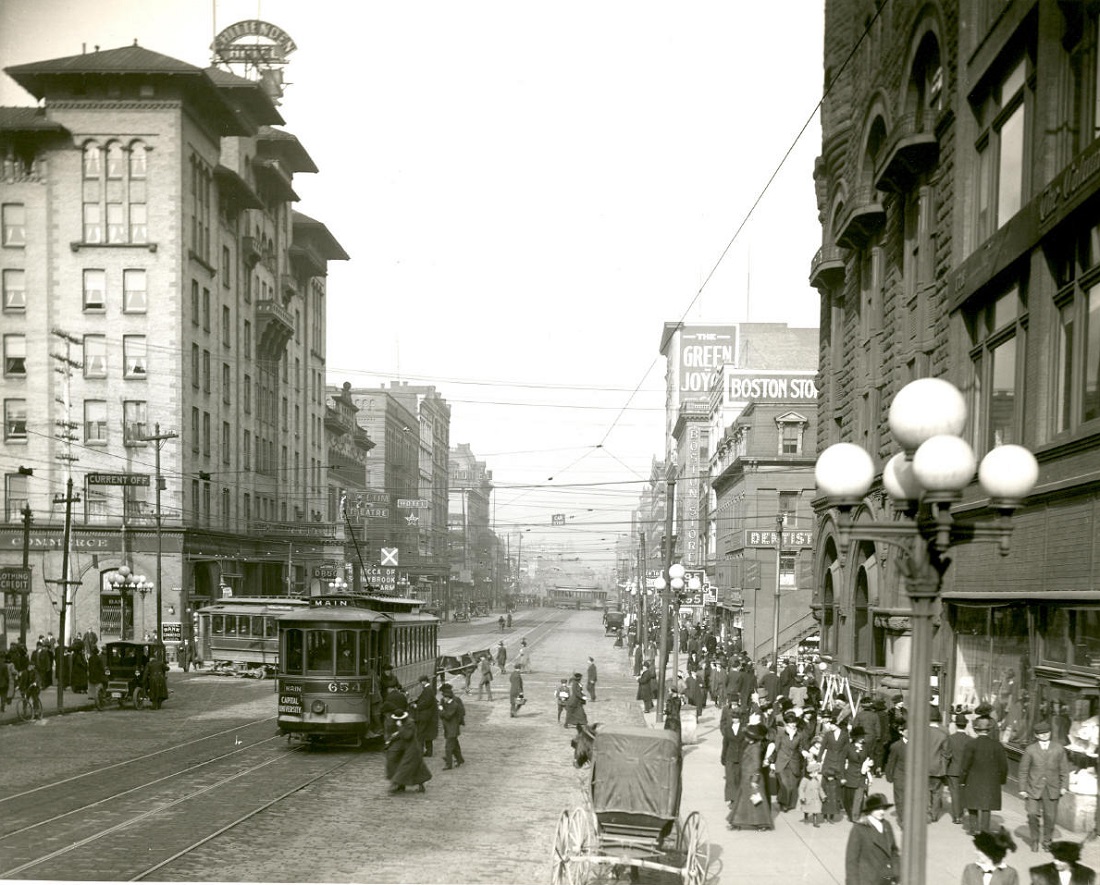
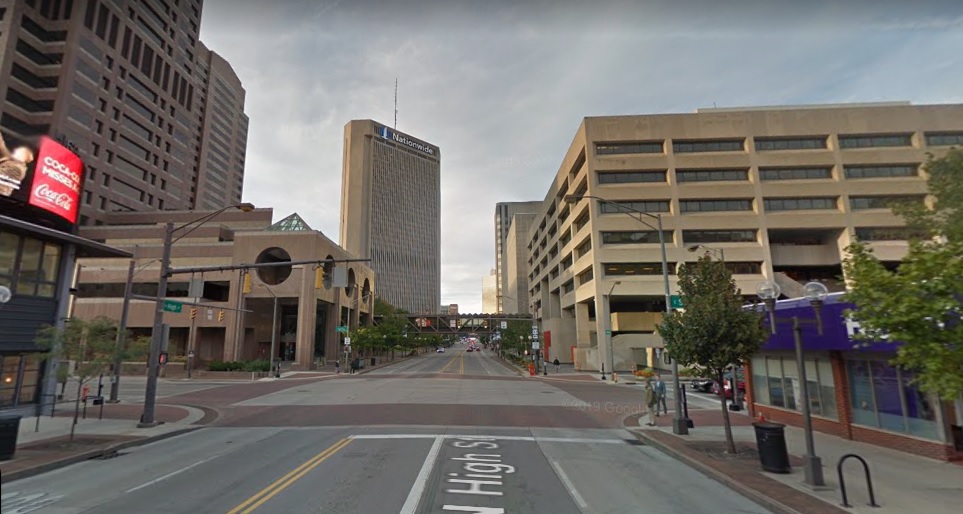
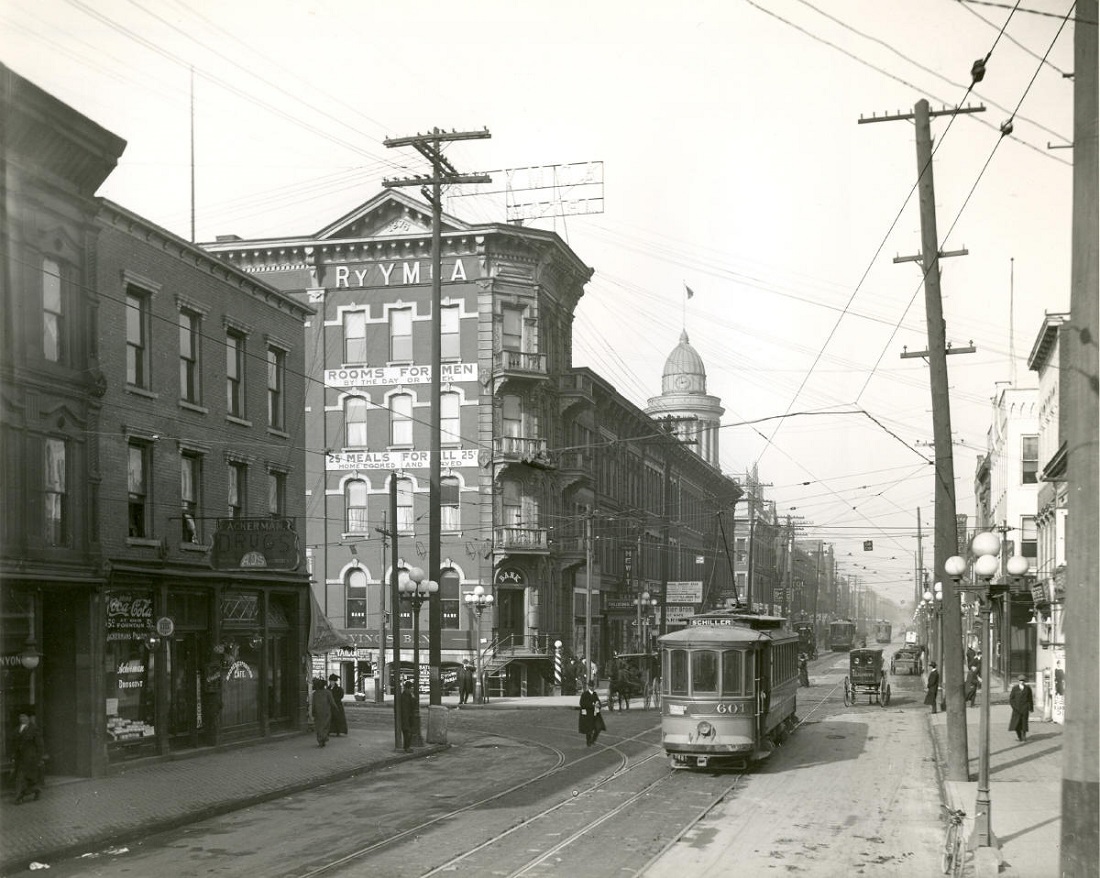
For the 2nd to last set, we have the intersection of Spring and High. The old Chittenden Hotel is the large building on the left with the Lyceum Theater behind it. Most of these buildings were torn down to make room for the Nationwide complex in the 1980s. There is literally not a single building from 1914 still standing in this area.
Spring Street and High in 1914.
Spring and High in 2018.
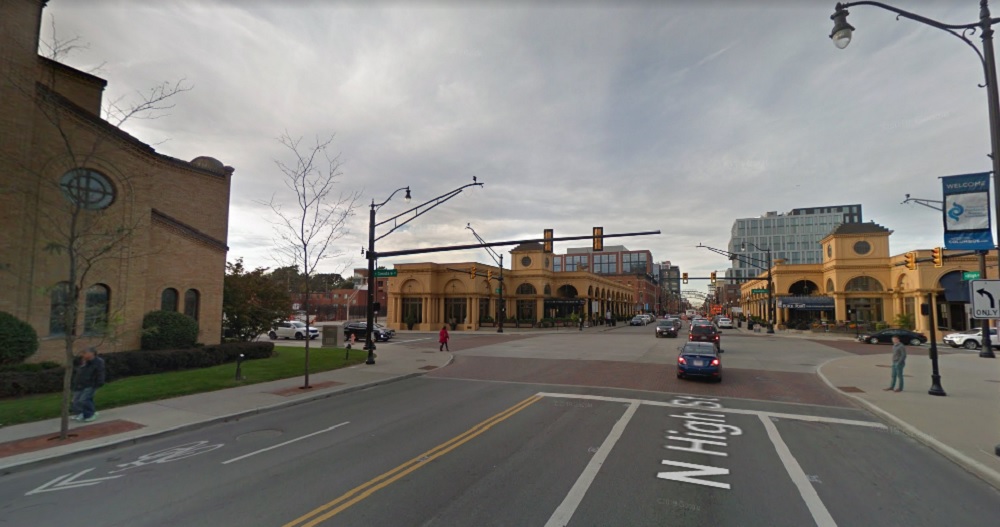
And finally, we have the intersection of Goodale Avenue and High Street. This before and after shows a drastic transformation. Many of the buildings in the photo, including the building with the beautiful domed rotunda, were demolished to clear the right of way for the construction of I-670. Others succumbed due to the Convention Center’s construction or the Greek Orthodox Church’s expansion in the 1980s. There is only one point of reference to know this is the same place. To me, this is the most tragic photo of all. Like so many cities, Columbus had incredible architecture in abundance, and the leaders in the middle part of the 20th century squandered it all away, leaving the current generation trying to rebuild a divided, empty shell of what once was. Much of it, however, can never be restored. Let it be a visible reminder that development has real consequences if not followed through wisely.
Rail in some form existed in Columbus from the 1850s through the mid-1970s. For generations, rail travel was the way to go. It was the connector of distances, the driver of local and state economies. On the local scale, it brought folks to and from their city’s downtown areas for shopping and employment, and the trolley, interurban and other rail systems were as prolific as the horse and buggy before them. So what happened? In this Why Columbus Doesn’t Have Rail Part 1, we will review all of the history of rail travel within the city.
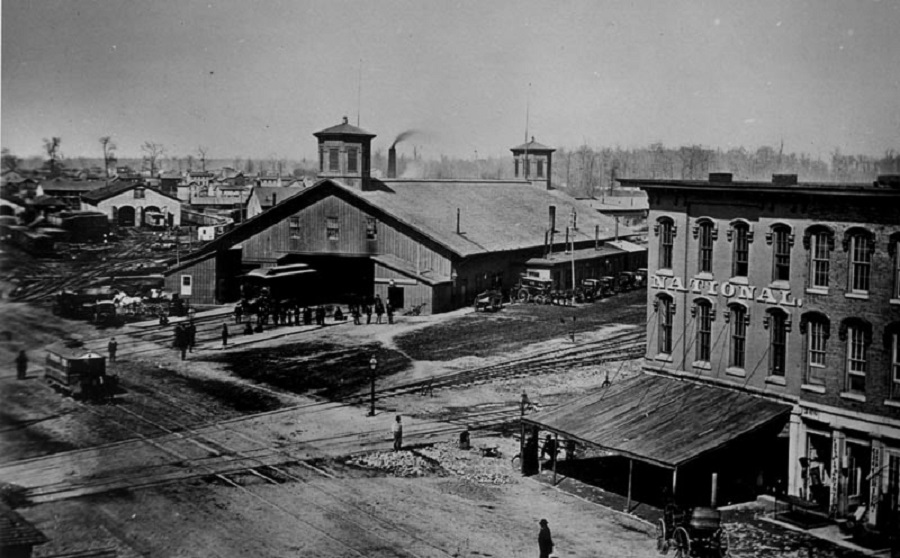
Most people today are aware of the Union Station that existed on High Street where the Convention Center is now, but there were actually 2 more depots that proceeded it. Columbus got it’s first real taste of rail travel in 1851, when the Columbus Union Depot opened, a year after the city’s first railroad, the Columbus & Xenia, entered the city. It was followed by the Cleveland, Columbus & Cincinnati Railroad in 1851. Both railroads wanted their depots to be as close to the downtown area as possible, as this was the center of the city’s population and commercial activity. At the time, the city was significantly smaller than it is now. Today, Chestnut and Naughten Streets are within the heart of Downtown, but in the early 1850s, there was almost no development north of these streets, so the two railroads collaborated and purchased a plot of land at the northeastern corner of the North High Street and Naughten intersection, about where the Hyatt Regency is today. This would be the location of their new terminal, the Columbus Union Depot.
The first Union Station that operated between 1851-1875.
This was the first depot in the city and resembled a barn, in some ways similar to the first North Market building that would go up nearby. It was built to handle 3 railroads but by the early 1870s was handling the traffic of 5, well exceeding capacity. Beyond the inadequate size, the depot’s trains dangerously and regularly blocked traffic on High Street, much to the anger of many residents. The push for a new depot began.
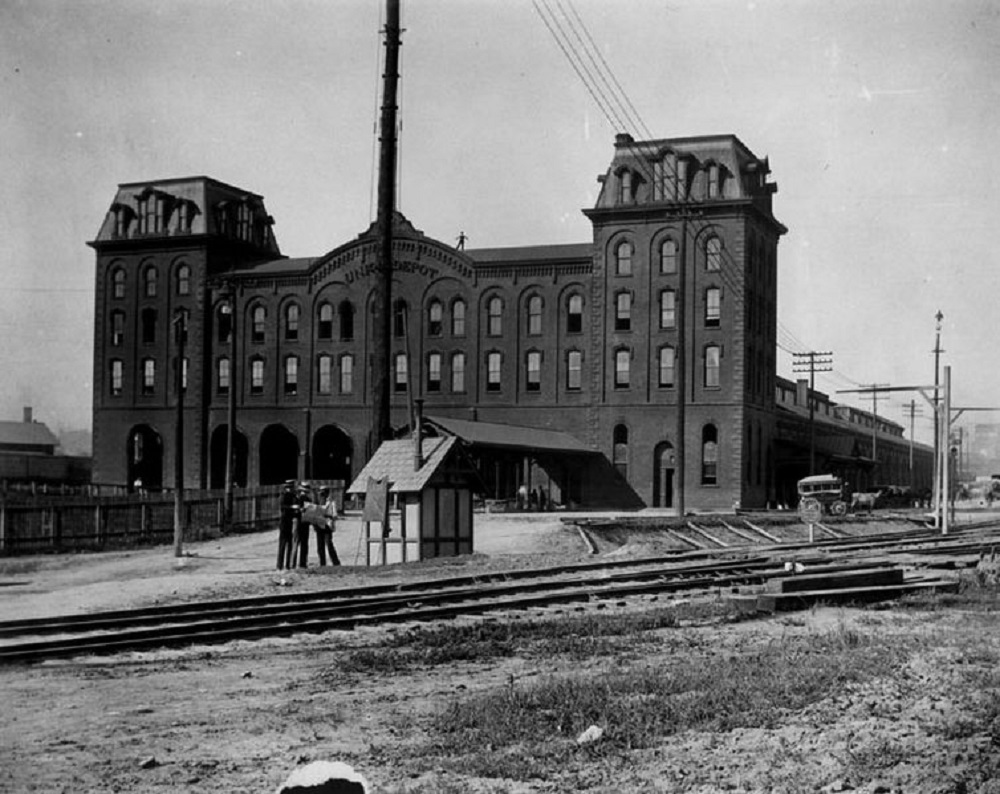
Plans were approved in 1871 for the new depot and it was completed and opened in February 1875, with the old depot torn down and many of the old tracks relocated/rerouted to the much larger depot, now located further east of the old depot location, just north of Naughten. Not only was it much larger, but much grander in design. No longer a giant, single story barn, it was instead a 3-story red brick structure and had many architectural features that the previous depot lacked. Tracks still crossed High, but a 160-ft tunnel underneath helped to relieve congestion. For years, this new setup solved many of the previous problems, but a steady increase in train traffic (there were over 120 daily trains by the early 1890s), as well as pedestrian and horse and buggy traffic getting too and from the depot began to cause major problems in the area once more. A new depot was once again needed.
Union Station 1875-1897.
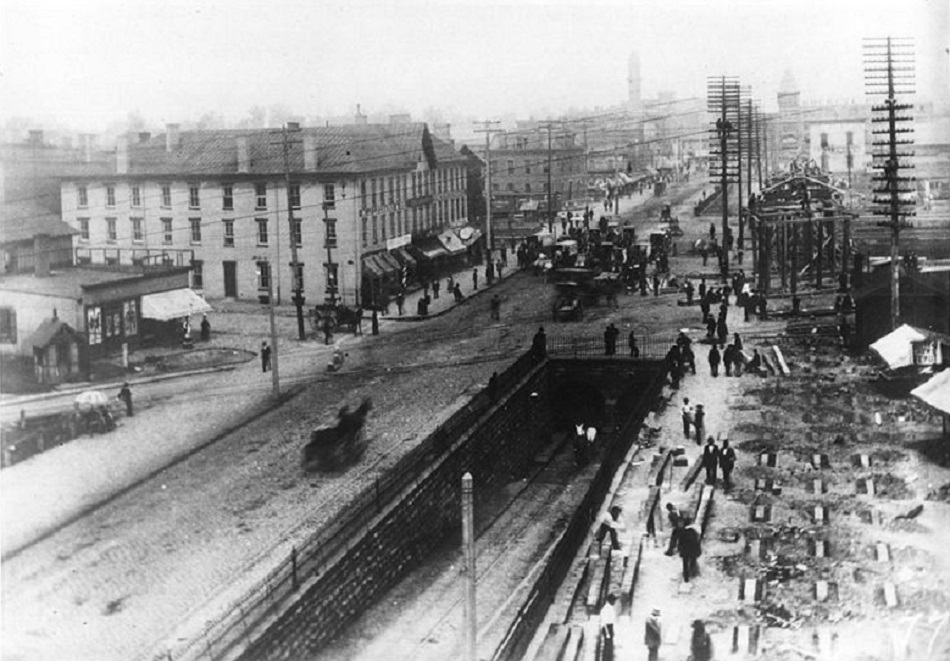
The High Street tunnel that connected the 2nd depot, around 1888.
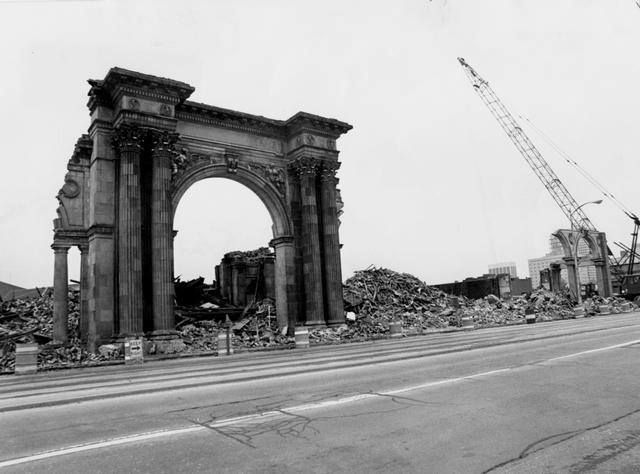
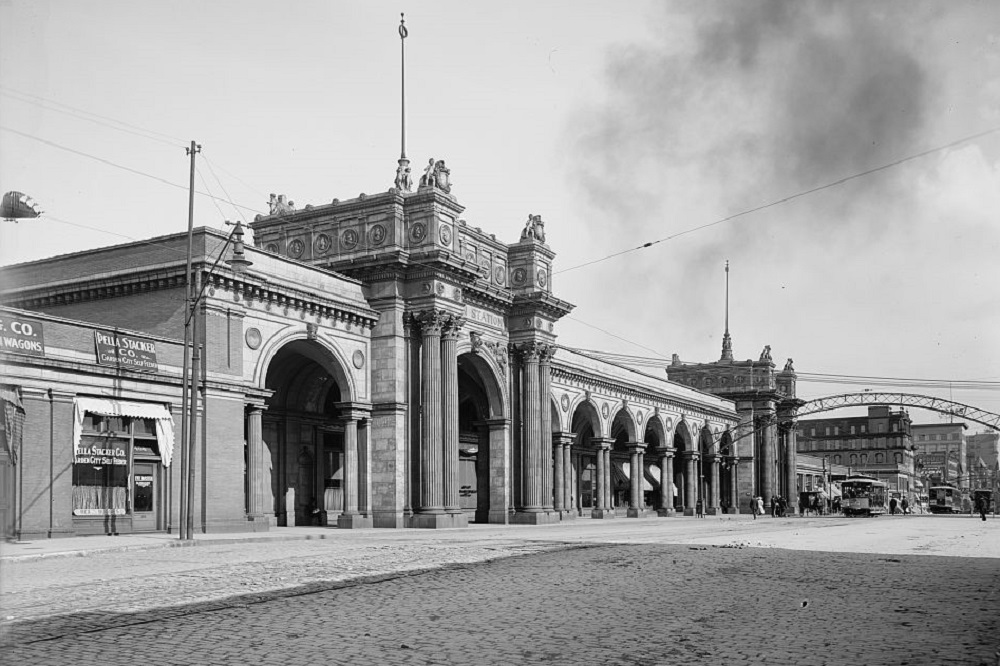
The third and most recognizable depot was completed in 1897: Union Station. It was, by far, the largest and most elaborately designed depot of the three, with 45-ft ceilings, a grand concourse and ornate plaster details. Much of the glamour was lost in a 1920′s remodeling, however, and falling numbers of daily trains gradually eroded maintenance levels. Union Station continued to serve passengers for nearly 50 more years, until the last passenger train passed through Union Station on April 28, 1977, ending over 125 years of passenger rail in the city. Demolition of Union Station had begun almost 7 months earlier, in an underhanded tactic to make way for a proposed convention center. The depot, particularly the arcade section along High Street, had been put on the National Register of Historic Places in 1974, and preservationists had won an injunction to stop demolition. However, a coalition led by Battelle rushed to demolish the building anyway, and by the time preservationists could act, most of it had already been lost. A single archway was all that remained, and today it sits on the northern corner of McPherson Commons park in the Arena District, a lonely testament to what was lost. The rest of the station was demolished by the fall of 1979. Ironically, the best evidence of how preservation attitudes have changed is just a bit further north with the I-670 retail cap. It is designed to resemble the Union Station arcade.
Union Station in 1910. It existed from 1897-1977.
Beyond heavy passenger rail, Columbus also had a streetcar system. The Columbus Street Railroad Company was formed in 1854, but the first streetcar did not come about until June 1863, when a horse-powered car arrived on High Street. By the 1890s, more than a dozen street rail companies were in the city and had almost 35 miles of tracks. Most of these were also horse-drawn until the early 1890s, when electrified lines proved far more efficient, making horse-drawn lines obsolete.
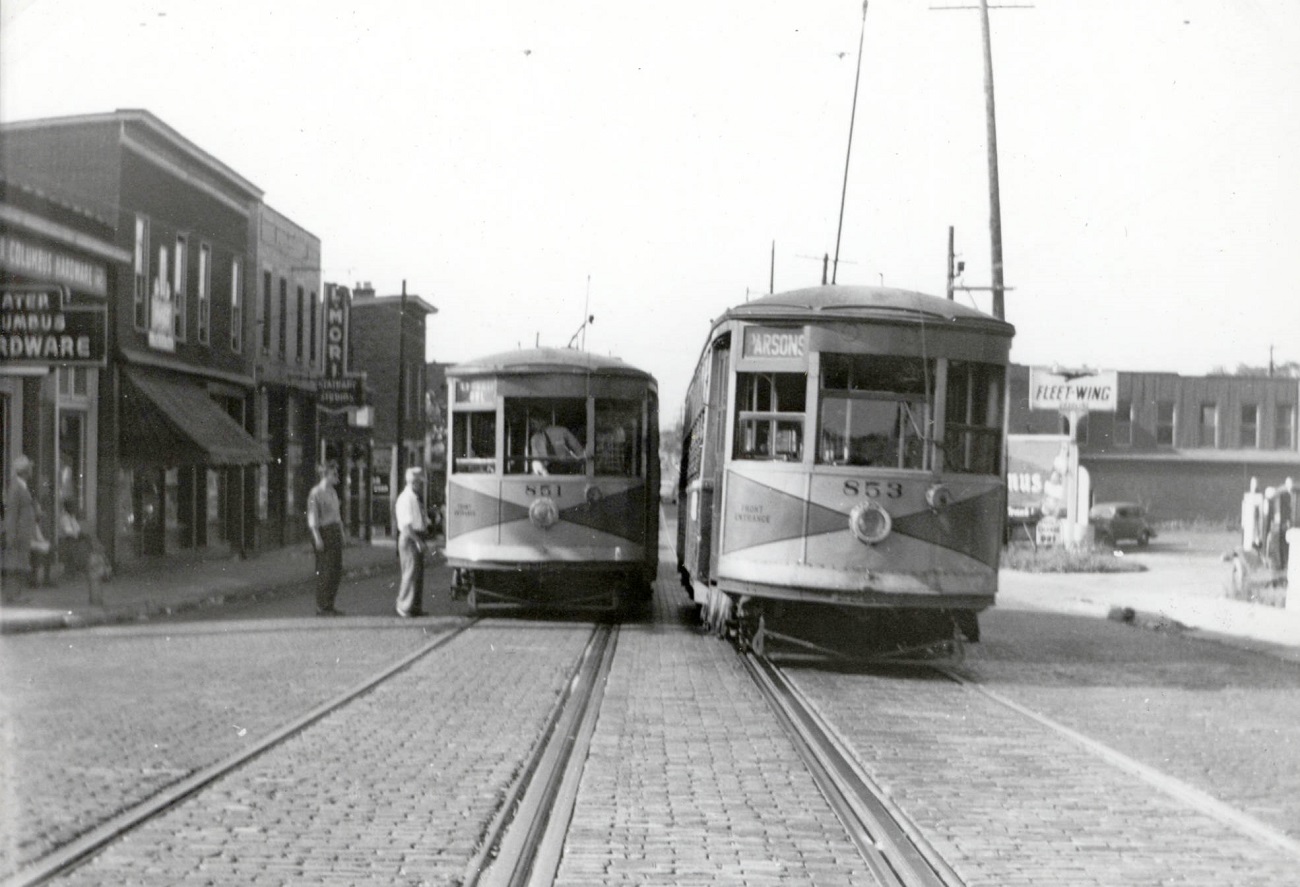
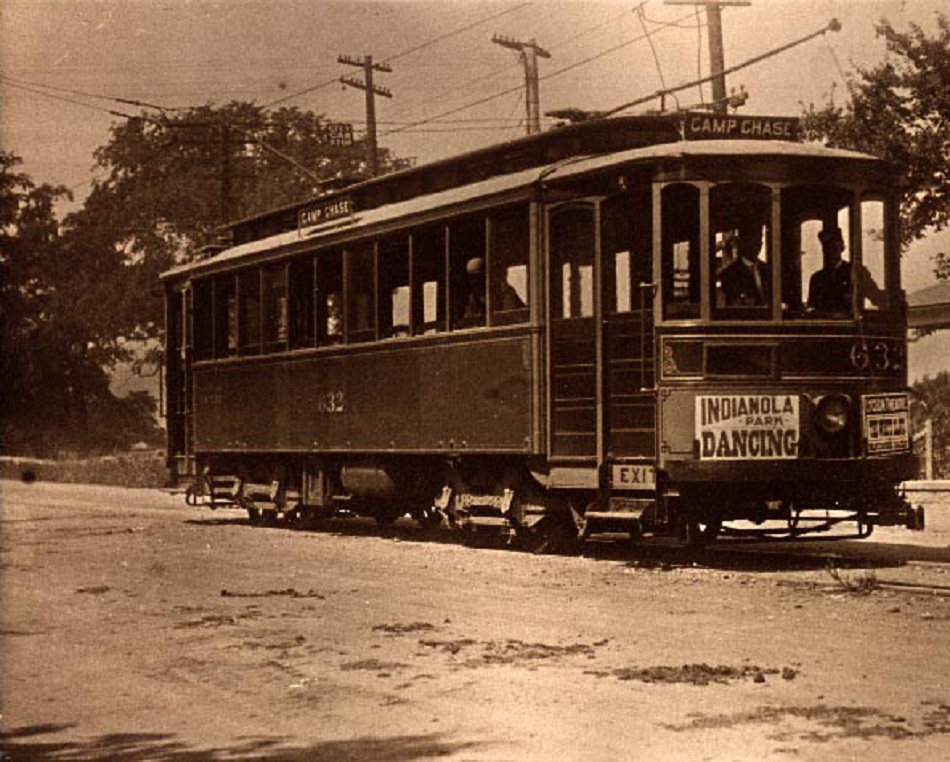
The Camp Chase streetcar.
Electric lines and passenger totals continued to grow over the next few decades and, by the mid 1910s, annual passenger tickets exceeded 65 million, equating to almost one trip per day for every man, woman and child living in Columbus at the time. By the 1920s, streetcar lines had spread to almost all of the urban core neighborhoods and inner ring suburbs, but passenger totals were already falling as the automobile increased in popularity. In the 1930s, an attempt was made to adapt to this changing transit environment and the fixed-track streetcars began to be replaced with trolley buses, with the last streetcar decommissioned in 1948. They too, however, only lasted until 1965, when they were replaced with the standard diesel bus.
In Part 2, I’ll examine what happened and why rail has, to this date, not returned to the city.