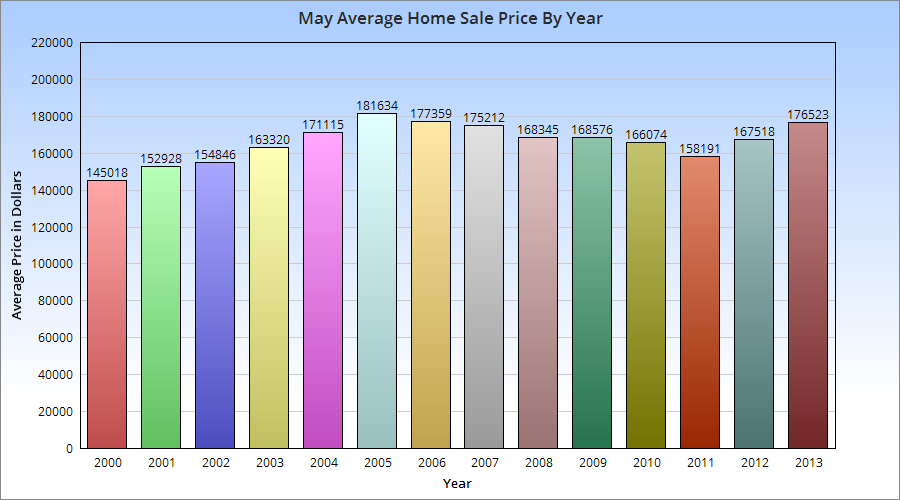
I have been wanting to do these maps for awhile now, as there have been several searches on the site for them and they weren’t available. The maps look at Columbus murders by zip code 2008-2012, highlighting which zip codes have seen the most murders by year and across the period as a whole.
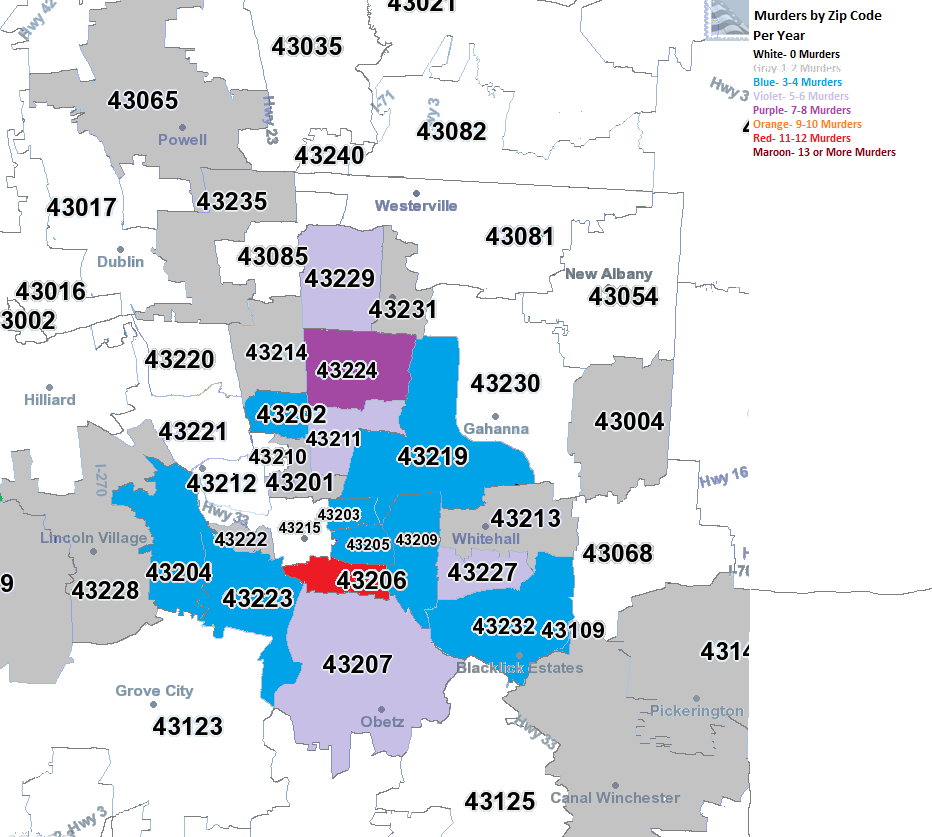
2008
In 2008, almost all murders were contained within the I-270 boundaries. The East and South Sides were the worst areas.
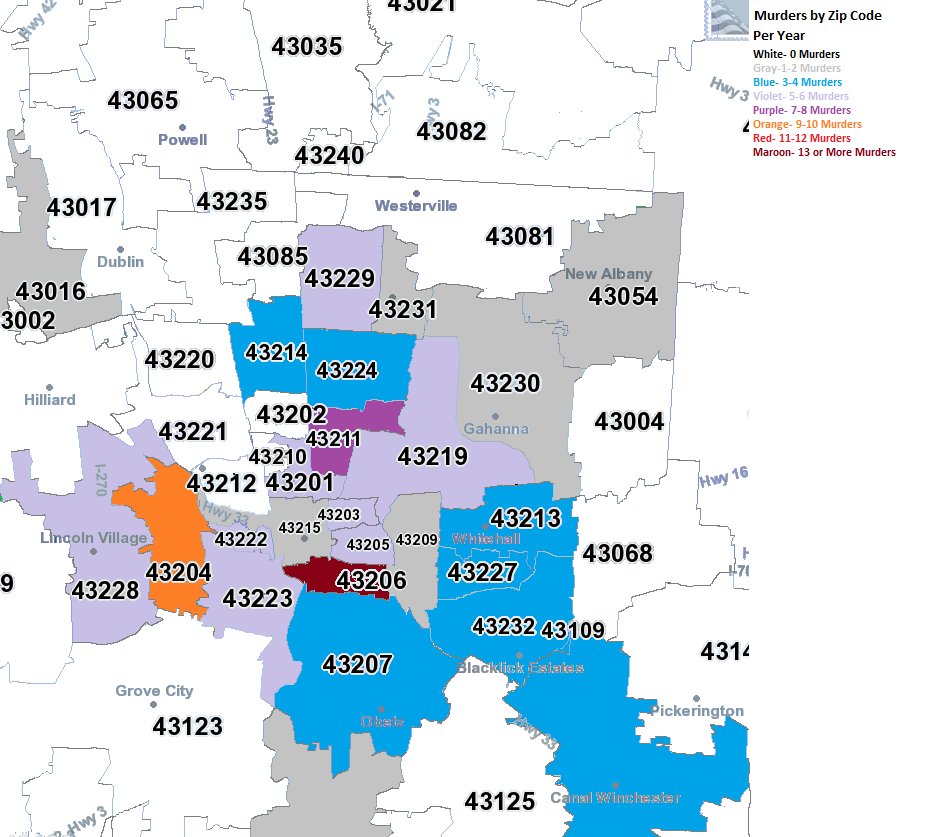
2009
In 2009, there began to be a bit of diffusion on where murder was taking place. While parts of the urban core remained the worst areas, suburban areas also saw the occasional murder.
2010
The diffusion continued in 2010.
2011
And in 2011.
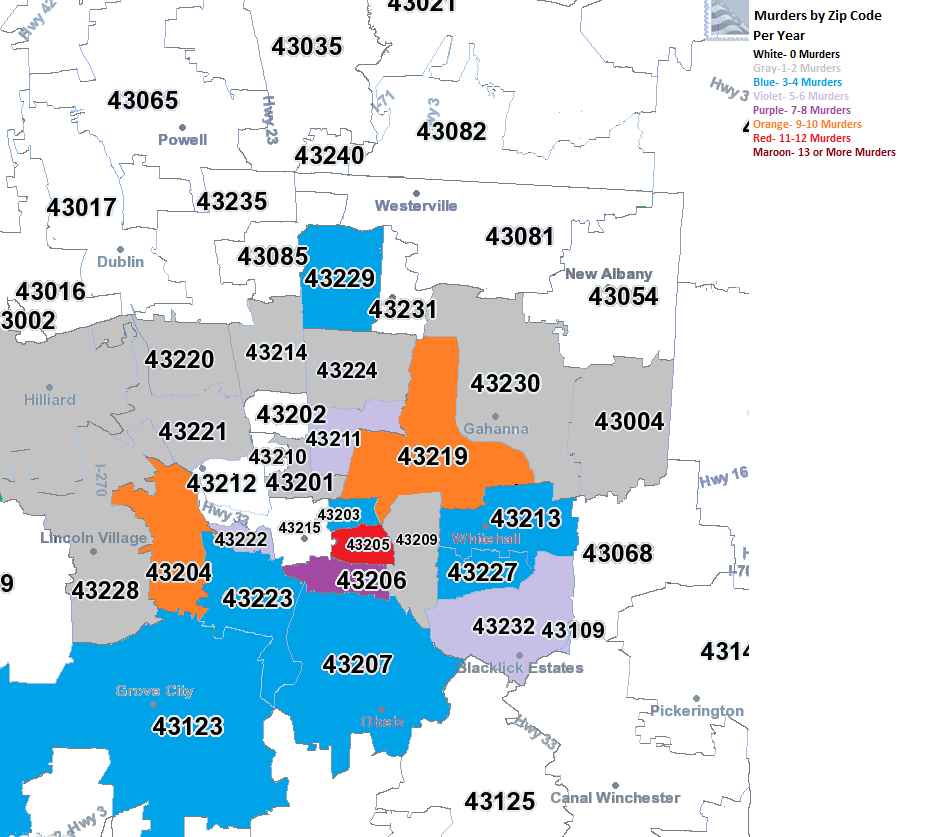
2012
2012 was the most diffuse of all the years, with no heavily concentrated areas, even in the urban core as much. Meanwhile, most of the suburban zip codes within Franklin County saw at least 1 murder.
The question is, what do we make of this? This is only a 5-year data set, but it may be supporting evidence for current urban trends. The first trend being that the urban core is rapidly gentrifying in many areas. The second being that poverty is, through economic and development trends, is spreading further out from the core. Concentrated poverty and crime go hand in hand, so while the suburbs may see a bit of increase in crime, the urban core is starting to see less. Something to watch over time to see if such trends continue.
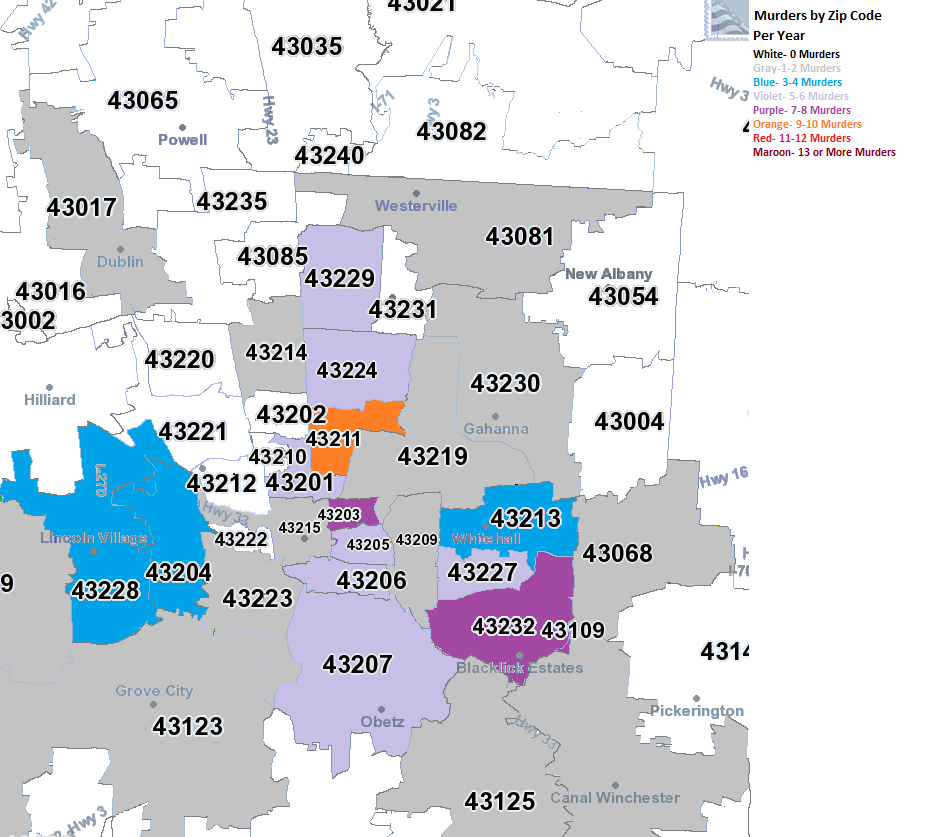
2008-2012
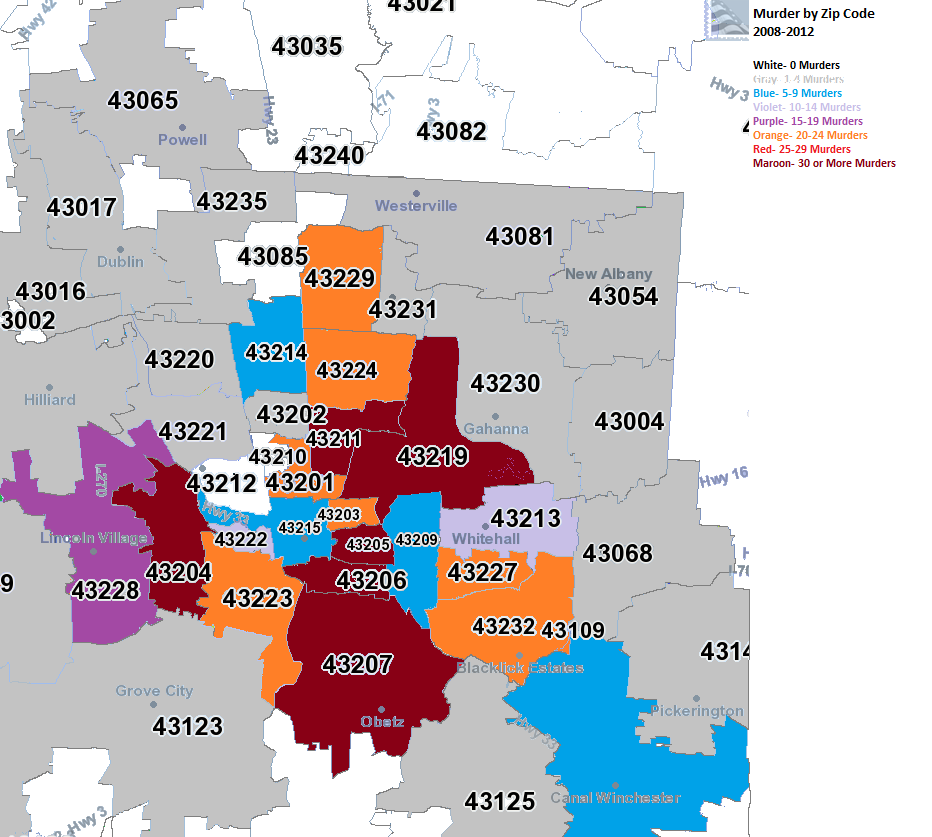
What strikes me about the 5-year map is that Grandview/Upper Arlington have been entirely murder free while every zip around them have had at least one. Also, Downtown is also relatively murder free, as is Bexley and the Clintonville areas.
Of course, zip codes include large areas. What are the neighborhoods that are actually seeing murders and which ones are not? To find out, we’ll have to go down to the tract level. Over the next few days, I’ll post those maps.
More local crime statistics back to 1985 can be found here: Columbus Crime Statistics
The https://www.columbus.gov/police/ site provides annual reports, crime descriptions and other local department information.