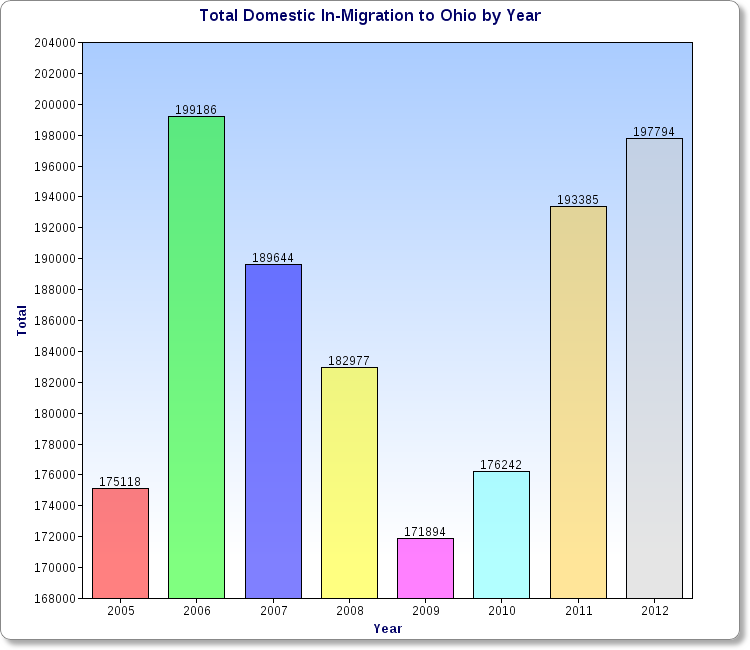
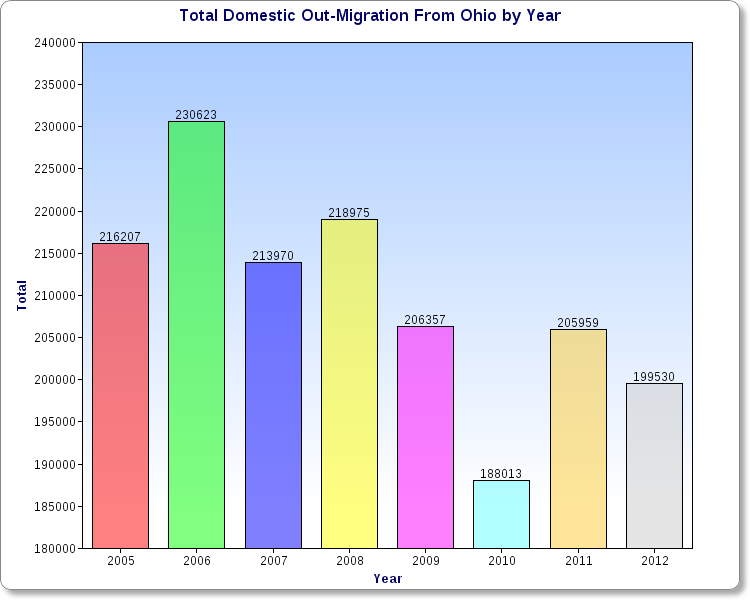
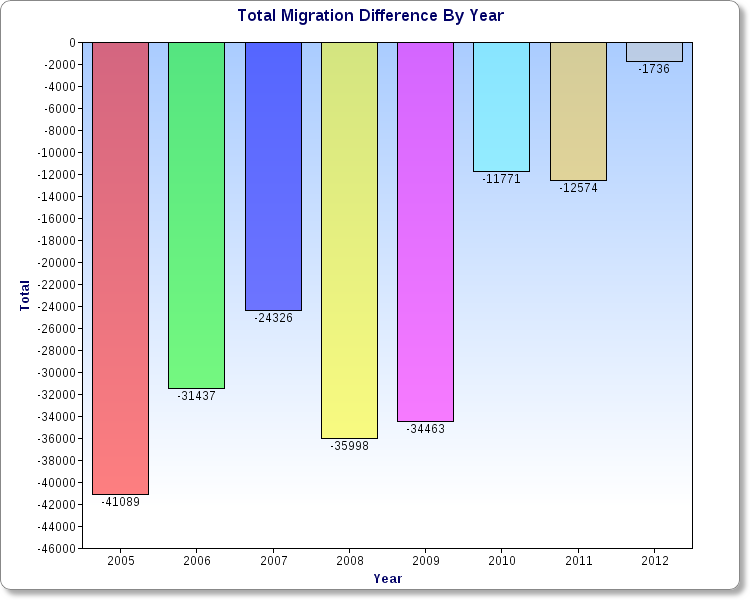
Ohio has been growing fairly slowly for several decades now. In fact, if it was not for Columbus’ population growth and international migration, the state would’ve been losing population in recent years. But is the picture really that bad? Are things changing? I decided to find out. The first chart above shows the total population that moved to Ohio from all other 49 states plus Puerto Rico and DC by year. The drop during the recession is pretty obvious, as mobility greatly decreased during that time. 2012 had the 2nd highest total of the period, only slightly behind 2006. What the out-migration chart shows is that the total is gradually going down, meaning fewer people, on average, are leaving Ohio each year. So what is the overall difference of in vs. out migration to Ohio? As the chart shows, the trend has been improving over time, and 2012 barely registered a loss at all. Will the state begin seeing positive domestic in-migration in the very near future? Based on this chart, the answer seems to be yes. A lot can still happen, but it does appear that Ohio is finally shaking off its long-term population issues.
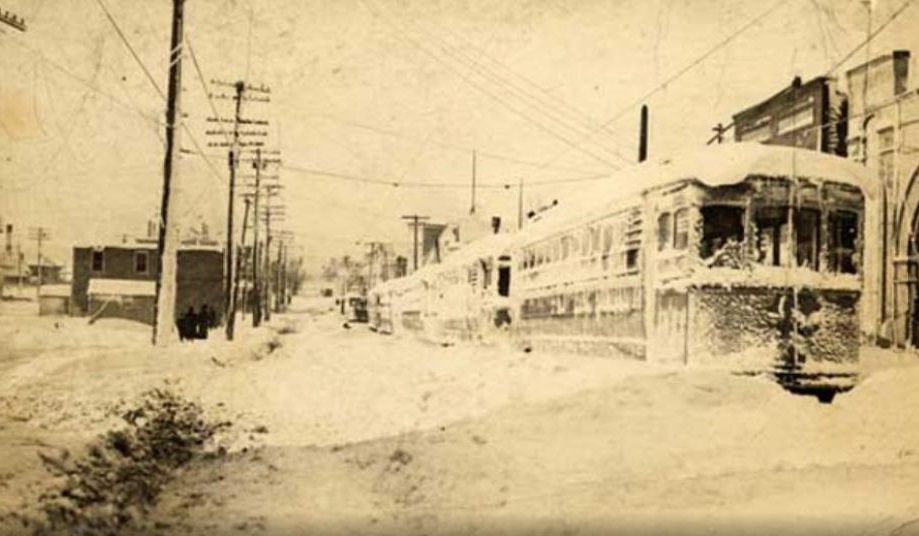
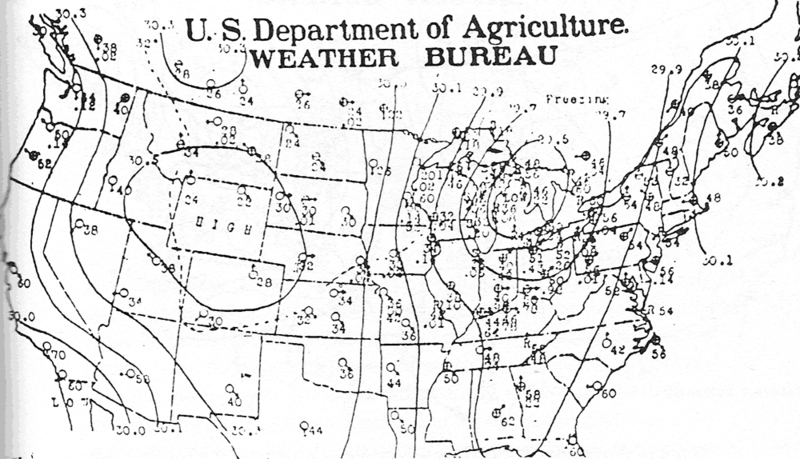
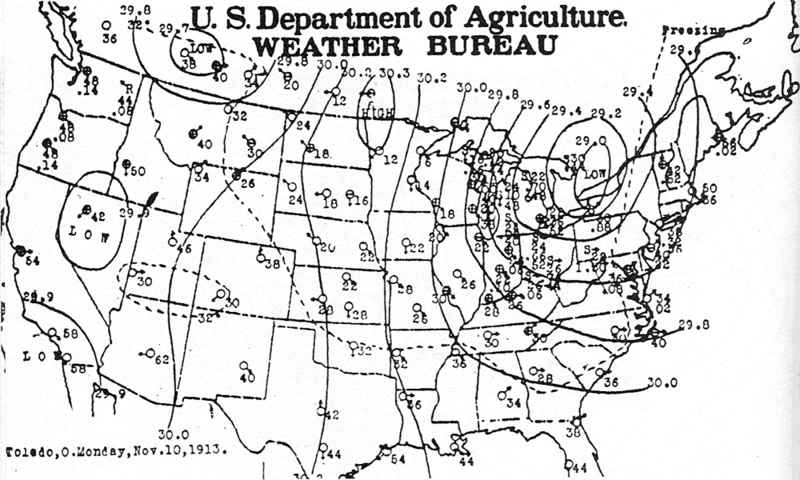
I haven’t done a weather-specific post in a while, and this week marks the 100th anniversary of the infamous Great Lakes Hurricane.. The storm lashed Ohio and other Great Lakes states for 3 days from November 9th-11th, 1913, causing widespread damage and loss of life. More than 250 died, mostly from drowning as 19 ships sank on the Great Lakes.
The storm began on the 9th as a pair of low-pressure systems collided over Michigan and the southern Lakes. Temperatures in the 50s and 60s dropped throughout the day on the 8th as the combined storm pulled a cold front across Ohio. A tight pressure gradient caused strong winds and rain turned to heavy snow. While the brunt of the storm hit the Cleveland area and adjacent lakeshore communities, the storm affected 3/4ths of Ohio, including Columbus.
A heavy rain began in Columbus on the 7th as the cold front moved through. Temperatures dropped from the mid-50s early on the 8th to the mid-30s by evening. On the 9th as temperatures dropped to and below freezing, snow began to fall, becoming occasionally heavy throughout the day. Winds of 40mph in the Columbus area combined with the snow to create blizzard conditions throughout the 9th and early into the 10th, though not nearly as severe as they were on Lake Erie. Snowfall totals were 10″-20″ across all of Eastern Ohio, and the Cleveland area had up to 2 feet. Columbus, with its 7.5″ total, got off lucky, while Cincinnati had just 1 inch.
The storm remains as the most severe early winter storm in Ohio history.
It should be kept in mind that snow-measuring is an inexact science, and that was especially true in the early 20th Century. By all news accounts at the time, snow drifts were 3′-4′ across most of eastern Ohio, and reports of a foot or more were common for areas east of present-day Rt. 23. Most stations, however, did not report such totals. This is most likely because very strong winds blew the snow around, making it very difficult to measure accurately. For example, at least 12″ with 4′ drifts were reported at Newark, just east of Columbus, yet official records don’t necessarily account for those reports.
This link is continuously being updated because there are thousands and thousands of historic buildings in the Columbus area. I am focusing on just those within I-270. Information includes the address or name of the building, the year or approximate time built, height in stories, original and current uses, as well as whether or not it is on the National Register of Historic Buildings. If so, I included the year that it was added to the Register.
The buildings on the map go all the way back to 1804 and run through 1925.
Because this map is a work in progress, the link will be permanent under the City Resources links on the home page. Keep checking back to see more places being added over time.
The latest numbers for the Columbus housing market from Columbus Realtors.
LSD=Local school district CSD=City school district
Top 15 Most Expensive Locations by Median Sales Price in October 2013 1. New Albany: $445,900 2. Upper Arlington CSD: $358,000 3. Downtown: $330,000 4. Powell: $305,000 5. Dublin: $302,125 6. Jefferson LSD: $292,500 7. Olentangy LSD: $288,500 8. Granville CSD: $272,000 9. New Albany Plain LSD: $262,500 10. Worthington: $249,900 11. Buckeye Valley LSD: $246,250 12. Big Walnut LSD: $238,500 13. Beechwold/Clintonville: $230,000 14. Bexley: $225,875 15. German Village: $217,500
Top 15 Least Expensive Locations by Median Sales Price in October 2013 1. Whitehall: $42,500 2. Lancaster CSD: $75,250 3. Hamilton LSD: $83,450 4. Columbus CSD: $84,200 5. Newark CSD: $87,450 6. Groveport Madison LSD: $90,150 7. London CSD: $94,500 8. South-Western CSD: $95,000 9. Columbus: $104,500 10. Circleville CSD: $110,250 11. Blacklick: $134,251 12. Obetz: $134,950 13. Canal Winchester CSD: $135,000 14. Grove City: $135,000 15. Reynoldsburg CSD: $136,200
Overall Metro Median Sales Price in October 2013: $149,302 Median Sales Price Change October 2012-October 2013: -$3,183
Top 15 Locations with the Highest Median Sales Price % Growth Between October 2012-October 2013 1. Hamilton LSD: +85.4% 2. Jefferson LSD: +69.8% 3. Downtown: +63.8% 4. Reynoldsburg CSD: +54.4% 5. Obetz: +51.8% 6. Jonathan Alder LSD: +50.4% 7. Sunbury: +36.5% 8. Beechwold/Clintonville: +28.6% 9. Westerville CSD: +20.2% 10. Minerva Park: +19.4% 11. Marysville CSD: +19.4% 12. Lithopolis: +19.0% 13. Northridge LSD: +17.4% 14. Circleville CSD: +16.7% 15. Granville CSD: +15.6%
Top 15 Locations with the Lowest Median Sales Price % Growth Between October 2012-October 2013 1. German Village: -16.3% 2. Lancaster CSD: -16.3% 4. Buckeye Valley LSD: -14.9% 5. New Albany Plain LSD: -14.6% 6. Canal Winchester CSD: -14.6% 7. Grandview Heights: -14.2% 8. Hilliard: -12.8% 9. South-Western CSD: -11.4% 10. London CSD: -11.3% 11. Dublin CSD: -10.8% 12. Dublin: -10.3% 13. Whitehall: -7.6% 14. Gahanna Jefferson CSD: -5.6% 15. Johnstown Monroe LSD: -3.7%
Overall Metro Median Price % Change October 2012-October 2013: -2.1%
Top 10 Locations with the Most New Listings in October 2013 1. Columbus: 1,107 2. Columbus CSD: 691 3. Westerville CSD: 177 4. South-Western CSD: 169 5. Hilliard CSD: 158 6. Olentangy LSD: 157 7. Dublin CSD: 123 8. Groveport Madison LSD: 91 9. Worthington CSD: 79 10. Dublin: 73
Top 10 Locations with the Fewest New Listings in October 2013 1. Valleyview: 0 2. Lithopolis: 0 3. Minerva Park: 2 4. Jefferson LSD: 5 5. Obetz: 5 6. Sunbury: 5 7. Northridge LSD: 9 8. Jonathan Alder LSD: 9 9. German Village: 9 10. Grandview Heights: 10
Overall Metro New Listings in October 2013: 2,693 New Listings % Change October 2012-October 2013: +5.9%
Top 10 Fastest-Selling Locations by # of Days Homes Remain on the Market Before Sale in October 2013 1. Johnstown Monroe LSD: 30 2. Powell: 31 3. Buckeye Valley LSD: 32 4. Grandview Heights: 39 5. Minerva Park: 42 6. Beechwold/Clintonville: 45 7. Northridge LSD: 45 8. Olentangy LSD: 46 9. Westerville: 46 10. Jonathan Alder LSD: 47
Top 10 Slowest-Selling Locations by # of Days Homes Remain on the Market Before Sale in March 2013 1. Circleville CSD: 118 2. London CSD: 107 3. Lancaster CSD: 106 4. Obetz: 105 5. Hamilton LSD: 96 6. New Albany CSD: 91 7. Granville CSD: 84 8. Jefferson LSD: 82 9. Big Walnut LSD: 81 10. Hilliard: 78 11. Reynoldsburg: CSD: 78
Overall Metro Average # of Days on Market Before Sale: 74.7
Top 10 Locations with the Best Change in # of Days on the Market Before Sale October 2012-October 2013 1. Lithopolis: +522.2% 2. Minerva Park: -77.25 3. Johnstown Monroe LSD: -74.6% 4. Buckeye Valley LSD: -71.7% 5. Jonathan Alder LSD: -69.1% 6. Grandview Heights: -64.2% 7. Powell: -62.7% 8. German Village: -61.2% 9. Northridge LSD: -54.5% 10. Pickerington LSD: -47.0%
Top 10 Locations with the Worst Change in the # of Days on the Market Before Sale October 2012-October 2013 1. Hamilton LSD: +190.9% 2. Obetz: +150.0% 3. Lancaster CSD: +86.0% 4. Sunbury: +50.0% 5. Circleville CSD: +45.7% 6. London CSD: +27.4% 7. New Albany: +14.6% 8. Worthington: +13.7% 9. Granville CSD: +9.1% 10. New Albany CSD: +8.3%
Overall Metro # of Days on Market Before Sale % Change October 2012-October 2013: -24.9%