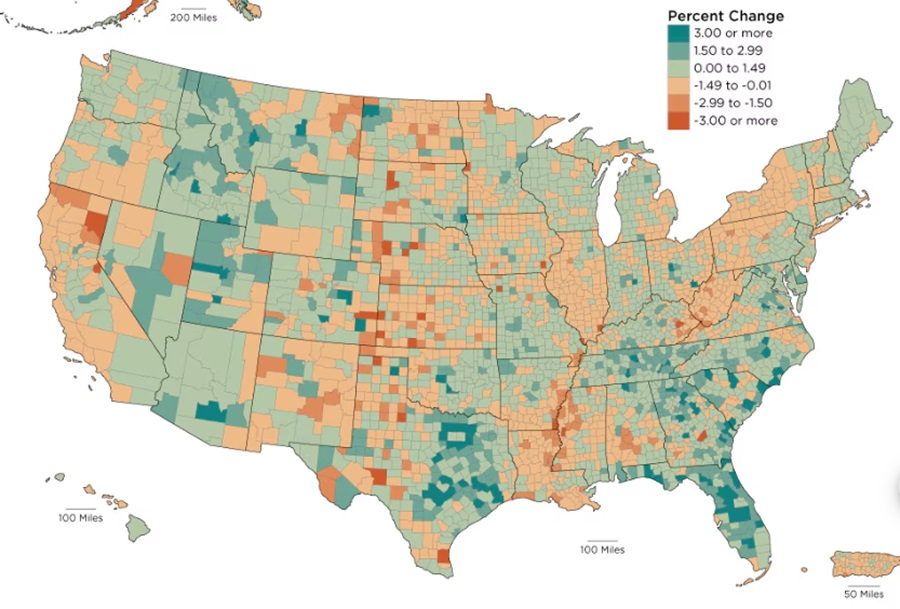
National county map for 2022-2023 population change.
I haven’t done an annual population estimates post since before the 2020 Census. This is because the pandemic- and political actions- screwed up counting quite a bit, and I haven’t felt confident in posting them. The 2023 county and metro population estimates have just been released., and since 3 years have gone by since the census, perhaps some of the kinks have been worked out. That said, the news isn’t all that great for Ohio and Columbus.
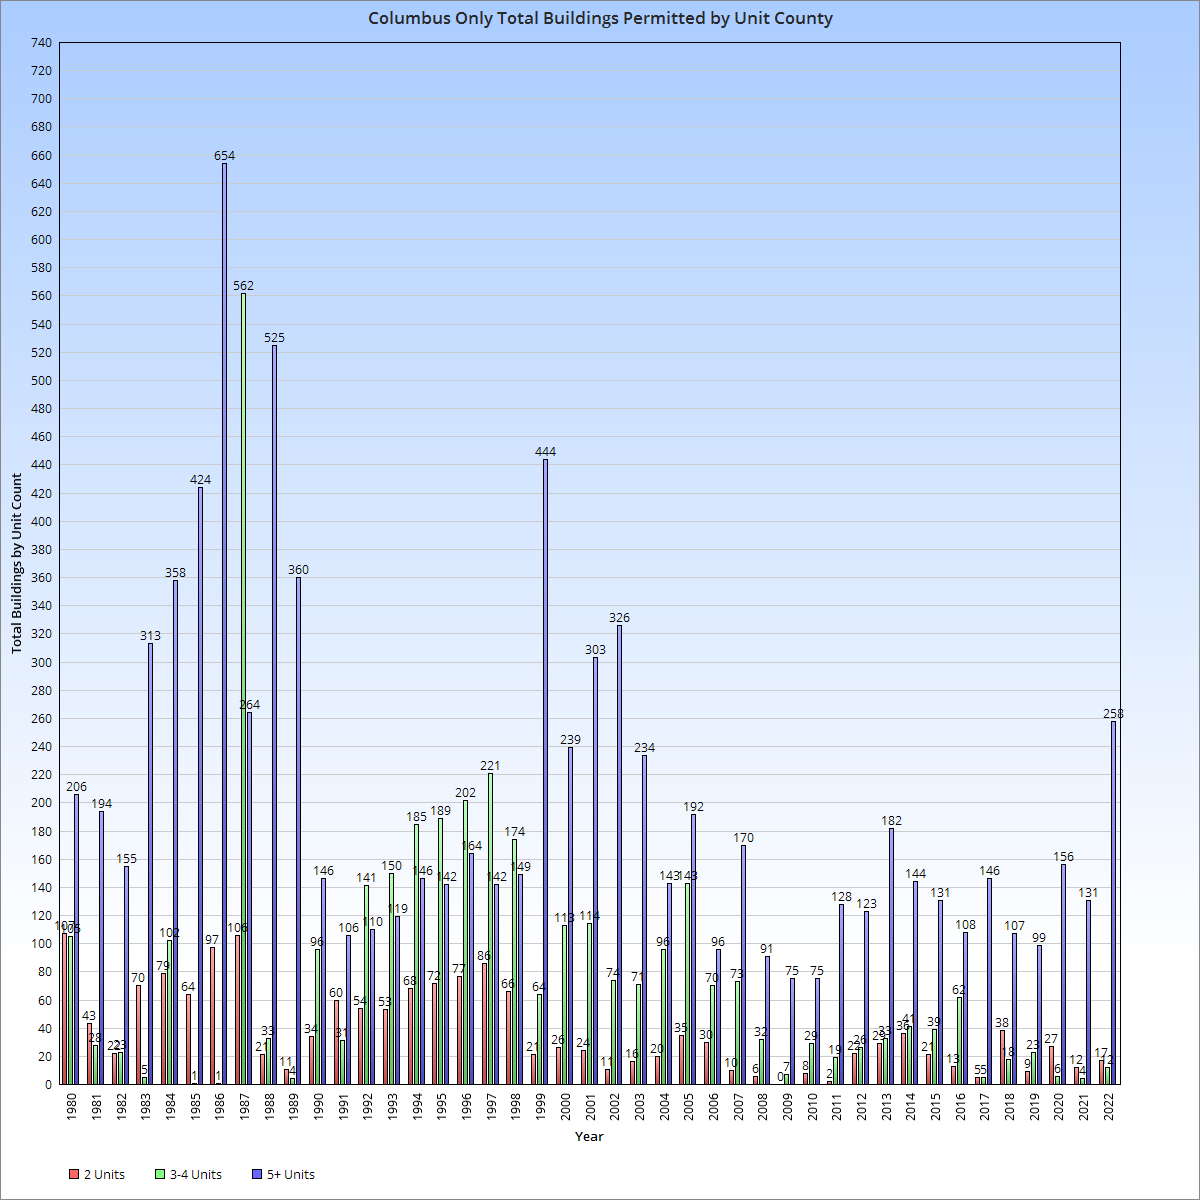
2020-2023 County Population Change
Prior to 2020, Franklin County was the fastest-growing county in the state by total growth. Since 2020, it’s fallen to 10th. While that may not seem that bad, only 30 of Ohio’s 88 counties have even seen growth since 2020. On the bright side, Franklin was the only major urban county in the state to see any growth at all. The majority of the 30 counties that saw growth in the state were metro suburban counties, including 8 of the 9 suburban counties within the Columbus Metro Area. Lingering effects of the pandemic are at least partially responsible for this shift, as some people sought to leave highly-populated areas, but wanted to otherwise remain close to core cities.
Another factor is likely the ongoing housing shortage. Housing just isn’t getting built in Franklin County like it was before, which is continuing to cause price increases, making the area less affordable than it used to be.
Additionally, extreme state politics may be driving some people away- or stopping them from moving locally altogether.
Still, the news isn’t all bad. The total Columbus metro population growth is gradually improving. From 2020-2021, the metro change was +7,986, 2021-2022 it was +14,560, and from 2022-2023, it was +18,205. Still a far cry from the pre-pandemic period when annual totals were 25K-30K. Hopefully, the upward trend continues through the rest of the decade.
Now that we know that overall population change, let’s take a closer look at the specific components of change since 2020.
Top 10 Counties by Natural Change 2020-2023
1. Franklin: +18,738
2. Hamilton: +4,233
3. Delaware: +2,072
4. Holmes: +1,309
5. Union: +662
6. Butler: +652
7. Warren: +650
8. Mercer: +543
9. Putnam: +86
10. Shelby: +67
Incidentally, only these 10 counties saw positive net natural change 2020-2023. That’s a terrible statistic for Ohio’s counties. Columbus’ 3 counties in the top 10 provided more natural change than all other 85 counties combined.
Top 10 Counties by Domestic Change 2020-2023
1. Delaware: +13,998
2. Warren: +7,424
3. Union: +6,011
4. Lorain: +5,969
5. Fairfield: +5,932
6. Licking: +4,592
7. Clermont: +3,117
8. Pickaway: +2,783
9. Miami: +2,433
10. Medina: +2,018
Again, Columbus metro counties- aside from Franklin- do relatively well here, with half of the top 10.
Top 10 Counties by International Migration Change 2020-2023
1. Franklin: +20,391
2. Cuyahoga: +8,557
3. Hamilton: +7,037
4. Butler: +3,551
5. Montgomery: +2,885
6. Summit: +2,593
7. Warren: +1,821
8. Delaware: +1,557
9. Lucas: +1,237
10. Greene: +839
Franklin again leads the pack and is generally doing better annually this decade than before the pandemic, the lone bright spot in the numbers.
Finally, here were the overall metro changes, both for 2022-2023 and 2020-2023.
2023 Total Metro Area Population
1. Cincinnati: 2,271,479
2. Columbus: 2,180,271
3. Cleveland: 2,158,932
4. Dayton: 814,363
5. Akron: 698,398
6. Toledo: 600,141
7. Youngstown: 425,969
8. Canton: 399,474
Columbus continues to leave Cleveland behind and close the gap with Cincinnati.
2022-2023 Metro Area Population Change
1. Columbus: +18,205
2. Cincinnati: +12,854
3. Dayton: +1,649
4. Akron: +887
5. Canton: +3
6. Toledo: -378
7. Youngstown: -679
8. Cleveland: -1,769
2020-2023 Metro Area Population Change
1. Columbus: +41,330
2. Cincinnati: +21,698
3. Dayton: +313
4. Canton: -2,106
5. Akron: -3,827
6. Youngstown: -4,707
7. Toledo: -6,100
8. Cleveland: -26,795