The US Census recently released demographic information for census tracts for 2015. Here are some quick maps for Franklin County for median household income.
First, median household income for both 2010 and 2015.
And the % change between 2010-2015.
As can be seen, a lot of the greatest improvements over the 5-year period were around Downtown, the Near East Side, North High, South High and around some of the higher-income suburbs like Upper Arlington and the New Albany area.
I’m not going to get into any debate on the candidates themselves or what I personally thought/think of them. That’s not the point of this post, and frankly, there’s already plenty of opinions all over the internet on this. This post is about the 2016 election results for Ohio.
First, here is a map of total Democratic votes within Ohio’s counties. As is typical, Democratic votes were most concentrated in counties with large cities.
Here are the metro areas that provided the most Democratic votes. 1. Cleveland: 561,368 2. Columbus: 450,146 3. Cincinnati: 339,159 4. Akron: 166,653 5. Dayton: 164,079 6. Toledo: 152,505 7. Youngstown: 100,395
And the top 10 counties with the most Democratic votes. 1. Cuyahoga: 398,271 2. Franklin: 351,198 3. Hamilton: 215,719 4. Summit: 134,256 5. Montgomery: 122,016 6. Lucas: 110,833 7. Stark: 68,146 8. Lorain: 66,949 9. Butler: 58,642 10. Mahoning: 57,381
Here is how Democratic votes changed by county between 2012 and 2016.
As you can see, only a handful of counties saw Democratic votes increase in 2016 over 2012, Franklin County being one of them. Some of the biggest losses were in traditionally blue areas like Northeast Ohio.
And here is the change of Republican votes in 2016 vs. 2012.
Most of Ohio’s counties saw increased Republican turnout, though again, Franklin County bucked the trend and actually saw declines.
Finally, a map of the net % change for each county and whether it trended more Republican or more Democratic vs. the net of the 2012 election.
Almost all counties saw a net decrease of Democratic votes/increase in Republican votes. Only 3 counties of 88- Franklin, Delaware and Hamilton- trended more Democratic in 2016 over 2012. All the other 85 trended Republican.
Now that the Summer of 2016 is but a memory, let’s take a quick look back at where it stands in the weather record books.
Temperature
Summer 2016 Means June-August Mean High: 85.5 June-August Mean Rank since 1878: 26th Warmest While the average high for Summer 2016 was certainly warm, it fell just outside of the top 25. By comparison to recent years, 2010 (85.6), 2011 (85.7) and 2012 (87.7) all had warmer average highs.
June-August Mean Low: 66.1 June-August Mean Low Rank since 1878: 4th Warmest The average low for the summer is what made 2016 much more exceptional. No recent years (last decade) were warmer, although 2010 did tie.
June-August Mean: 75.8 June-August Mean Rank since 1878: 10th So if you thought this summer was hot, well you were right. Only 2010 (75.9) and 2012 (76.4) were warmer of any recent years.
Monthly Means June Mean: 73.2 June Mean Rank since 1878: 17th Warmest July Mean: 76.6 July Mean Rank since 1878: 20th Warmest August Mean: 77.6 August Mean Rank since 1878: 6th Warmest The summer gradually became hotter as it went on.
Summer 2016 Misc. Temperature Stats # of 90+ Days: 18 90+ Days Rank: 22nd Warmest High: 95 Warmest Low: 77 Coldest High: 72 Coldest Low: 48
Daily Temperature Records June 11th: Record Warm Maximum Tie: 95: Tied with 1914 and 1933. August 10th: Record Warm Minimum Tie: 75: Tied with 2001. August 11th: Record Warm Minimum Tie: 76: Tied with 1918. August 12th: Record Warm Minimum: 76: Beat record from 1947. August 13th: Record Warm Minimum Tie: 75: Tied with 1995.
Precipitation June-July Precipitation Total: 13.53″ June-July Precipitation Rank since 1878: 29th Wettest Besides being warm, Summer 2016 was also fairly wet.
Monthly Precipitation Stats June Precipitation: 5.22″ June Precipitation Rank since 1878: 29th July Precipitation: 2.49″ July Precipitation Rank since 1878: 27th Driest August Precipitation: 5.82″ August Precipitation Rank since 1878: 13th Wettest So the summer was bookended by wet months with July being fairly dry.
Summer 2016 Misc. Precipitation Stats Total Precipitation Days (including Trace): 45 Total Measurable Precipitation Days: 30 Measurable Precipitation Days Rank since 1878: 16th Highest Days with 0.25″ or Higher: 16 Days with 0.50″ or Higher: 10 Days with 1.00″ or Higher: 4
Daily Precipitation Records June 23rd: 2.75″: Beat the old record in 1901.
The Census just came out with 2015 demographic numbers for all places with at least 65,000 people. Given that half the decade is over, it’s a good point to look at where Columbus stands relative to its national/Midwest peers in a foreign-born comparison. A few days ago, I gave numbers for GDP. In the next few posts, I will look at the people that make up the populations of these places.
First up, let’s take a look at foreign-born populations. I have looked at this topic some in the past, but I have never done a full-scale comparison for this topic.
Total Foreign-Born Population Rank by City 2000, 2010 and 2015 2000—————————————-2010———————————-2015 1. Chicago, IL: 628,903———–1. Chicago: 557,674—————1. Chicago: 573,463 2. San Jose, CA: 329,750——–2. San Jose: 366,194————-2. San Jose: 401,493 3. San Antonio, TX: 133,675—-3. San Antonio: 192,741———-3. San Antonio: 208,046 4. Austin, TX: 109,006————4. Austin: 148,431——————4. Austin: 181,686 5. Las Vegas, NV: 90,656——-5. Las Vegas: 130,503————-5. Charlotte: 128,897 6. Sacramento, CA: 82,616—–6. Chalotte: 106,047—————6. Las Vegas: 127,609 7. Portland, OR: 68,976———7. Sacramento: 96,105————-7. Sacramento: 112,579 8. Charlotte, NC: 59,849——–8. Columbus: 86,663—————-8. Columbus: 101,129 9. Minneapolis, MN: 55,475—–9. Portland: 83,026—————–9. Nashville: 88,193 10. Columbus: 47,713———–10. Indianapolis: 74,407———–10. Portland: 86,041 11. Milwaukee, WI: 46,122—–11. Nashville: 73,327—————11. Indianapolis: 72,456 12. Detroit, MI: 45,541———–12. Minneapolis: 57,846———–12. Minneapolis: 70,769 13. Providence, RI: 43,947—–13. Milwaukee: 57,222————-13. Milwaukee: 58,321 14. Nashville, TN: 38,936——-14. Providence: 52,926————14. Providence: 53,532 15. Indianapolis, IN: 36,067—-15. Orlando: 43,747—————-15. Orlando: 50,558 16. Virginia Beach, VA: 28,276–16. Virginia Beach: 40,756—–16. Omaha: 48,263 17. Orlando, FL: 26,741———17. Omaha: 39,288—————–17. Detroit: 39,861 18. Omaha, NE: 25,687———18. Kansas City: 35,532———18. Virginia Beach: 38,360 19. Kansas City, MO: 25,632—19. Detroit: 34,307—————-19. Kansas City: 37,787 20. Cleveland: 21,372————20. St. Louis: 23,011————–20. Pittsburgh: 28,187 21. Grand Rapids, MI: 20,814–21. Pittsburgh: 18,698————21. St. Louis: 21,802 22. St Louis, MO: 19,542——-22. Cleveland: 17,739————-22. Grand Rapids: 19,176 23. Pittsburgh, PA: 18,874—–23. Grand Rapids: 16,615——–23. Cleveland: 18,830 24. Cincinnati: 12,461———–24. Cincinnati: 16,531————-24. Cincinnati: 16,896 25. Toledo: 9,475—————–25. Toledo: 11,559—————–25. Akron: 10,024 26. Akron: 6,911——————26. Akron: 8,524——————–26. Toledo: 9,257 27. Dayton: 3,245—————-27. Dayton: 5,102——————-27. Dayton: 7,381 28. Youngstown: 1,605———28. Youngstown: 3,695————28. Youngstown: 1,058
Here’s the 2000-2015 total change.
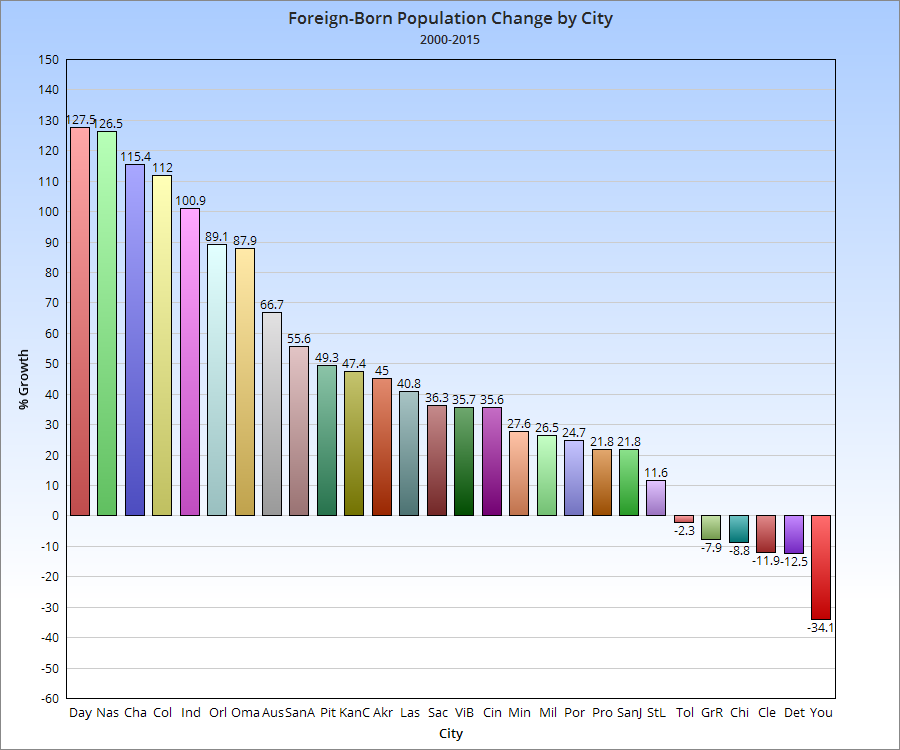
And the 2000-2015 change by %.
So Columbus has an above average total and growth compared to its peers nationally.
The Random Columbus Photos 4 edition takes a look back at Downtown in the 1980s.
Date Photo Taken: 1989 Photo Location: Looking west on Broad Street from LeVeque Tower. This photo is interesting for a few reasons. First, it shows the beginning of construction to replace the Broad Street Bridge over the Scioto River. After the Great Flood of 1913 destroyed an earlier Broad Street Bridge, the one in the photo was finished in 1921. By the early 1980s, the bridge was rapidly deteriorating and the decision was made to replace it. It’s reconstruction start, however, was delayed until 1988 due to a contract to keep the Columbus 500 auto race going, which used the bridge. The nearly identical new bridge was completed in 1992 at a cost of $13.2 million. Across the bridge is the Scioto Peninsula. On the right is Vets Memorial, built in the 1950s and recently demolished to make way for a new memorial and museum as part of the redevelopment of the peninsula. On the left is the old Central High School, years before it was converted into COSI’s new location. Also of note are warehouse and other buildings that still existed on the peninsula, remnants of when this area was largely manufacturing. These were mostly demolished in the 1990s and early 2000s and were left as vacant lots for well over a decade, some of them becoming parking lots for COSI. These lots will soon become part of a large mixed-use development and park.