Aerial photos have been around for more than a century, ever since someone thought to take photos from airplanes. These photos go back to at least the 1910s, when the airplane was still very much a new technology. I thought it might be interesting to do show a few of these before and after Downtown aerial photos to give an idea of how the same areas look today.
Before
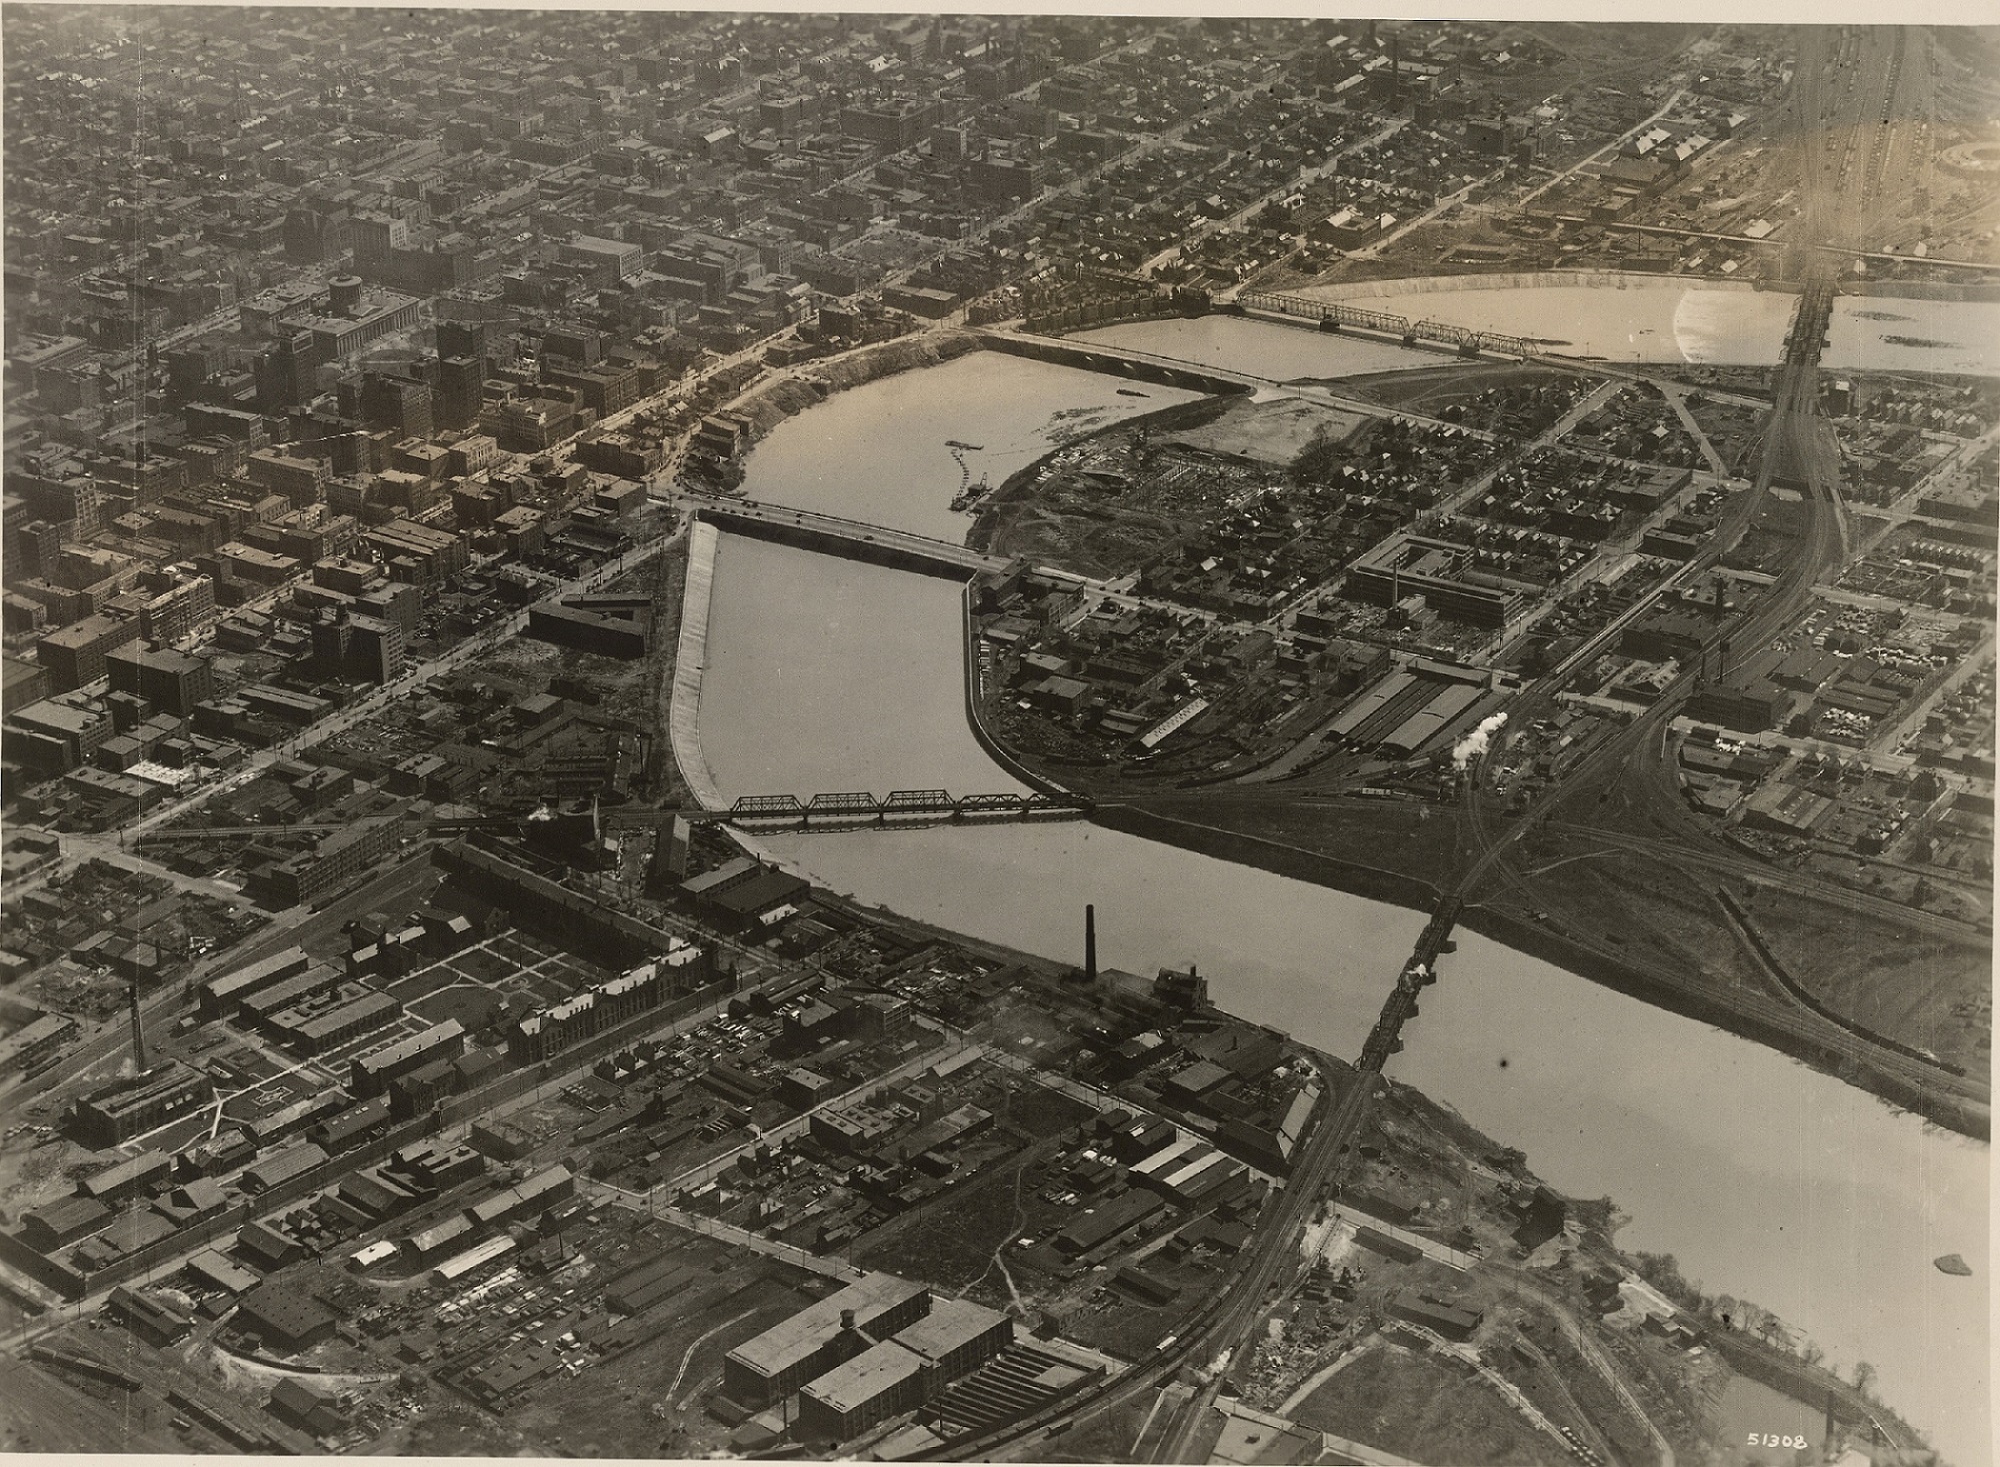
Downtown around 1923.
This photo of Downtown was likely taken sometime between 1922 and 1923. The main clue is that the old Central High School is clearly under construction on the Scioto Peninsula, but seemingly in the early phases. The school would later open in the fall of 1924. Also in the photo is the new Scioto River floodwall under construction just a decade after the Great Flood of 1913. The buildings near and along the riverfront would eventually be demolished for this project, as well as the eventual Civic Center project that would later build the Post Office and Ohio Supreme Court building. Notice as well the lack of Columbus’ signature building- LeVeque Tower. That project would be constructed over the next few years. After
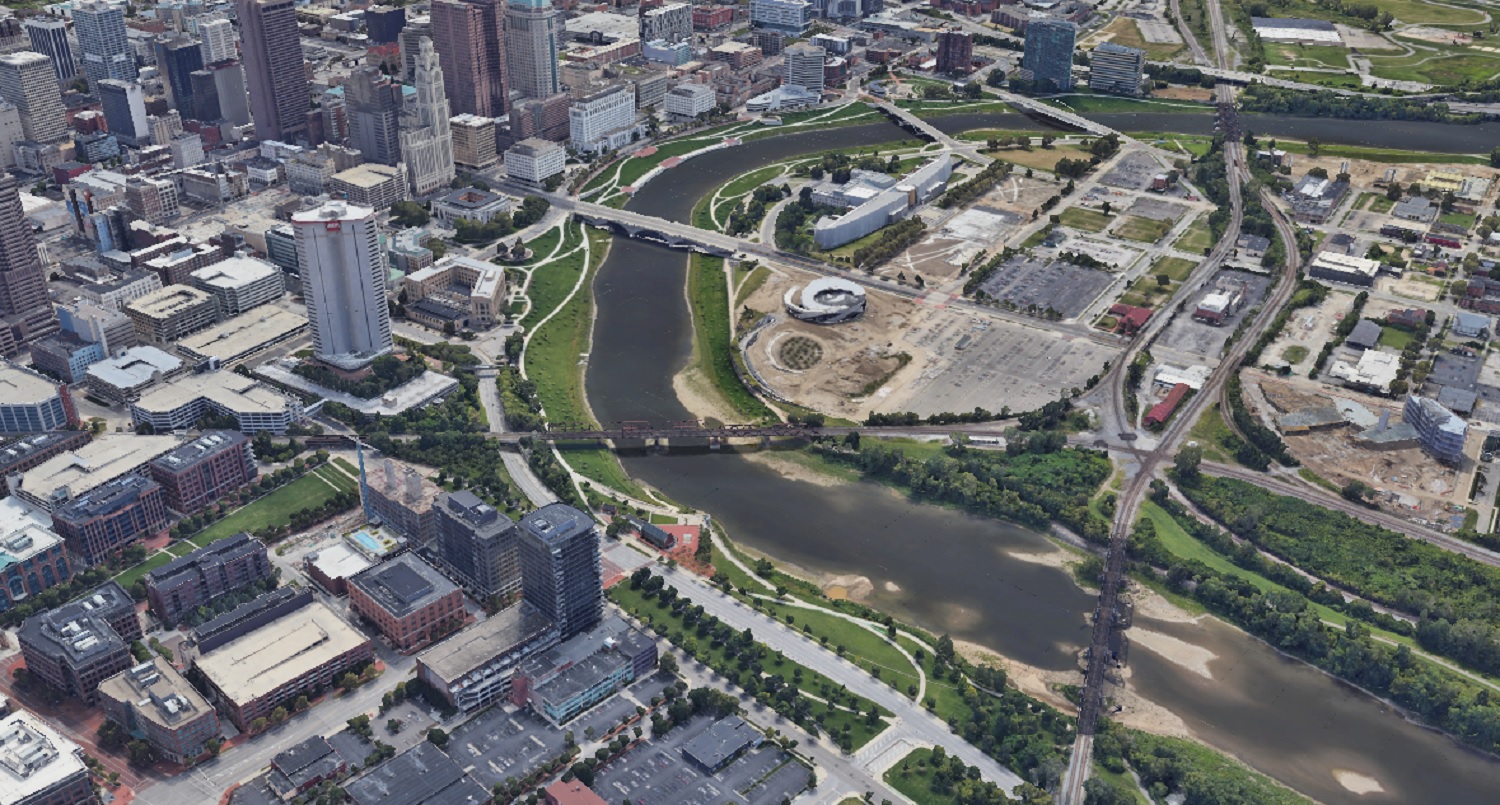
Downtown in 2019.
Downtown has obviously changed enormously in the past century. Skyscrapers now dominate Downtown, and the highway system now cuts through many neighborhoods. The riverfront itself is also significantly nicer and less industrial looking. Before
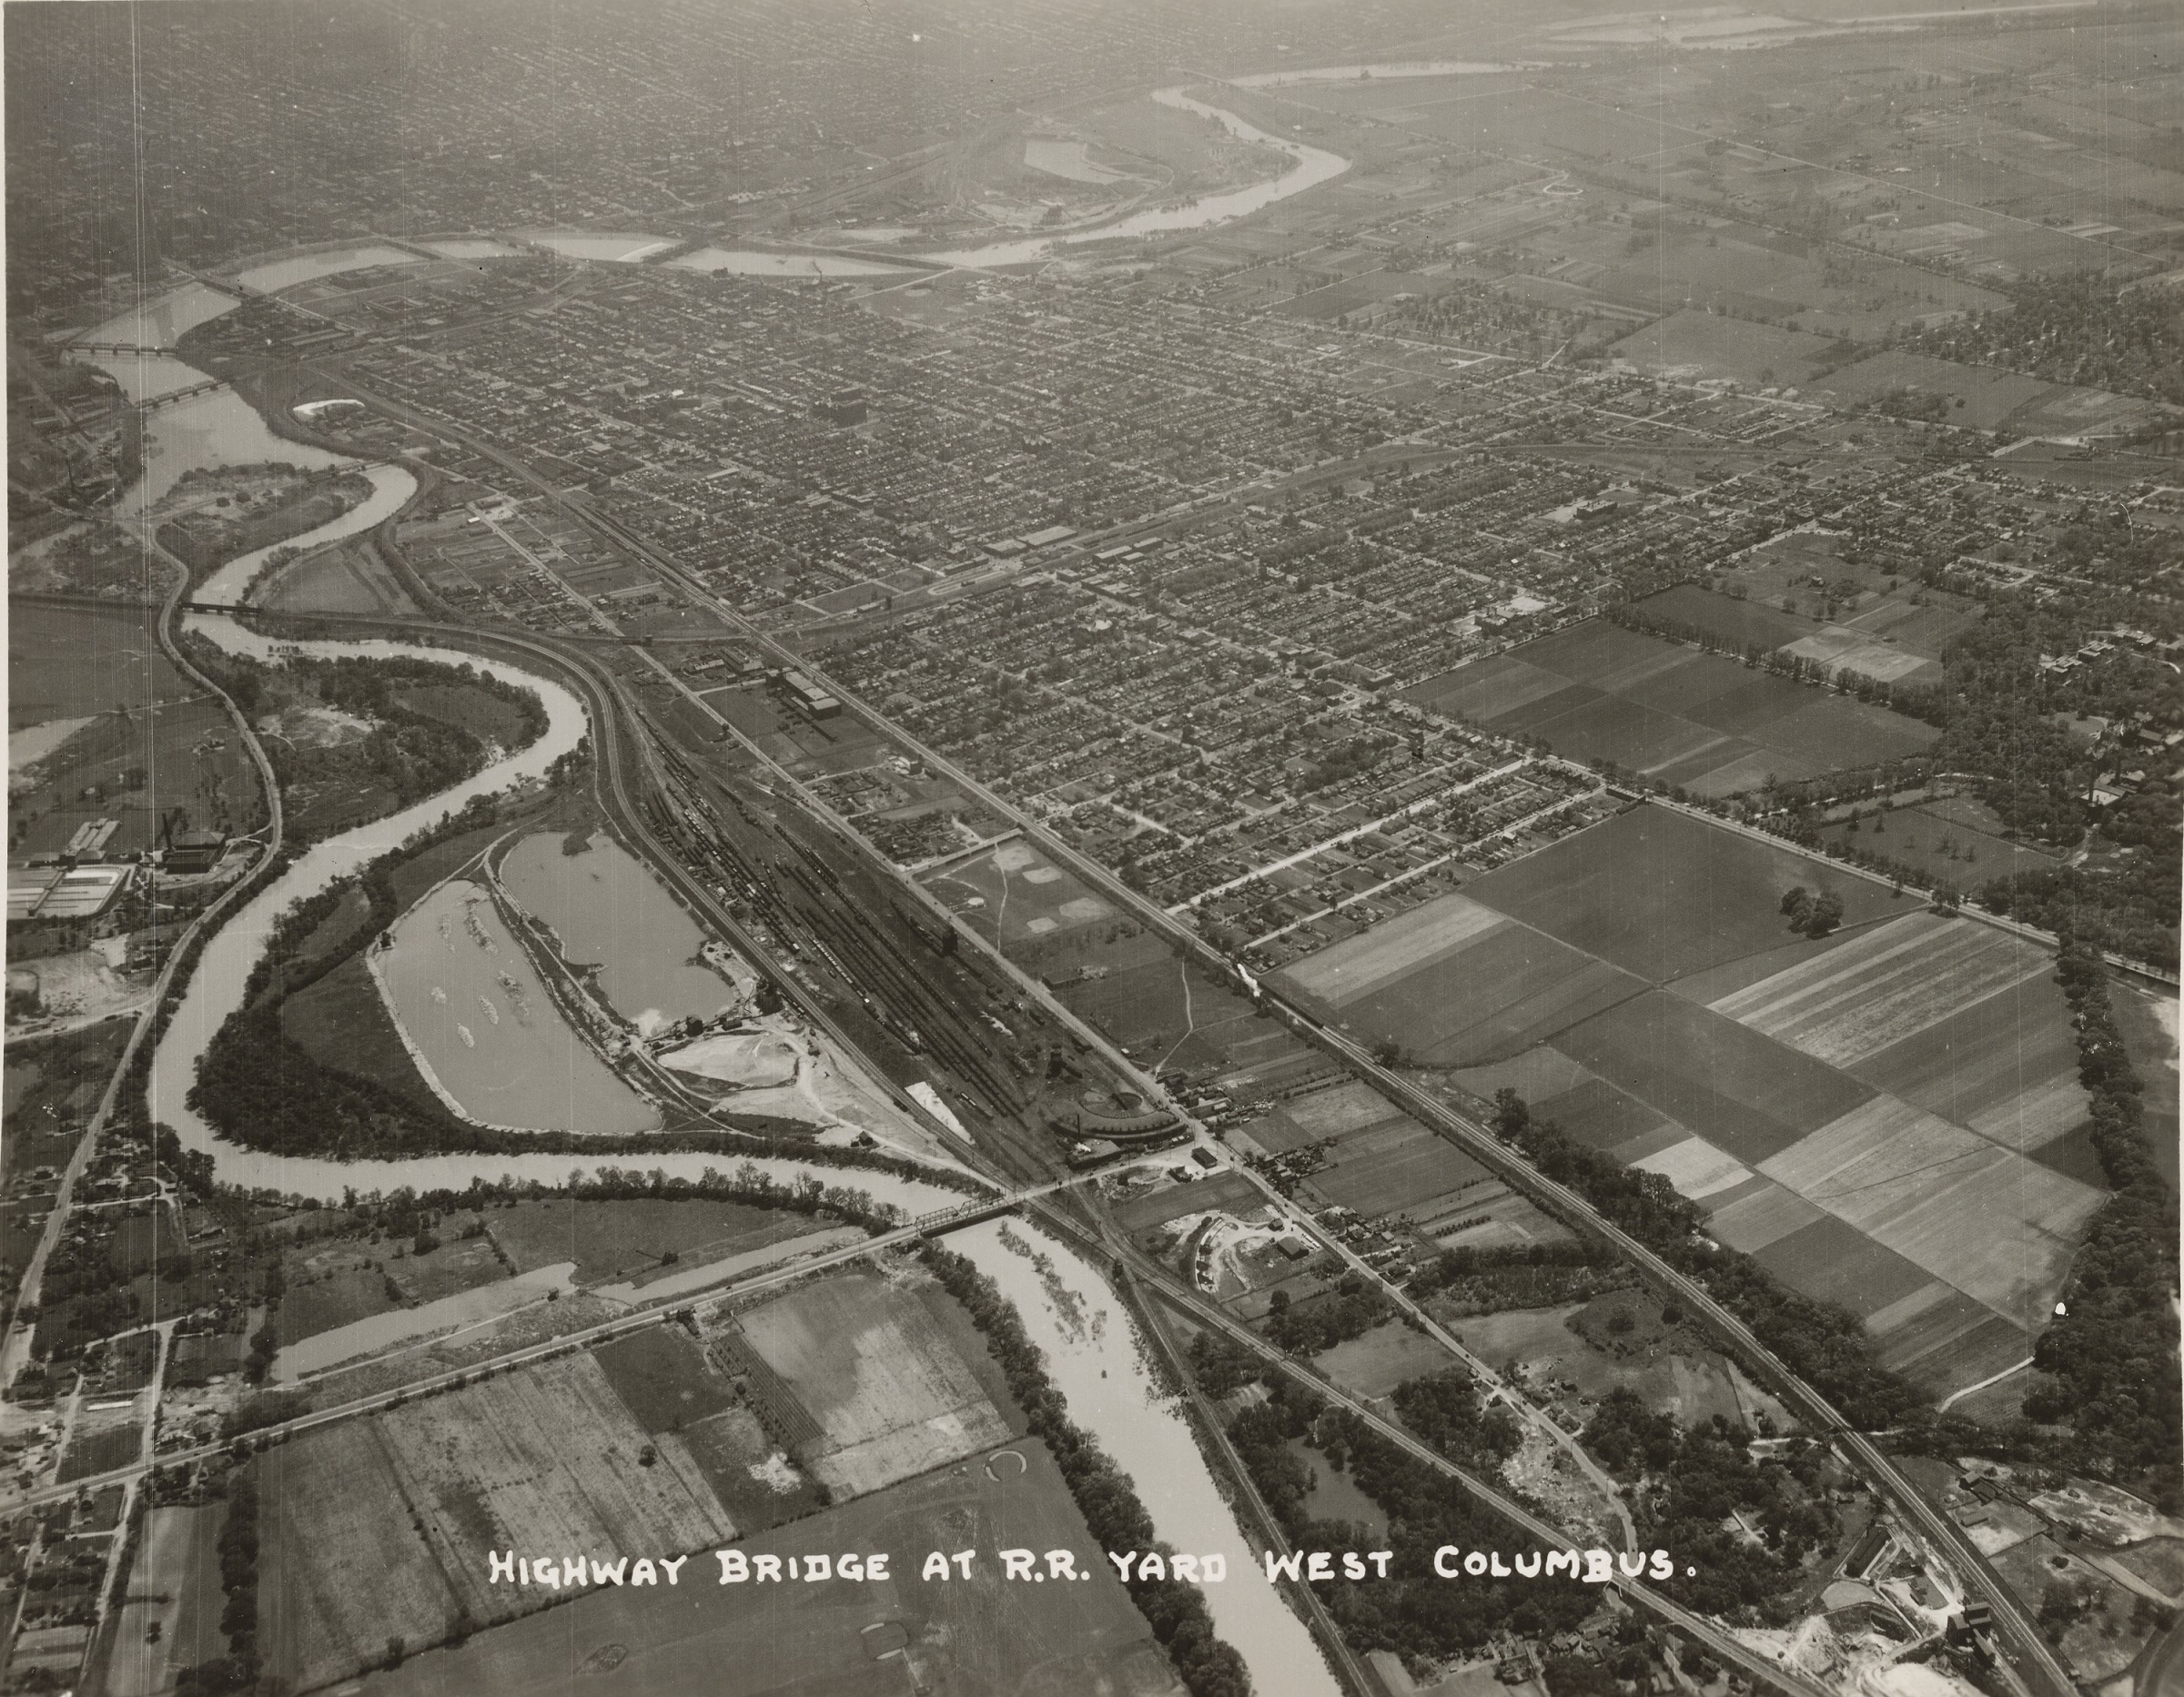
Photo taken in 1929.
This 1929 photo looks west over Franklinton towards Downtown. The most revealing part of this photo is how compact the developed area of Columbus really was at the time. Farm fields can be seen to the south and west of Columbus. After
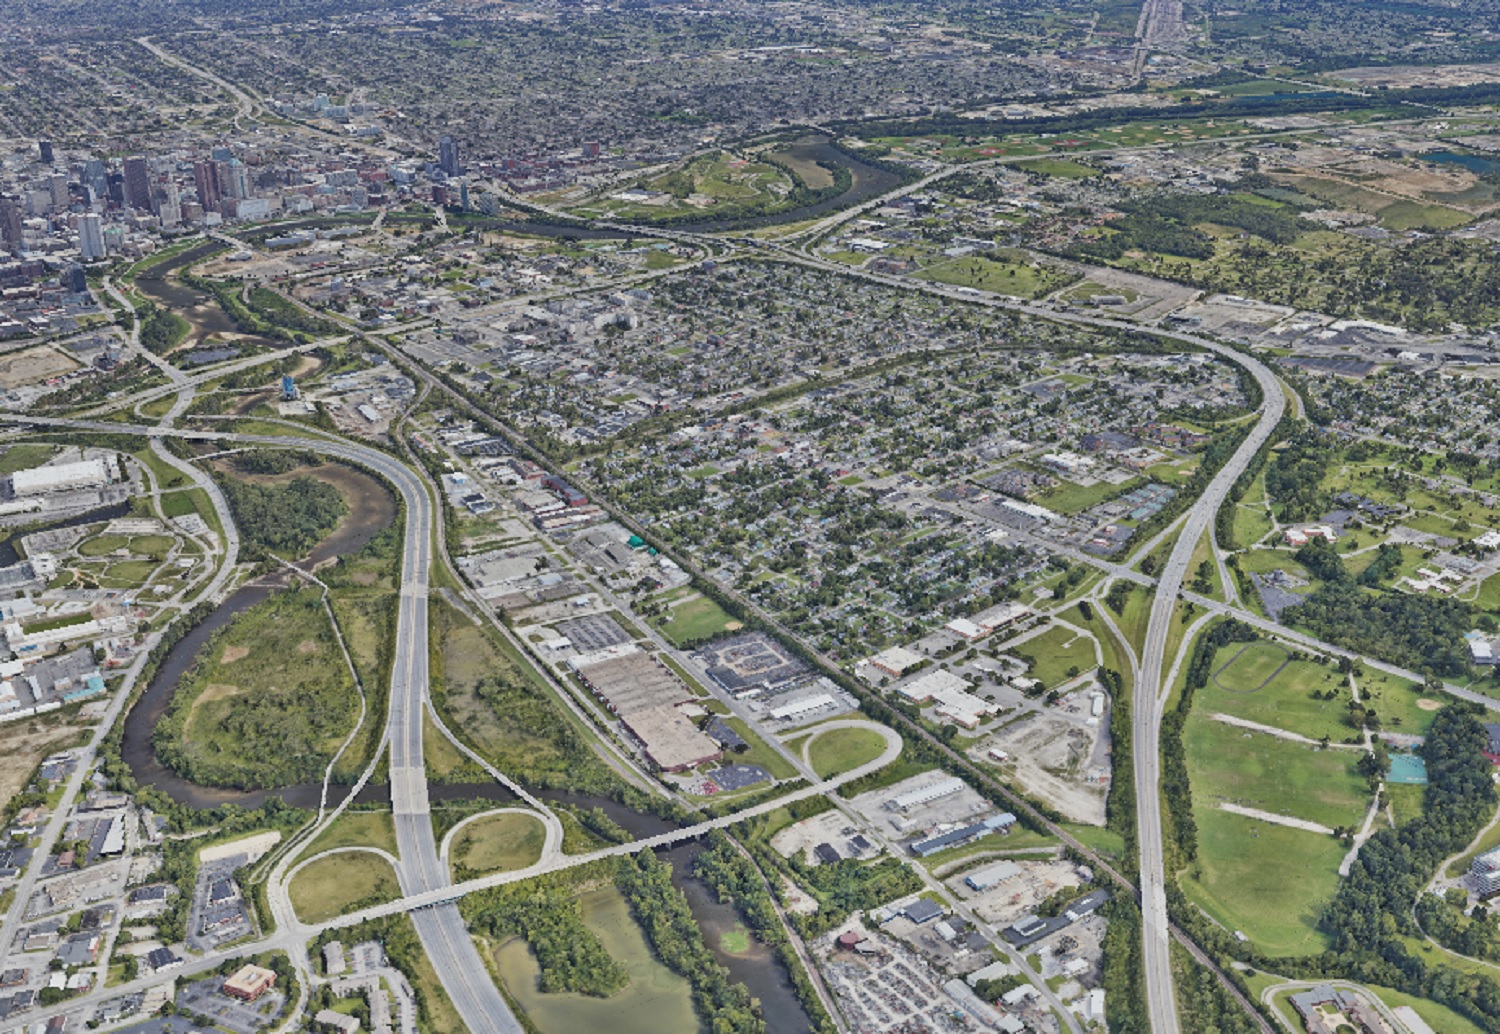
Photo taken in 2019.
In the after photo, nearly all the vacant land is gone except for park space, Greenlawn Cemetery and areas along the rivers.
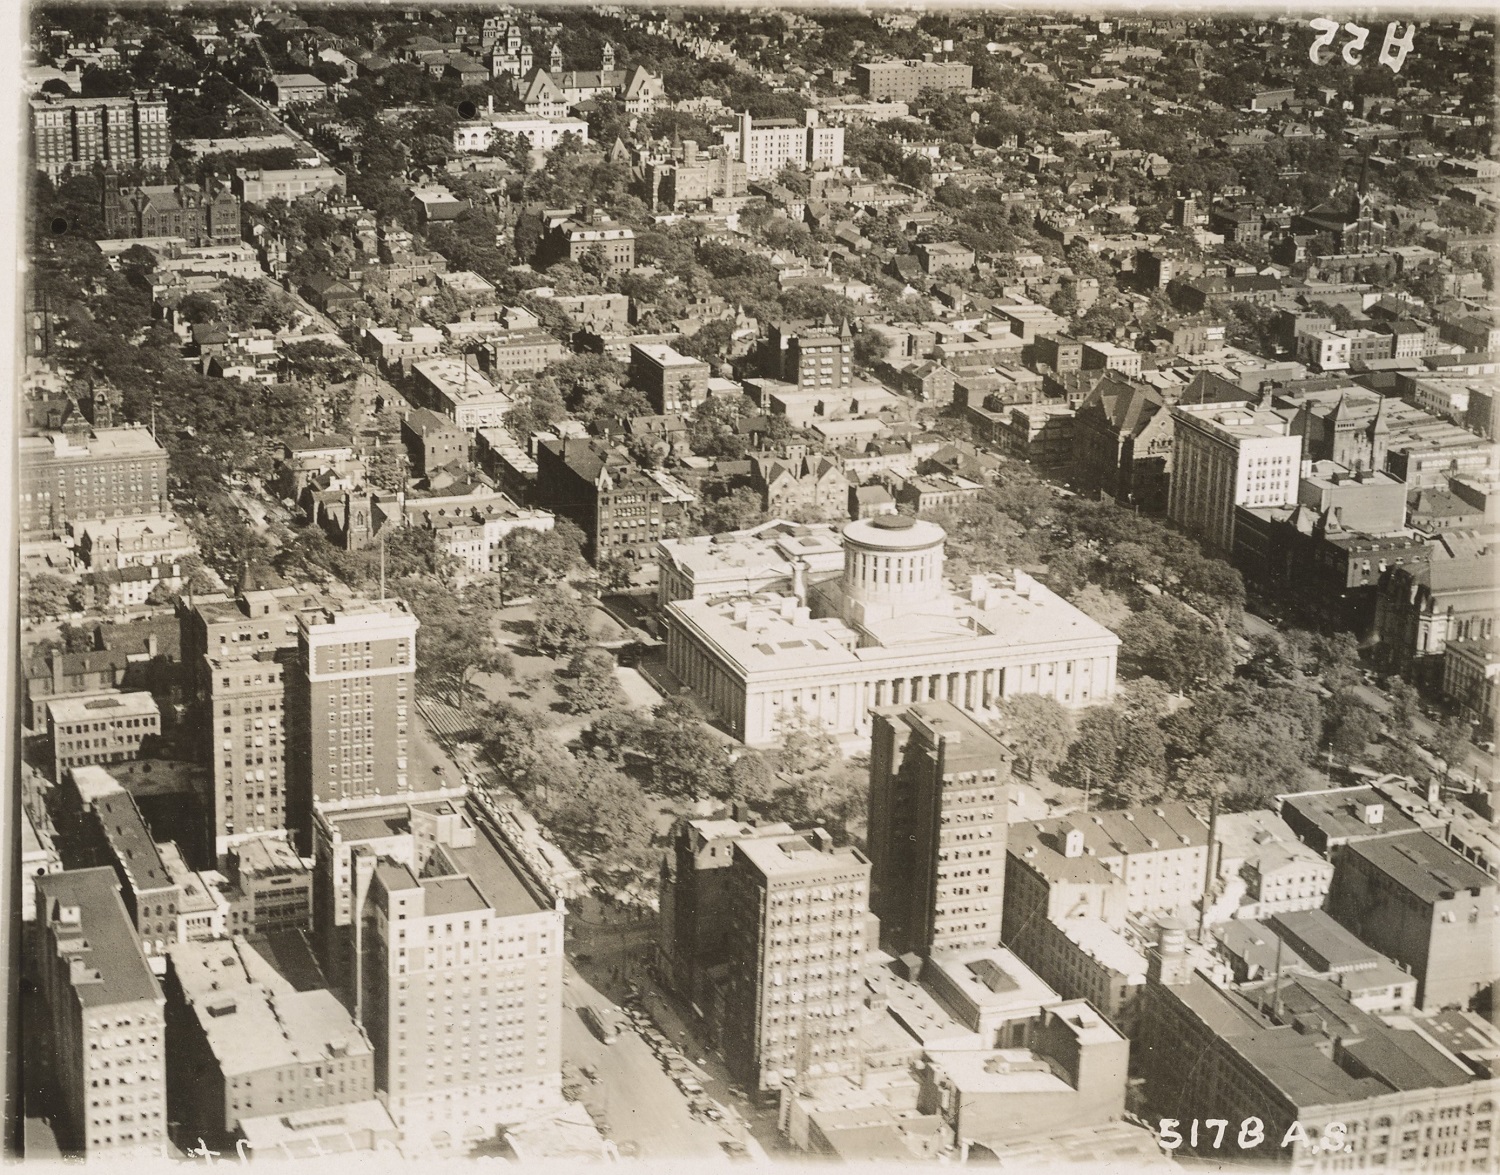
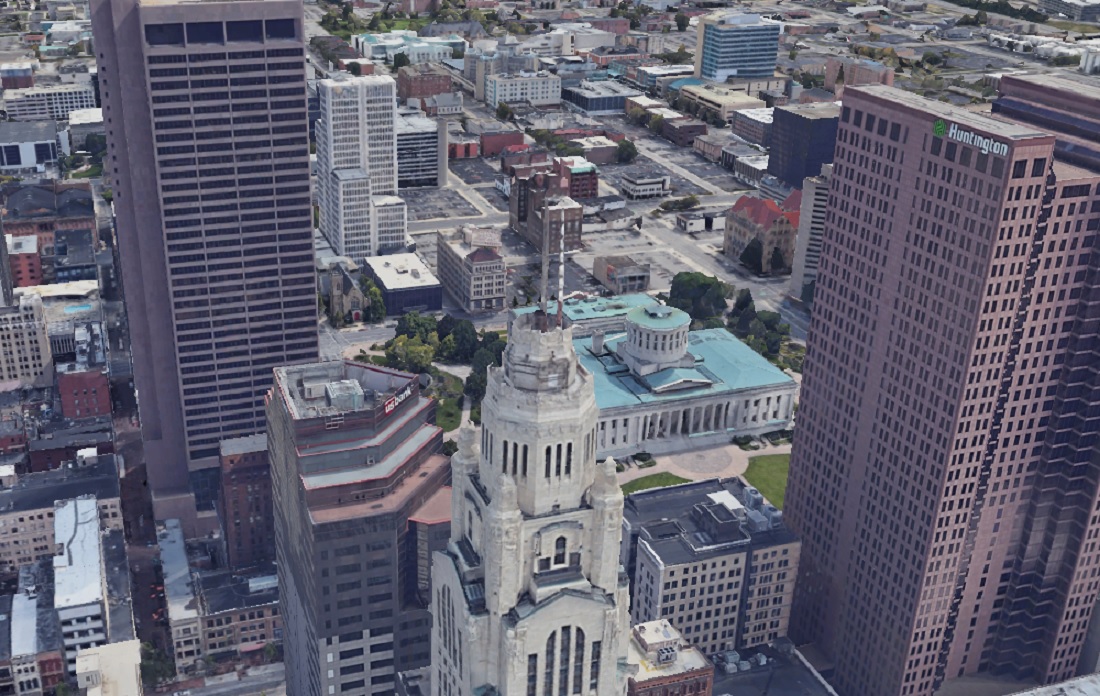
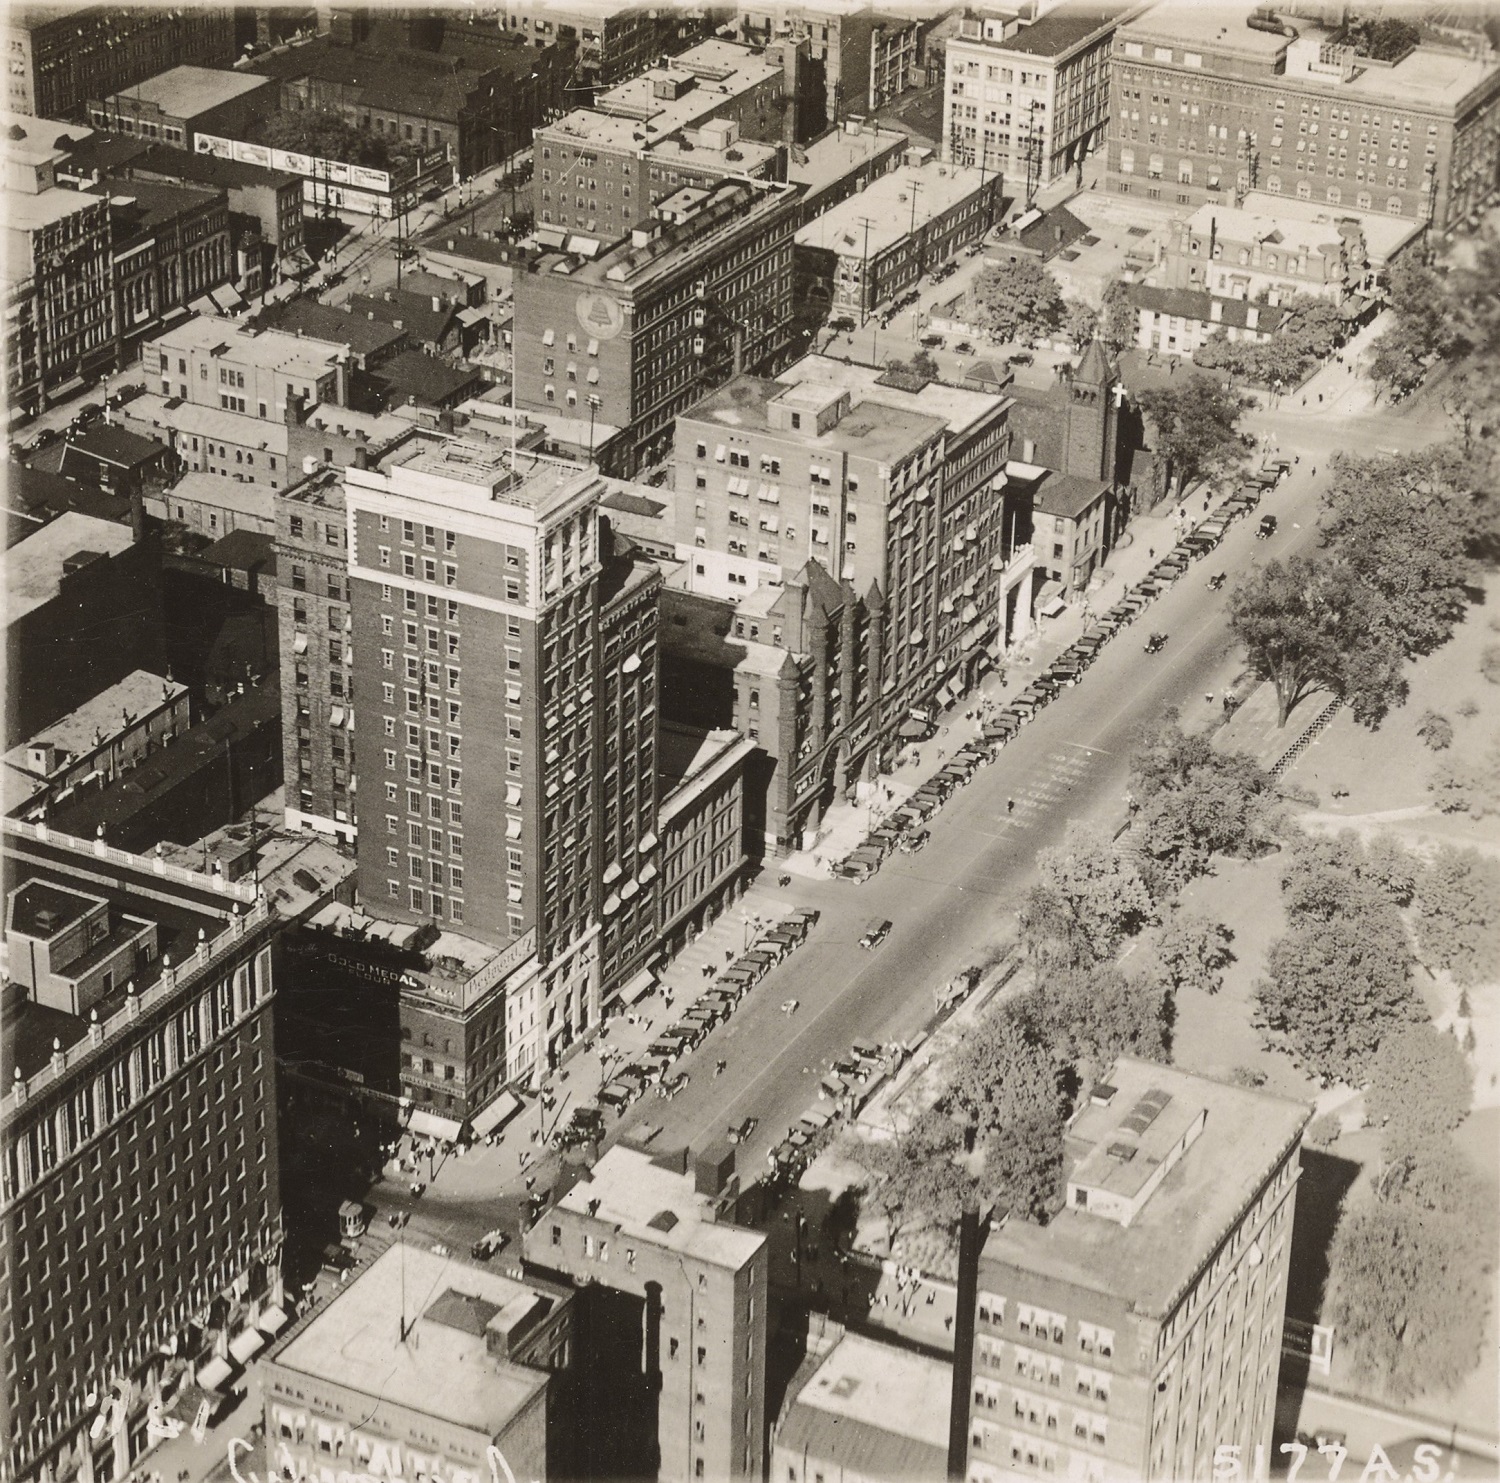
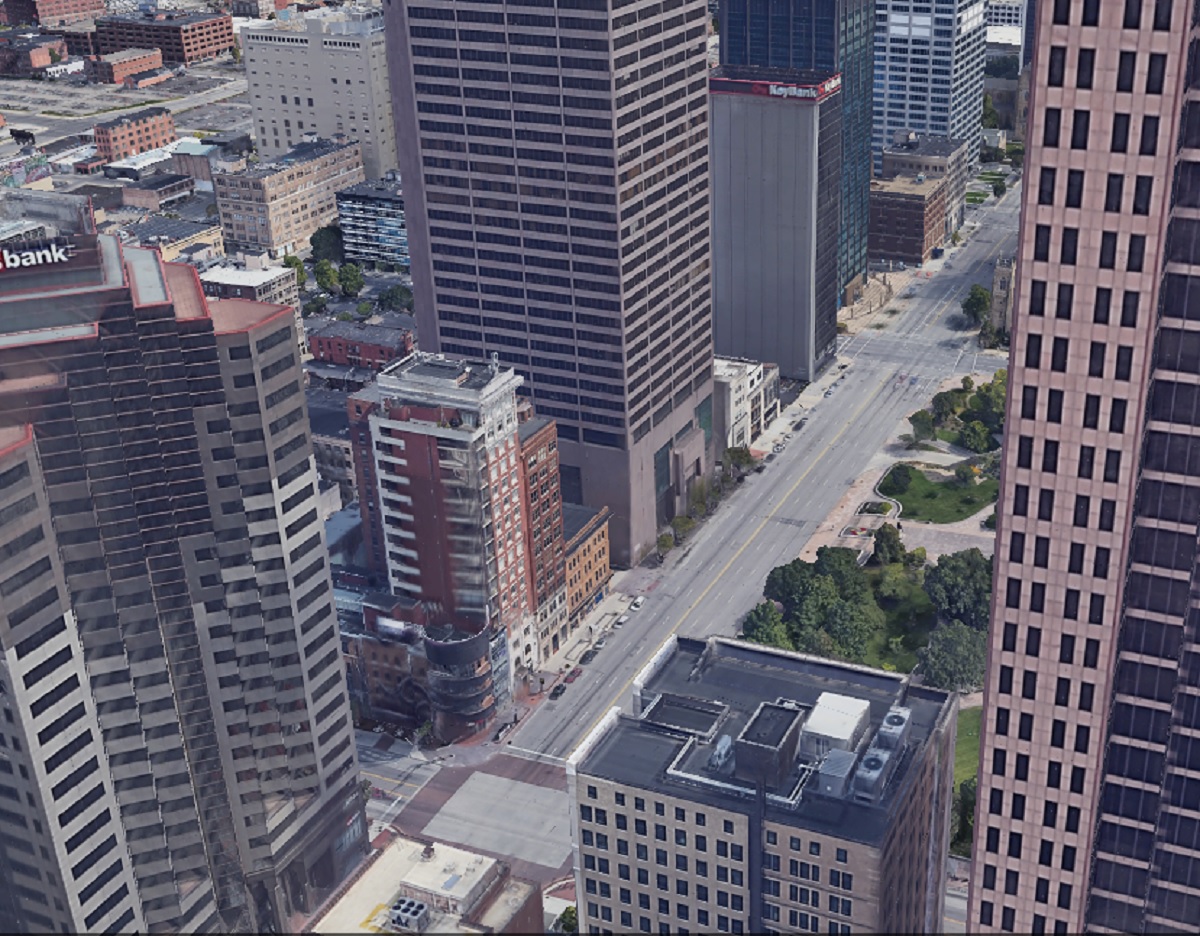
Before This photo of Capitol Square in 1919 is one of the earliest aerials of Downtown I was able to find. This photo predates all highrise construction. The city was compact, dense and dominated by brick buildings. After In the 2019 image, skyscrapers have now replaced many of the older buildings. While the Capitol itself a handful of other buildings remain, the density has largely been lost over the years, with parking lots where many once stood. Before The 1919 image shows the intersection of High and Broad Streets, arguably the very center of Columbus. After Aside from the 8 on the Square building, virtually everything else from 1919 is long gone.
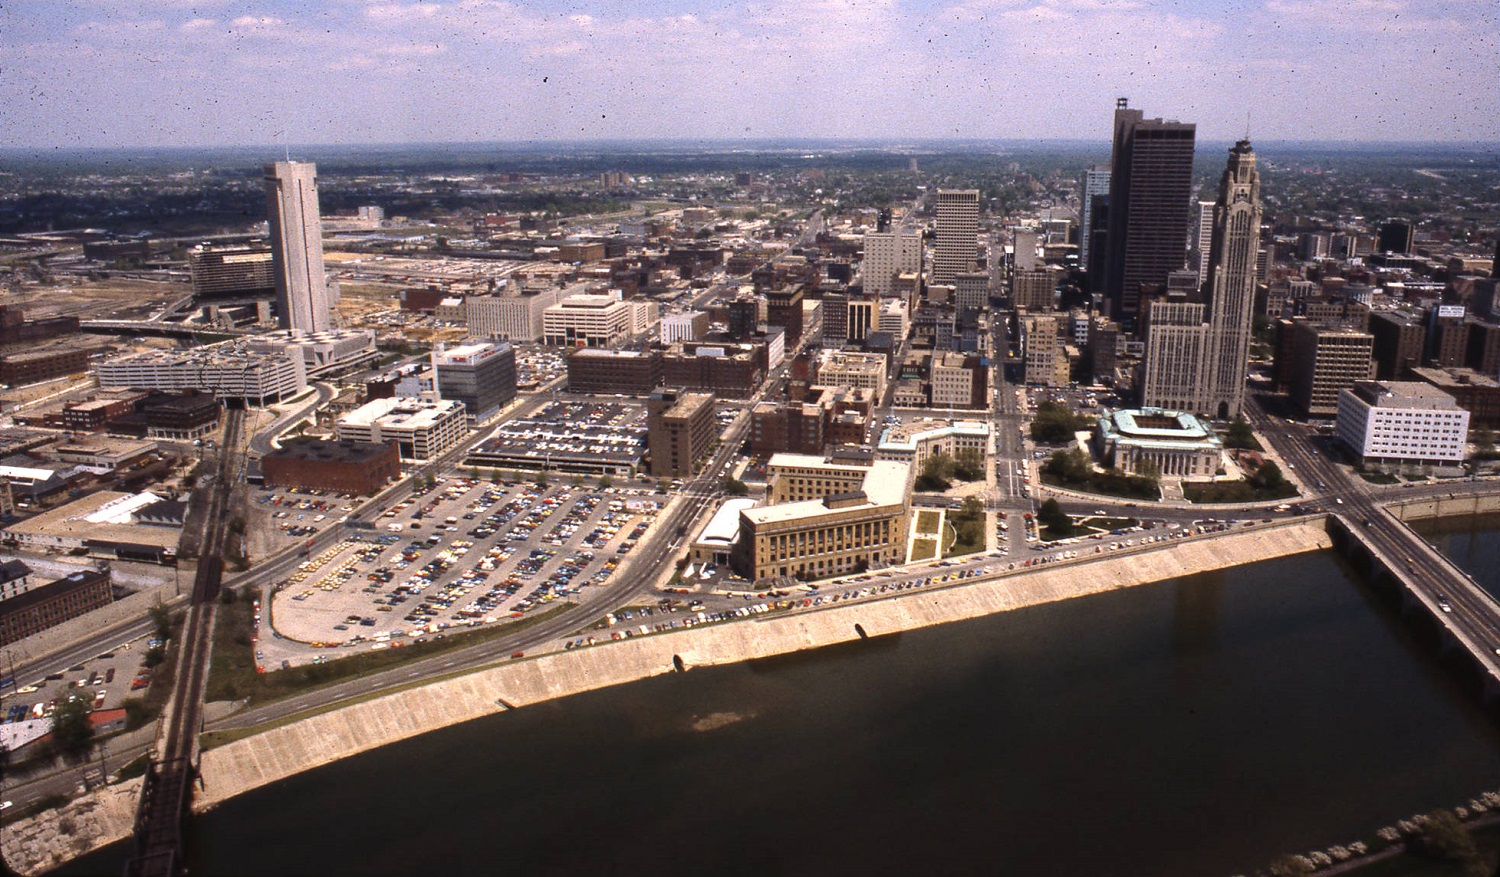
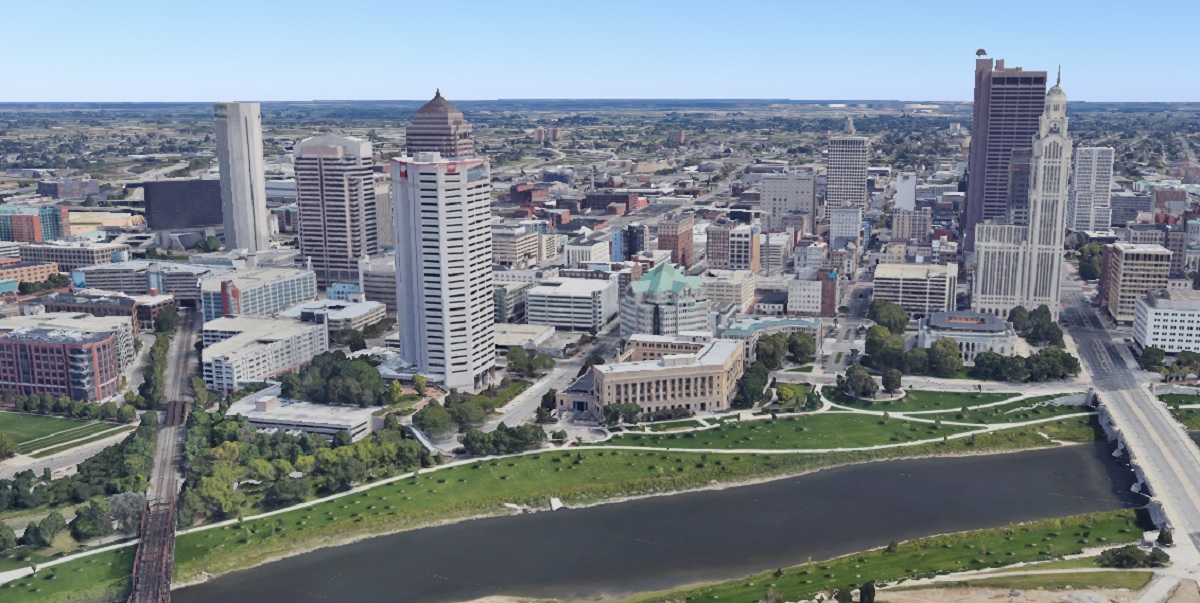
Before This much more modern image of Downtown and the riverfront was taken in 1980. After The 2019 Google Earth image from the same angle shows significant changes in 40 years. New skyscrapers and other development are obvious, but the massive changes to the riverfront itself almost make this look like a different city altogether.
What might these areas look like in another century?
For a long time, Columbus has had a reputation for having a relatively easy commute, at least in terms of driving. Its abundant highway and road system allowed commuters to travel to work quickly, with most commutes 20 minutes or less. However, as the city has grown and traffic has increased, the local commute may not be as quick as it once was. Story after story has shown that Columbus’ commute is steadily getting worse.
This post seeks to answer both how people are getting to work, how fast they get to work, and how commuters in Columbus differ from those in other cities. For this comparison, I used cities from metro areas most similar to Columbus’ size- 1.5-2.5 million- as well as major Midwest and Ohio cities.
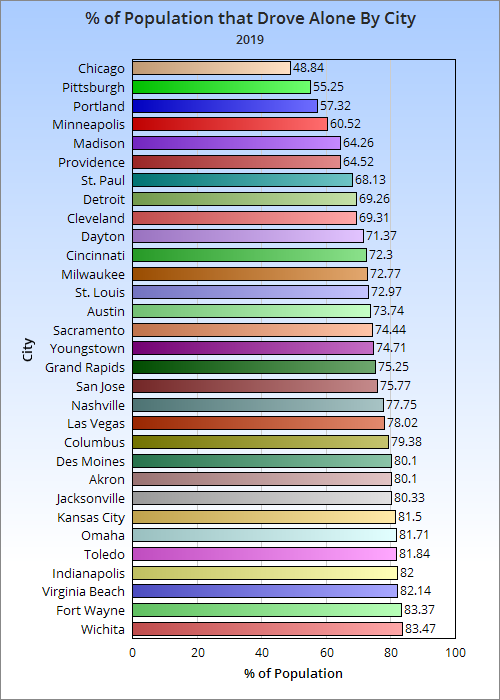
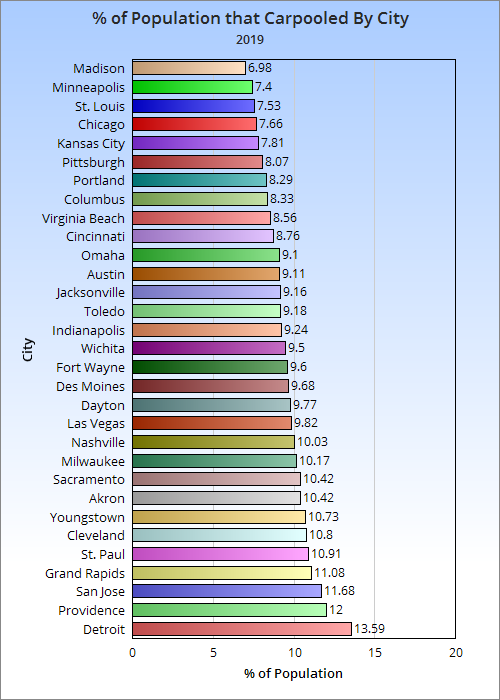
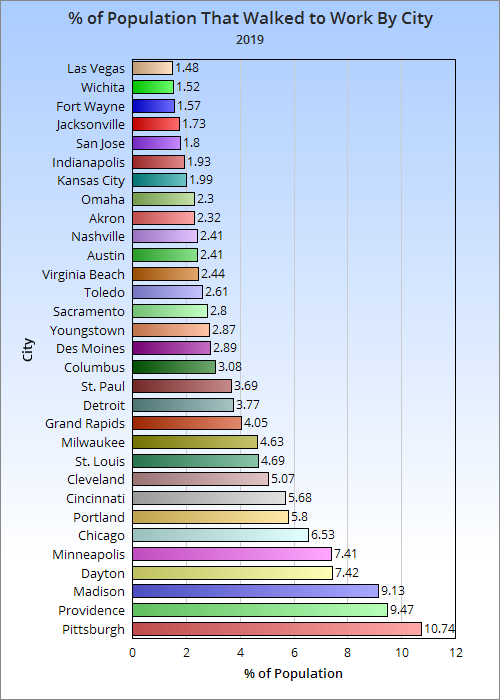
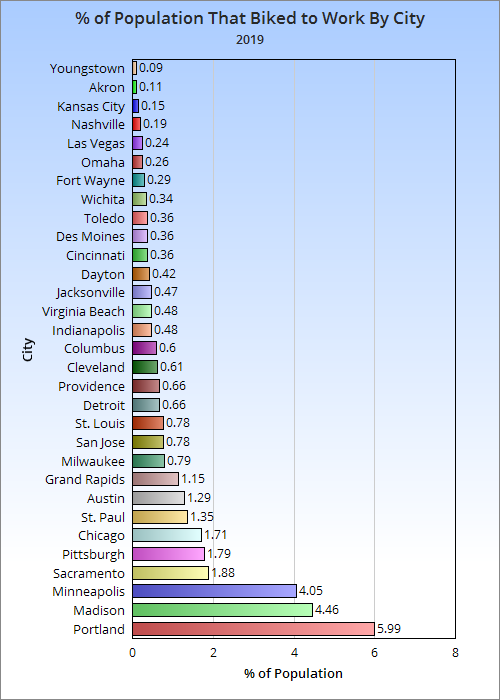
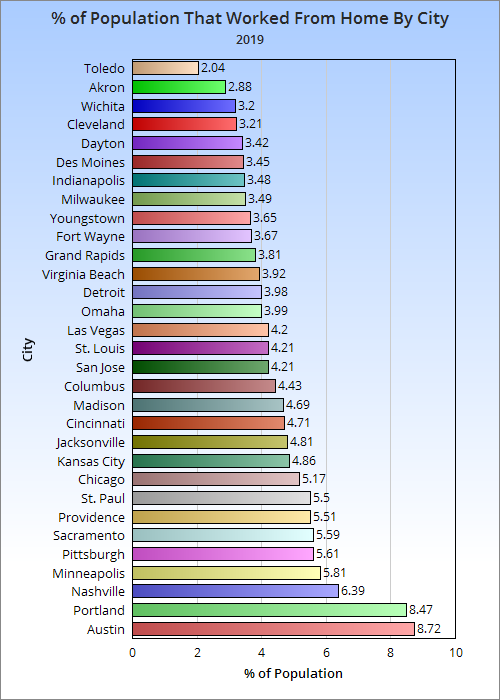
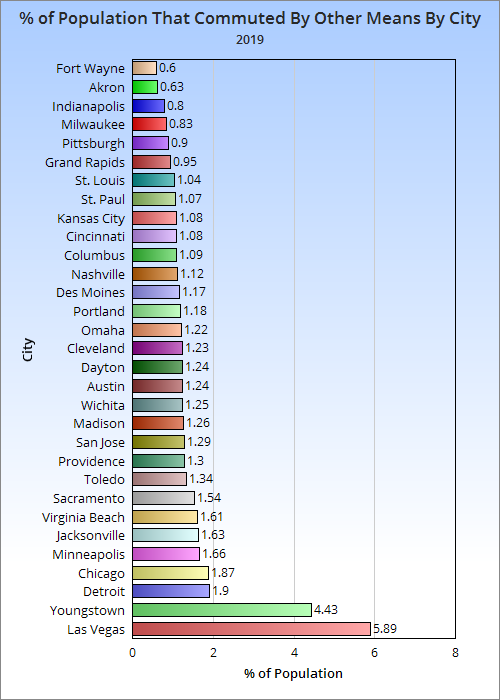
First, let’s look at just how people get to work by the % of workers in 2019, the latest year available.
Out of the 31 cities looked out, Columbus is the 10th most car-dependent city. It is also the 3rd most car-dependent in Ohio after Akron and Toledo.
The heavy use of cars in Columbus did not translate to more people carpooling.
With only the COTA bus system available, the portion of the population that uses public transit is also in the bottom half. This despite the city seeing strong bus ridership growth over the last several years.
Columbus sat right in the middle of cities with the number of walking commuters. Several parts of the city lack sufficient walking infrastructure. For example, large parts of Linden and the South Side were built without sidewalks of any kind. Crosswalks and other safety features are also lacking in many areas.
Columbus is again in the middle of the pack on biking commutes, and again infrastructure is the likely reason. There is only a single section of one bike lane that is protected anywhere in the city. Creating more bike lanes, let alone protected ones, remains a low priority for the city. Instead, they have relied on “Shared Use” type signage, along with painting sharrows.
Columbus was in the top half of at-home workers. These numbers were all prior to the pandemic, so it’s likely that there will be significant increases in long-term or permanent home workers in post-2019 numbers.
Other types of commuting include everything from taxis to commercial airline flights.
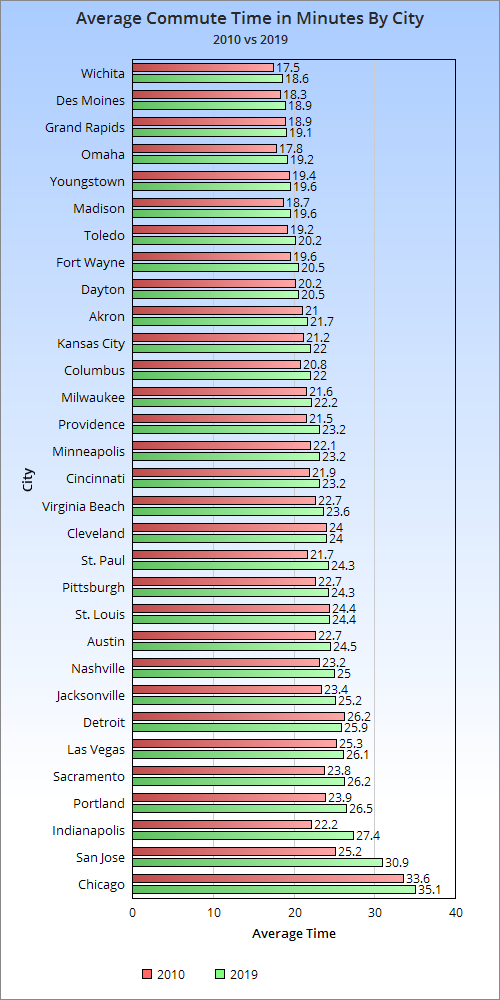
Columbus was in the bottom half of cities for the average commute time. Like almost everywhere else, that time has been increasing, however. Columbus saw the 11th biggest commute time increase and had the 2nd largest in Ohio. With its far larger population growth recently and predicted, that commute time is only going to get worse.
It’s pretty clear that Columbus has significant car dependency. With increasing commute times, it is crucial to plan for how people will get to work in the future. That is why it’s so important that new development is built to be walkable and dense while the average commute is still relatively short. This will promote walking, biking and new transit forms, all of which is better for a more vibrant, healthier city. It will also perhaps keep the number of cars on the road from growing as much. To assist in this process, the city must invest in more pedestrian and bike-friendly infrastructure, while also writing building codes that promote better planning in development.
To be fair, Columbus has made some progress. In 2010, the % of the population that drove alone was 80.76%, 1.38 points above where it was in 2019. Furthermore, the city has promoted more bus usage with its CPASS program. That said, the culture changes could’ve been much better had more policy and infrastructure been in place years ago like many other cities have had. Columbus has a lot of work to do.
Only about 22% of Columbus’ land is made up by tree cover, which is lower than many of its national peers. Because of this, the city has come up with the Columbus Urban Forestry Plan, which in part seeks to plant millions of trees in the coming years, potentially beginning next year. You can view the plan, timeline, tree canopy statistics and neighborhood maps all the way down to a block by block level at the following link: Forestry Plan
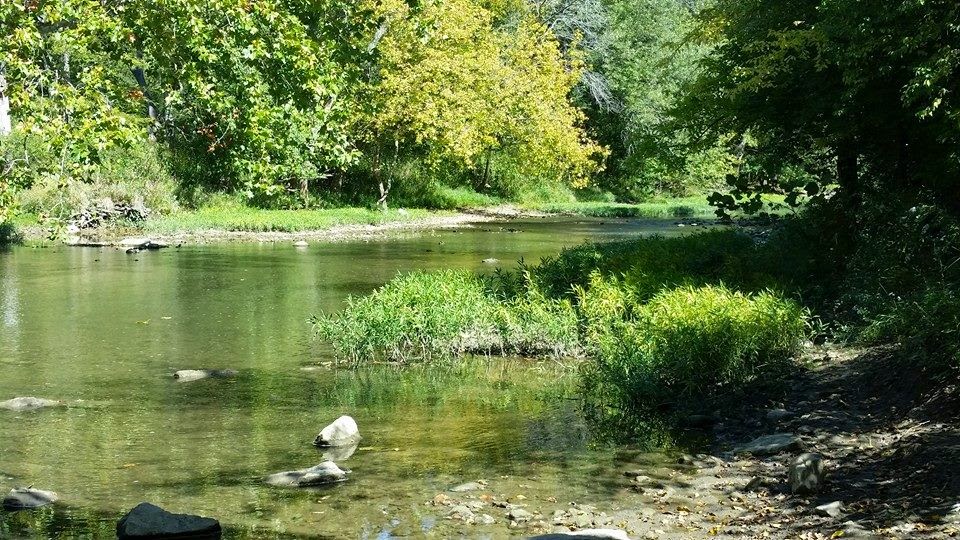
This edition of Failed Project, we review the proposed Big Darby Creek reservoirs and why they never happened. The Big Darby Creek watershed is one of the best natural areas of Franklin County. Designated a national and state scenic river, Big Darby Creek is one of Ohio’s most pristine waterways, and is home to several endangered species. Battelle Darby Creek Metro Park has grown to become the crown jewel of the Metro Parks system, encompassing more than 7,000 acres of forests, waterways and prairie.
The river’s history, however, has not always been so tranquil.
All the way back in 1943, Ohio State University zoologist Milton Trautman discovered a tiny catfish in Big Darby, the Scioto Madtom. The fish only exists in the Big Darby, and was an early clue as to the biological diversity that can be found there, now known to be home to more than 100 species of fish and more than 40 species of mussels.
By 1950, a small park of 34 acres had formed, the beginning of what would become the Battelle Darby. Development pressures, however, were already threatening the system. I-70 cut through the middle of the system in the early 1960s, and the construction of I-270 allowed for the suburban explosion. Without significant intervention, the watershed would’ve been inevitably developed. Ironically, a plan to largely destroy the Big Darby ultimately helped saved it.
While most major rivers and streams in the state had been dammed or altered for flood control by the 1960s, Big Darby remained free-flowing. Two separate proposed projects would’ve changed that irrevocably. The first was a proposal by the Army Corps of Engineers to build what would’ve been called the Lower Darby Dam, in west-central Franklin County, near the heart of the current Battelle Darby park. The high dam proposal would’ve flooded at least 3,000 acres of land, and the Corps began to buy the land in preparation for the project. This was in the late 1960s, coinciding with the beginning of the development boom in western suburbs like Hilliard. Instead of prime real estate along the river being developed with single-family housing and strip malls, the dam plan had the opposite effect by making the land essentially unmarketable and off limits to developers. A coinciding proposal by the City of Columbus to build another dam, the Upper Darby Dam, had the same effect on areas at that proposed site in Brown Township further to the north. The 2-dam proposal had effectively removed the majority of Franklin County’s Big Darby Creek off the market.
As development pressure was removed, environmental groups rose up to stop the Lower Darby Dam project itself. This fight was waged until 1973, when the plan was finally abandoned by the Army Corps of Engineers. They still owned the land, however, and with uncertainty of the dam project resurfacing someday, development interests continued to stay away. Three years later, in 1976, Columbus Metro Parks received a $1 million grant from the Battelle Memorial Foundation, which was then matched with an additional $1 million grant from the U.S. Department of the Interior Land and Water Conservation Fund. Suddenly flush with cash, Metro Parks began a land-buying spree along the Big Darby, particularly targeting the land that the Corps had set aside for the reservoir, pushing the size of the park from roughly 400 acres in 1976 to about 3,000 acres by 1984.
That year, on June 22, 1984, 82 miles of the Big and Little Darby creeks were designated as state scenic rivers. The designation more or less ended any remaining plans for the Upper Darby Dam. It had been shelved since 1979 when the Department of Natural Resources and environmental groups managed to stop that dam project as well. Just 4 years after the scenic river designation, during the extremely dry, hot summer of 1988, the idea of the dam was revived. Former Columbus Service Director Walter “Hap” Cremean, whose name today is on some city facilities, considered the Big Darby key to Columbus’ future water needs. The city was searching for a source of water that could provide the city with an additional 30 million gallons of water a day by 2000, not a small task. Cremean himself had been the city’s service director at the time that Columbus was pushing for the dam project in the 1960s. On July 12, 1988, Cremean was quoted saying, “In 1968, we instituted the acquisition of property along Big Darby. We were spending $1 million a year for what we considered the next major reservoir site for Franklin County,” Cremean said. “In my opinion, it is impossible to talk about full development of the West Side without (Big Darby).”
The search for new sources of water for Columbus continued into the early 1990s, but by 1990, the Big Darby reservoir option was losing favor due to its long history of opposition. The city had drafted a study called Water Beyond 2000, which was finished on September 26, 1991. At least 20 options for expanding water sources had been on the table, including the Big Darby reservoir, but the study had narrowed down the choices to just 7. Among the choices eliminated from consideration was the Big Darby plan, an option that the study concluded was going to be one of the most expensive, at $280 million. For all intents and purposes, the idea of a Big Darby reservoir was finally dead… or sort of. While a reservoir directly on the Darby was off the table, a reservoir in the watershed using the Darby’s water was still very much on.
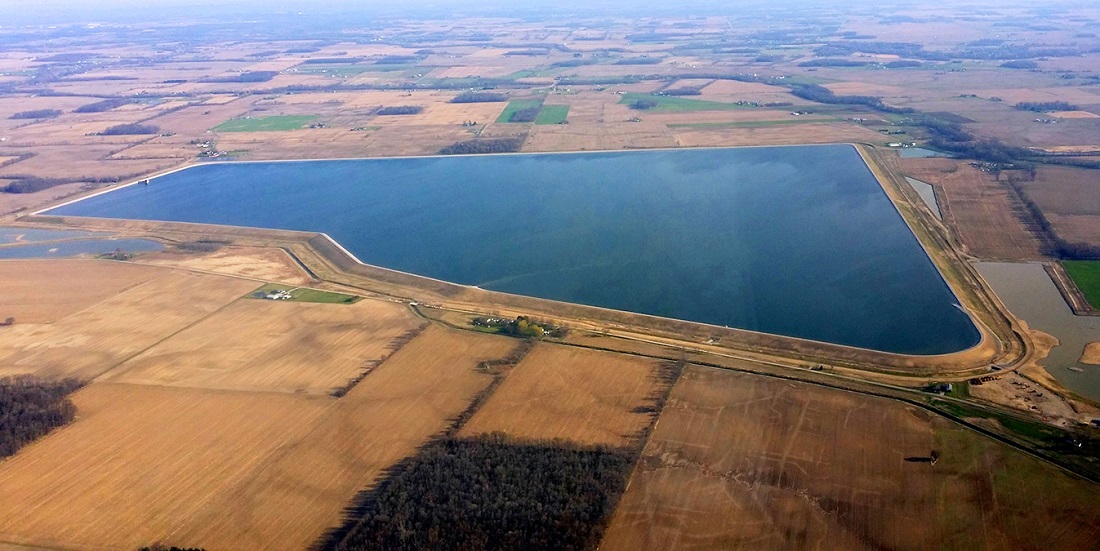
Through the rest of 1991 and into the first half of 1992, residents waited for the list of 7 options to be narrowed down further. On July 6, 1992, that final list came out. The Big Darby option was eliminated completely. No reservoir would be built anywhere near it. In the end, the Columbus Upground Reservoir was built just to the southeast of Richwood, along with new wells drilled along the Pickaway-Franklin County line. Combined, they provided more than enough water to serve the city long into the future.
Columbus’ Upground Reservoir
The following year, in 1993, the Big and Little Darby were given National Scenic River status, the highest designation a US river can receive. Battelle Darby Creek Metro Park has continued to expand beyond 7,000 acres and will continue to grow even larger in the future, with the ultimate goal of having the entire 75 miles of Big Darby as part of a continuous park. Development pressures remain in the area, and in recent years, there have been the occasional fish and mussel die-offs, suggesting that the Big Darby is still under threat. What we do with this beautiful natural resource is up to us. Though dams are no longer in the picture, other dangers lurk. In the early 1990s during the height of the water search, the Big Darby was not the only waterway under threat. A similar dam project was under proposal for the Scioto River in Delaware County. My family was moving at the time and we looked at a house near the small town of Prospect, not far from where the proposed dam would’ve gone. On the trip there, a series of roadside signs caught our attention, and I still remember the rhyme: A flooded valley, We don’t deserve, Because Columbus, Can’t conserve. The rhyme was referring strictly to water conservation, but it seems to me that saving water- and indeed all natural resources- does not just mean using less. The Big Darby, along with all our waterways and natural areas, deserve our lasting protection. Had better heads not prevailed, Battelle Darby would’ve been under 50 feet of water today, and Columbus- and Ohio- would be without one of its best natural areas.
There’s been some discussion over the last few years about how driving habits are changing nationally. I’ve seen at least a few reports suggesting that overall driving is actually on the decline and has been for some time. This even while the population of the US continues to rise. A http://uspirg.org/sites/pirg/files/reports/US_Transp_trans_scrn.pdf”>new report has come out detailing the changing habits of cities, including the changing Columbus transit scene.
Percent Change in Per-Capita Vehicle Miles Traveled from 2006-2011 Columbus: -5.7% Dayton: -0.2% Akron: +1.2% Cleveland: +5.1% Youngstown: +5.4% Cincinnati: N/A Toledo: N/A
Columbus saw the largest drop in vehicle miles traveled, indicating that people there are driving less. Northeast Ohio all saw increases, which goes against the national trend. Toledo and Cincinnati did not have comparable numbers.
Percent Change in Per-Capita Passenger Miles Traveled on Mass Transit 2005-2010 Columbus: +1.6% Dayton: -0.6% Akron: -2.8% Youngstown: -8.3% Toledo: -28.8% Cleveland: -34.2% Cincinnati: -34.8%
Columbus was the only city to see an increase in its mass transit miles. Cleveland, Cincinnati saw drops of more than 1/3rd.
Change in the Proportion of Workers who Commuted by Car, 2000-2011 Dayton: -1.5% Columbus: -1.2% Toledo: -1.0% Youngstown: -1.0% Akron: -0.8% Cleveland: -0.4% Cincinnati: -0.2%
All 7 saw declines.
Change in the Proportion of Workers who Biked to Work, 2000-2011 Columbus: +0.3% Akron: +0.1% Cleveland: +0.1% Dayton: +0.1% Toledo: +0.1% Cincinnati: +0% Youngstown: +0%
Columbus saw the largest increase of all 7, although the actual changes are all small. No city measured in the US saw a change of more than +1.7%. The majority of cities were less than 0.3%.
Change in the Proportion of Workers Who Worked From Home, 2000-2011 Columbus: +1.4% Cincinnati: +0.9% Dayton: +0.8% Cleveland: +0.6% Toledo: +0.6% Youngstown: +0.6% Akron: +0.5%
Columbus again leads, though all cities saw increases.
Total Per-Capita Vehicle Miles Traveled in 2006 Cleveland: 8,285 Youngstown: 8,806 Akron: 9,379 Columbus: 9,956 Dayton: 10,084 Cincinnati: N/A Toledo: N/A
Total Per-Capita Vehicle Miles Traveled in 2011 Cleveland: 8,705 Youngstown: 9,284 Columbus: 9,385 Akron: 9,490 Dayton: 10,068 Cincinnati: N/A Toledo: N/A
Total Per-Capita Mass-Transit Miles Traveled in 2005 Cleveland: 172.0 Cincinnati: 110.0 Dayton: 64.7 Columbus: 52.6 Toledo: 51.6 Akron: 42.9 Youngstown: 17.3
Total Per-Capita Mass-Transit Miles Traveled in 2010 Cleveland: 113.0 Cincinnati: 71.8 Dayton: 64.1 Columbus: 53.4 Akron: 41.7 Toledo: 36.7 Youngstown: 15.9
% of Workers who Traveled by Car, 2011 Cleveland: 89.2% Columbus: 89.8% Cincinnati: 90.6% Dayton: 91.4% Akron: 92.5% Toledo: 93.1% Youngstown: 94.4%
National Rank (of 100 cities) in the % Change for those who Biked to Work, 2000-2011 Columbus: 15th Dayton: 37th Cleveland: 38th Akron: 39th Toledo: 49th Cincinnati: 74th Youngstown: 81st
% Change of Households with No Vehicle, 2006-2011 Akron: +2.2% Dayton: +1.0% Cleveland: +0.9% Columbus: +0.9% Cincinnati: -0.3% Toledo: -0.4% Youngstown: N/A
So what does all this data tell us? Well, for the most part, all Ohio cities are seeing car use decline in some way or another. Columbus performs strongly in car use declines and increases in at-home workers and increases in bike commuting. Mass-transit was where it performed the weakest, where it’s middle of the pack. Yet even there, it saw increases in its use.