Columbus GDP 2001-2011


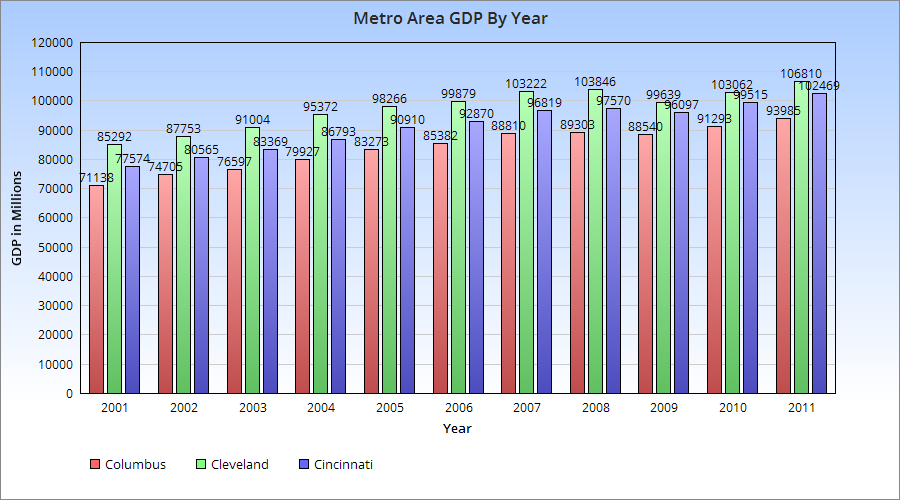
Recently the US Bureau of Economic Analysis released GDP numbers for metro areas for 2011. Below is a chart for Ohio’s 3-Cs of GDP from 2001 to 2011.
Columbus GDP 2001-2011 Columbus, Ohio

All the metros saw GDP growth during this period, and all saw dips during the recession before growing again the past few years.

Total Growth (in Millions) 2001-2011
Cincinnati: $24,795
Columbus: $22,850
Cleveland: $21,518

GDP % Growth 2001-2011
Columbus: 32.1%
Cincinnati: 31.9%
Cleveland: 25.2%

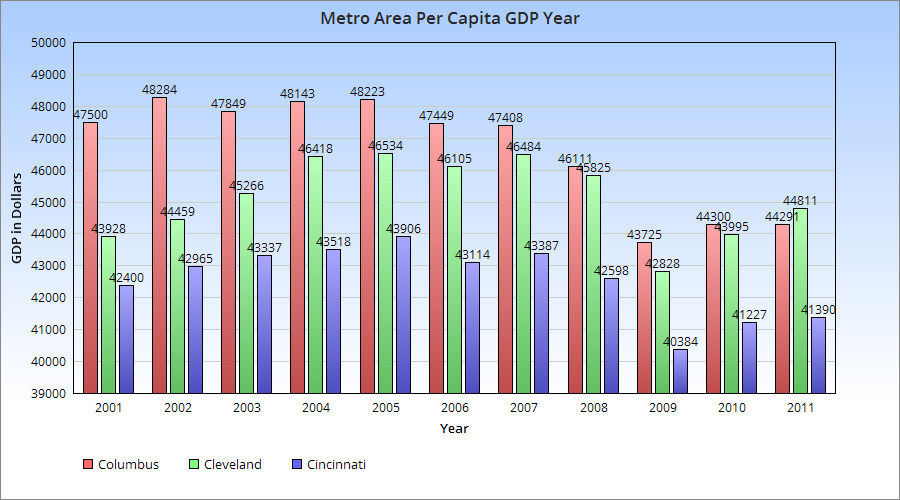
So this shows that the Columbus metro has had the fastest growth the past 10 years in its GDP, albeit only a bit faster than Cincinnati.

The graph above shows the metro GDP per capita. Columbus was clearly ahead the first half of the last decade, but has fallen since. There are two reasons for this: Continuously growing population and the recession. A growing population and stagnant GDP during the recession meant that the GDP was diluted between more people. Neither of the other two faced the strong population growth during the recession. I expect the trends will reverse again over the next few years, however.


Housing Market Update January 2013


housing market update January 2013

Columbus housing market update January 2013

We’re starting a new year in this edition of the Columbus Housing Market Update, with new January 2013 data now available!

Note: LSD= Local School District, CSD= City School District. In both cases, school district boundaries differ from city boundaries.

Top 15 Most Expensive Locations By Median Sales Price in January 2013
1. New Albany: $447,500
2. Powell: $342,500
3. Upper Arlington CSD: $320,000
4. New Albany Plain LSD: $314,400
5. Dublin: $284,00
6. Bexley: $269,950
7. Olentangy LSD: $250,101
8. German Village: $241,618
9. Worthington: $228,938
10. Grandview Heights: $223,000
11. Downtown: $210,000
12. Granville CSD: $207,000
13. Dublin CSD: $190,450
14. Big Walnut LSD: $187,000
15. Marysville CSD: $182,000

New Albany continued to be the most expensive market.

Top 15 Least Expensive Locations by Median Sales Price in January 2013
1. Whitehall: $29,750
2. Hamilton LSD: $54,500
3. Columbus CSD: $68,500
4. Groveport Madison LSD: $70,000
5. Lancaster CSD: $71,250
6. Valleyview: $79,850
7. Newark CSD: $84,500
8. Reynoldsburg CSD: $94,500
9. Columbus: $95,000
10. Jefferson LSD: $95,000
11. South-Western CSD: $103,000
12. Circleville CSD: $109,000
13. Canal Winchester CSD: $112,000
14. Pataskala: $120,000
15. London CSD: 122,000

Whitehall was by far the cheapest market to buy into this month.

Overall Market Median Sales Price in January 2013: $120,885

Top 15 Locations with the Highest Median Sales Price % Growth Between January 2012 and January 2013
1. Newark CSD: +83.3%
2. Valleyview: +76.5%
3. Lithopolis: +71.1%
4. Circleville CSD: +61.4%
5. Groveport Madison LSD: +60.9%
6. Marysville CSD: +38.8%
7. London CSD: +34.8%
8. New Albany: +29.7%
9. Columbus CSD: +28.0%
10. Grandview Heights: +27.4%
11. Columbus: +26.7%
12. Upper Arlington CSD: +24.3%
13. Downtown: +19.3%
14. Sunbury: +18.4%
15. South-Western CSD: +16.1%

Downtown and Columbus overall made the top markets for appreciation in the past year.

Top 15 Locations with the Lowest Median Sales Price % Growth Between January 2012 and January 2013
1. Granville CSD: -50.7%
2. Jonathan Alder LSD: -33.0%
3. Westerville: -29.2%
4. Dublin CSD: -23.3%
5. Hamilton LSD: -21.6%
6. Jefferson LSD: -20.8%
7. Big Walnut LSD: -19.7%
8. Bexley: -17.6%
9. Gahanna: -17.0%
10. Johnstown Monroe LSD: -16.2%
11. Westerville CSD: -14.8%
12. Worthington CSD: -12.5%
13. German Village: -10.5%
14. Grove City: -6.4%
15. Whitehall: -4.9%

Overall Market Median Sales Price % Change January 2012 vs. January 2013: +8.6%

Top 10 Locations with the Most New Listings in January 2013
1. Columbus: 957
2. Columbus CSD: 605
3. South-Western CSD: 210
4. Olentangy LSD: 146
5. Hilliard CSD: 126
6. Westerville CSD: 109
7. Dublin CSD: 94
8. Pickerington LSD: 81
9. Grove City: 66
10. Groveport Madison LSD: 65

Top 10 Locations with the Fewest New Listings in January 2013
1. Valleyview: 1
2. Minerva Park: 1
3. Lithopolis: 2
4. Jefferson LSD: 3
5. Obetz: 6
6. Jonathan Alder LSD: 8
7. Grandview Heights: 9
8. Sunbury: 10
9. Johnstown Monroe LSD: 10
10. Hamilton LSD: 12
11. Whitehall: 15

Total New Listings in the Columbus Metro in January 2013: 2,388
Overall Metro New Listings % Change January 2012-January 2013: -3.7%

This month, prices increased as overall supply slipped.

For more information on the local market, go here: Columbus Realtors