After 4 previous tries, Ohio voters approved a constitutional amendment to allow casinos to operate in the state’s 4 largest cities. Three years after that 2009 vote, casinos began operations in Cleveland, Columbus and Toledo, with Cincinnati’s casino opening the following year in 2013.
The Columbus casino was originally supposed to be built Downtown in the Arena District. Specifically, it was supposed to be built where the Crew’s new stadium now sits. There was quite a bit of opposition to this plan given that casinos provide little to no external business traffic, and the thinking was that it would’ve caused more problems for the neighborhood than what it was worth.
So, the following year, a second statewide vote allowed for the Columbus casino to change locations to the West Side. The site that was chosen was the former Delphi plant, which had been closed since 2007. A bit of hypocrisy and irony was not lot in the demand to move the site, though. The West Side and Westland area were already in late state decline at that point, and proponents of the move claimed that the casino would help the area improve. This claim was made despite the fact that the move was initiated with the idea that it would’ve hurt the Arena District.
Still, the West Side seemed to be all for the move, as a new business- even a casino- was still better than a closed and deteriorating industrial plant.
Columbus’ Hollywood Casino opened on October 8, 2012 after about 2 years of site clearing and construction. While visions of the West Side raking in the benefits never really materialized in reality, the casino itself has gone on to great success in terms of revenue.
Initially, Cleveland- whose own Jack Casino was located in the heart of its downtown- was the highest earner by revenue in the state, Columbus passed it by 2016 and has been the state’s leader ever since.
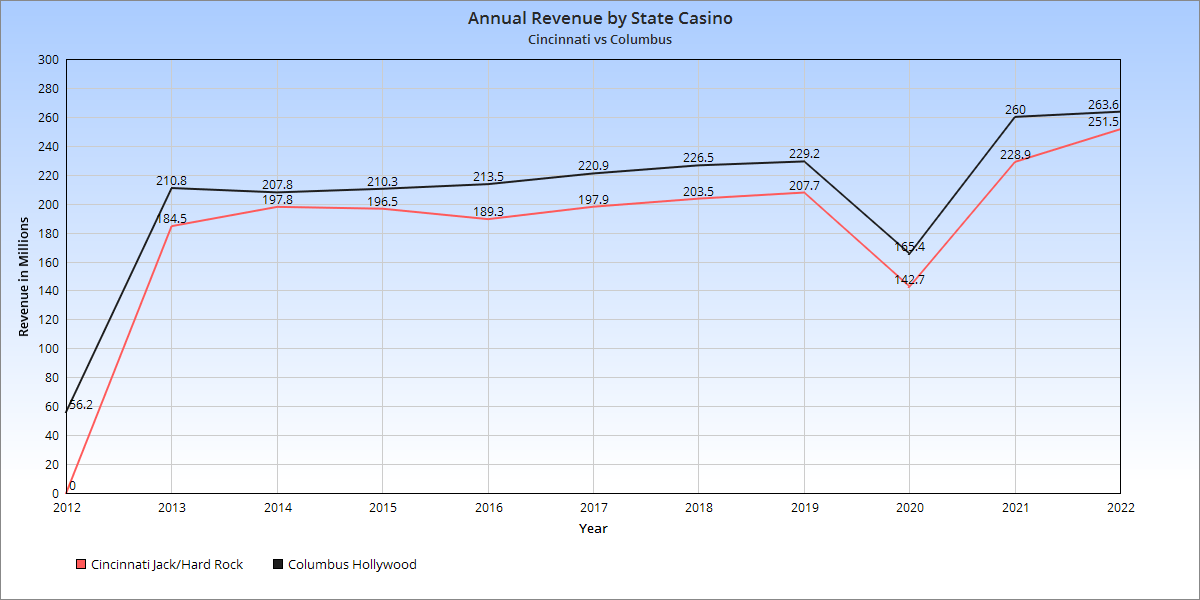
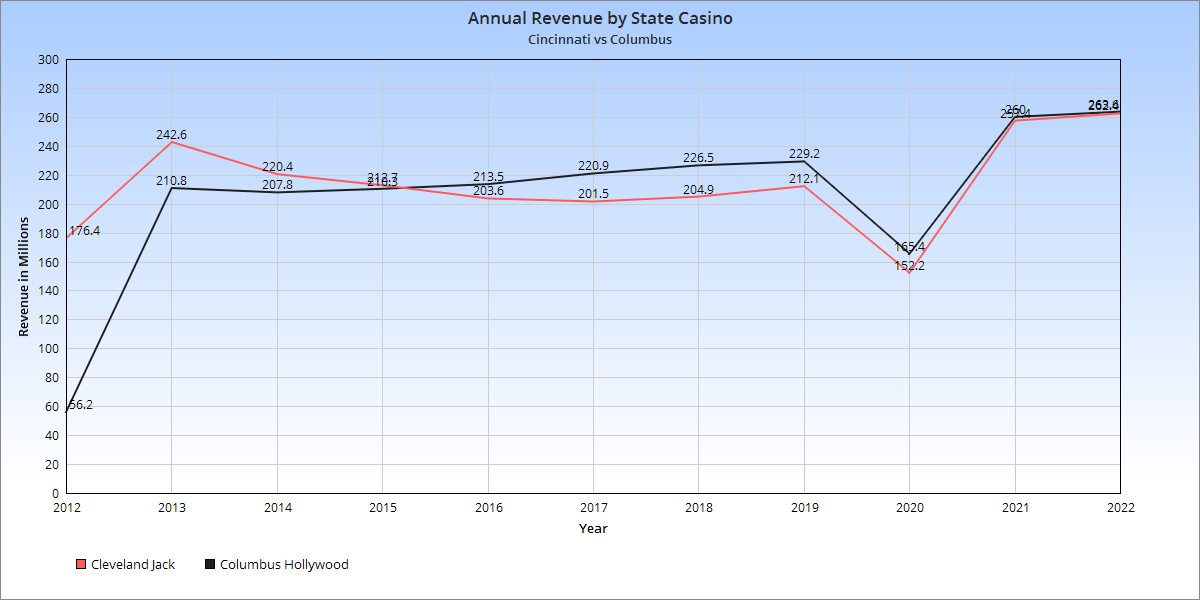
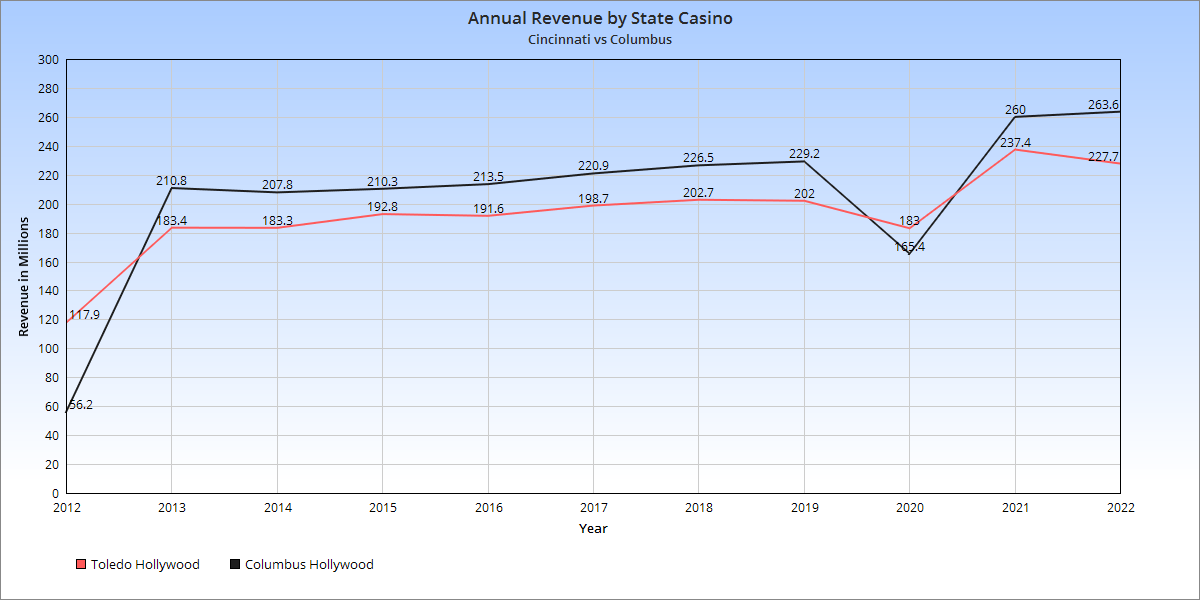
All the casinos saw a 2020 drop as they were closed for 2 months and had hour restrictions into early 2021 due to the pandemic. Curiously, though, all of the casinos saw a huge increase in revenue over where they were in 2019. I’m not sure if that’s a good thing.