Around Columbus and Franklin County, tax incentives and abatements are granted to properties either for new development or to encourage improvements to existing buildings. Most of these incentives are given to properties in urban neighborhoods that have suffered from a lack of investment. However, in recent years, studies have shown that the distribution of them is both uneven and highly controversial, often going to rich developers in already well-established neighborhoods rather than those that need them the most. The link of the Columbus property tax abatement map provides both descriptions of the types of tax incentives used locally, as well as a map that shows what properties get what incentives and how much they amount to.
In addition to abatements and incentives, TIFs, or Tax Increment Financing, uses targeted tax collection in specific areas to make improvements within said districts. Unlike tax abatements/incentives, TIFs can be found almost anywhere, and are regularly used in both suburban and urban neighborhoods, and are not always tied to improving declined areas.
It’s hard to imagine Columbus without its flagship university. While today Ohio State is one of the nation’s largest universities and a powerful influence in and out of Columbus in many ways, it got its start as just a humble agricultural college in 1870. Let’s go back to a time and look at these Ohio State campus aerials from 1919, and compare them to the same views today.
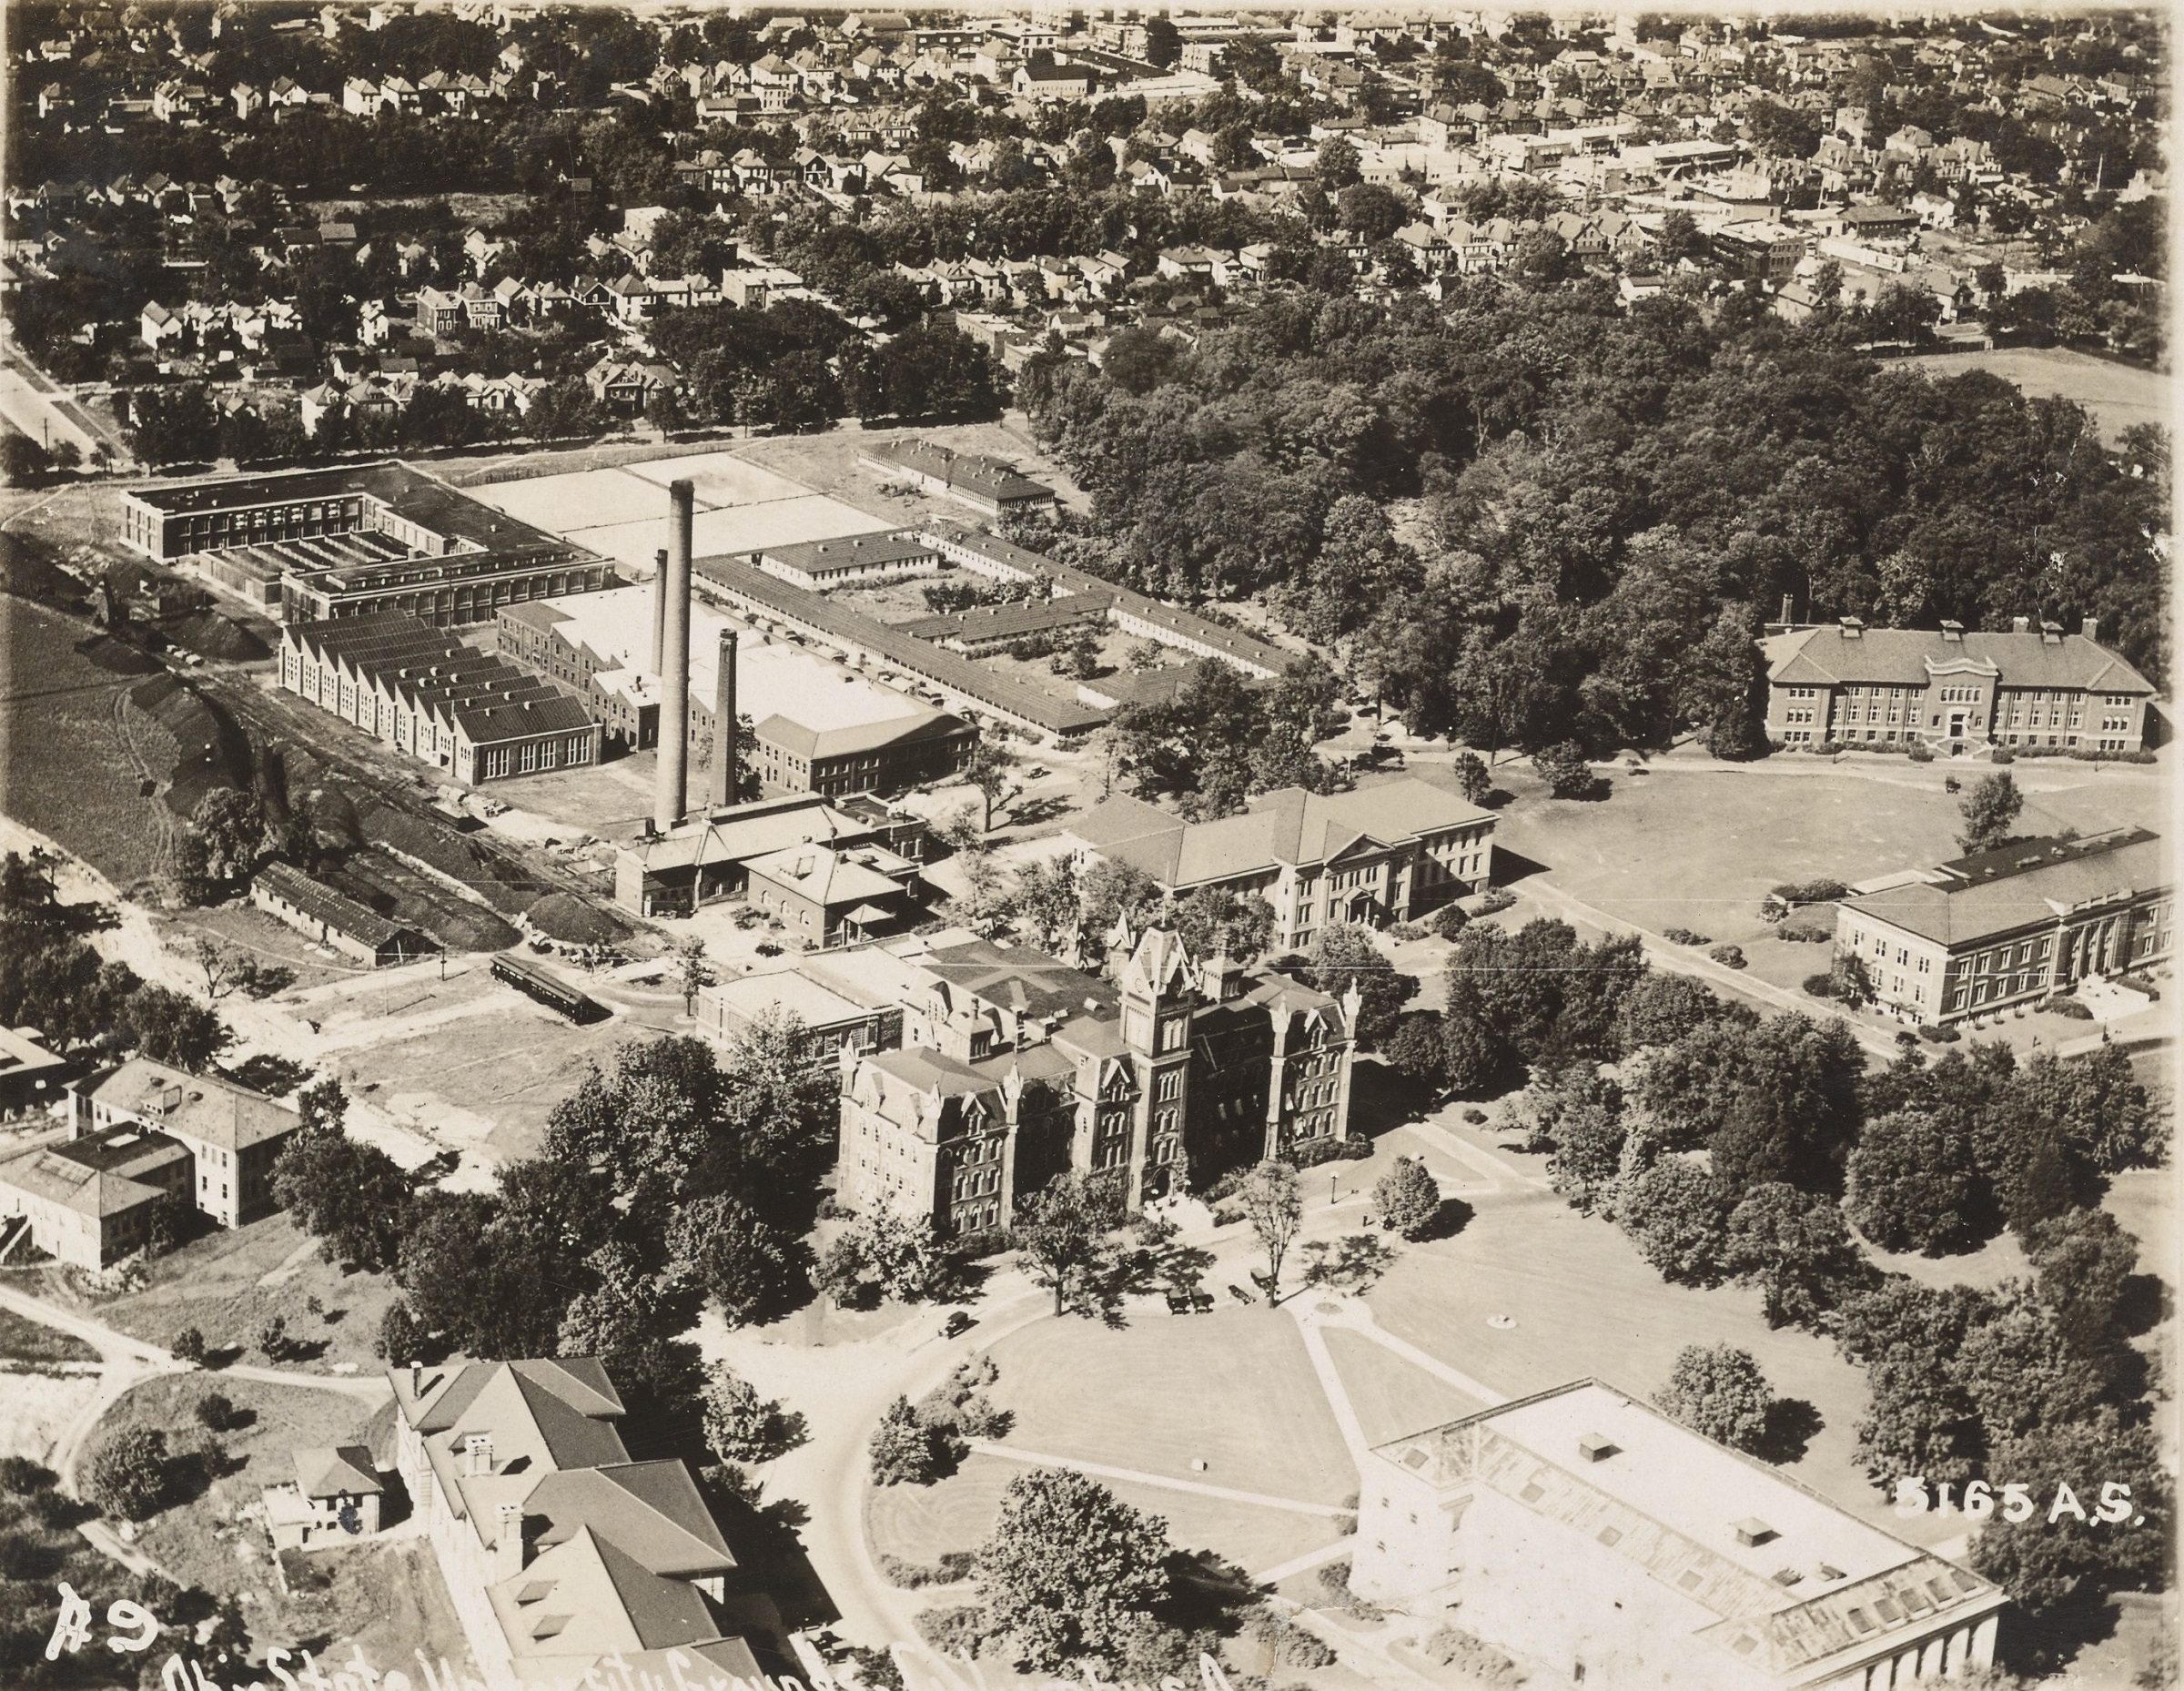
Before
Photo taken in 1919.
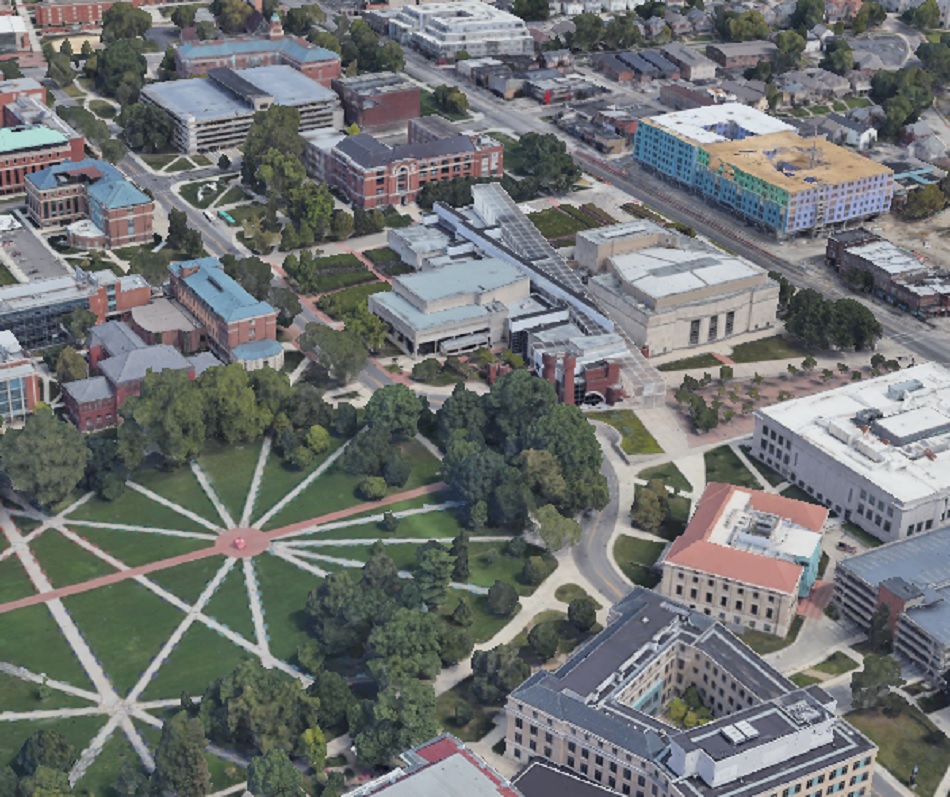
This 1919 photo of the Oval and the surrounding neighborhood shows just how small the campus was back then. Residential areas began just to the north of of the Oval. Over the years, almost every single building in this photo would be demolished in OSU’s never-ending quest to expand and modernize. After
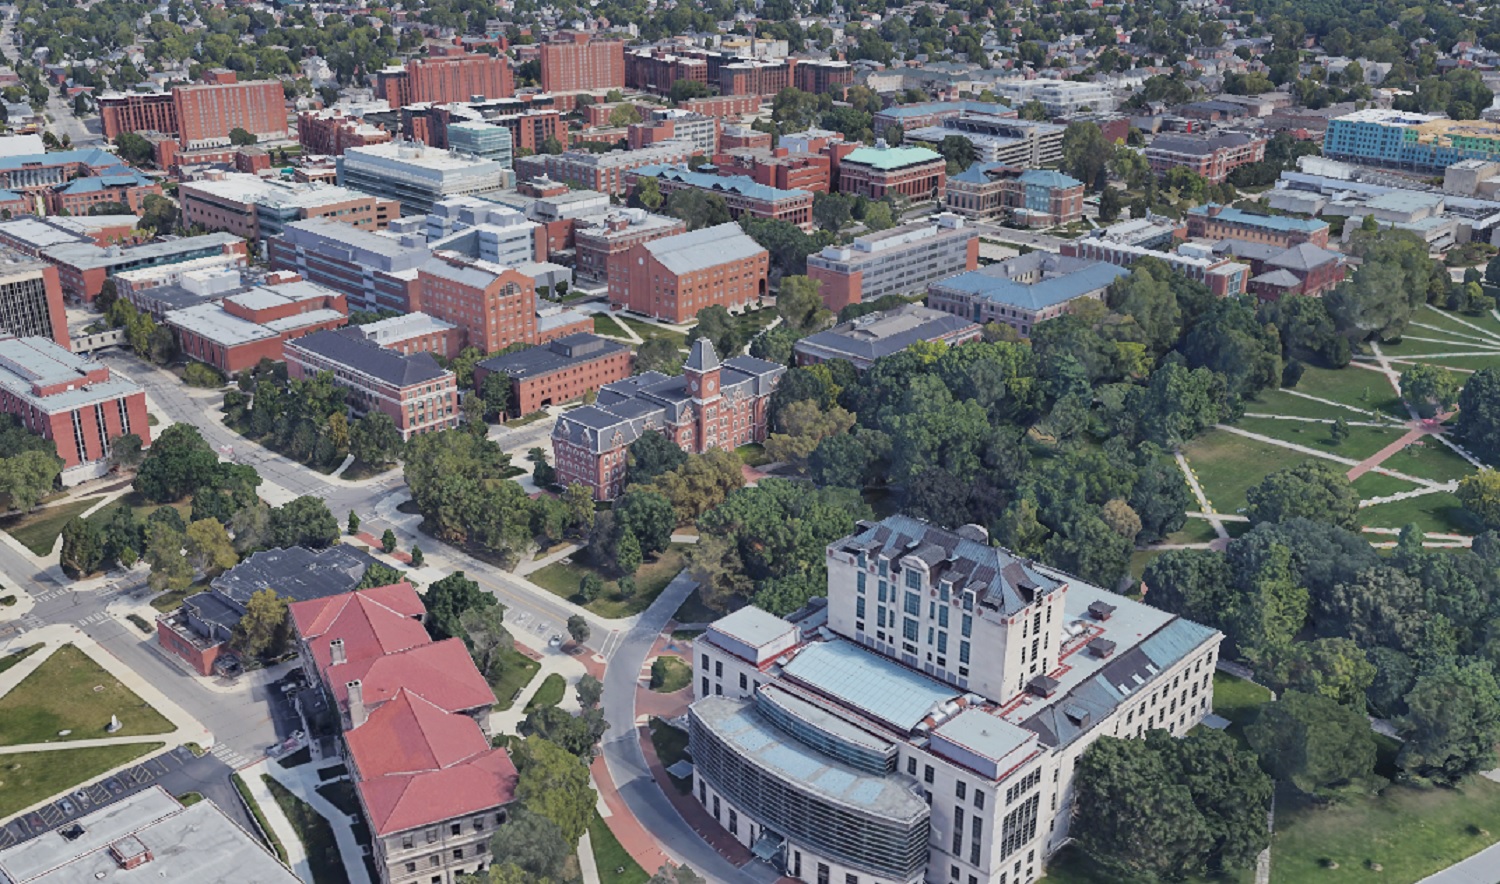
Photo taken in 2019.
The residential neighborhood is long gone, replaced with new student residences, offices and educational buildings. Almost nothing remains the same- even the street grid itself has been dramatically altered. Before
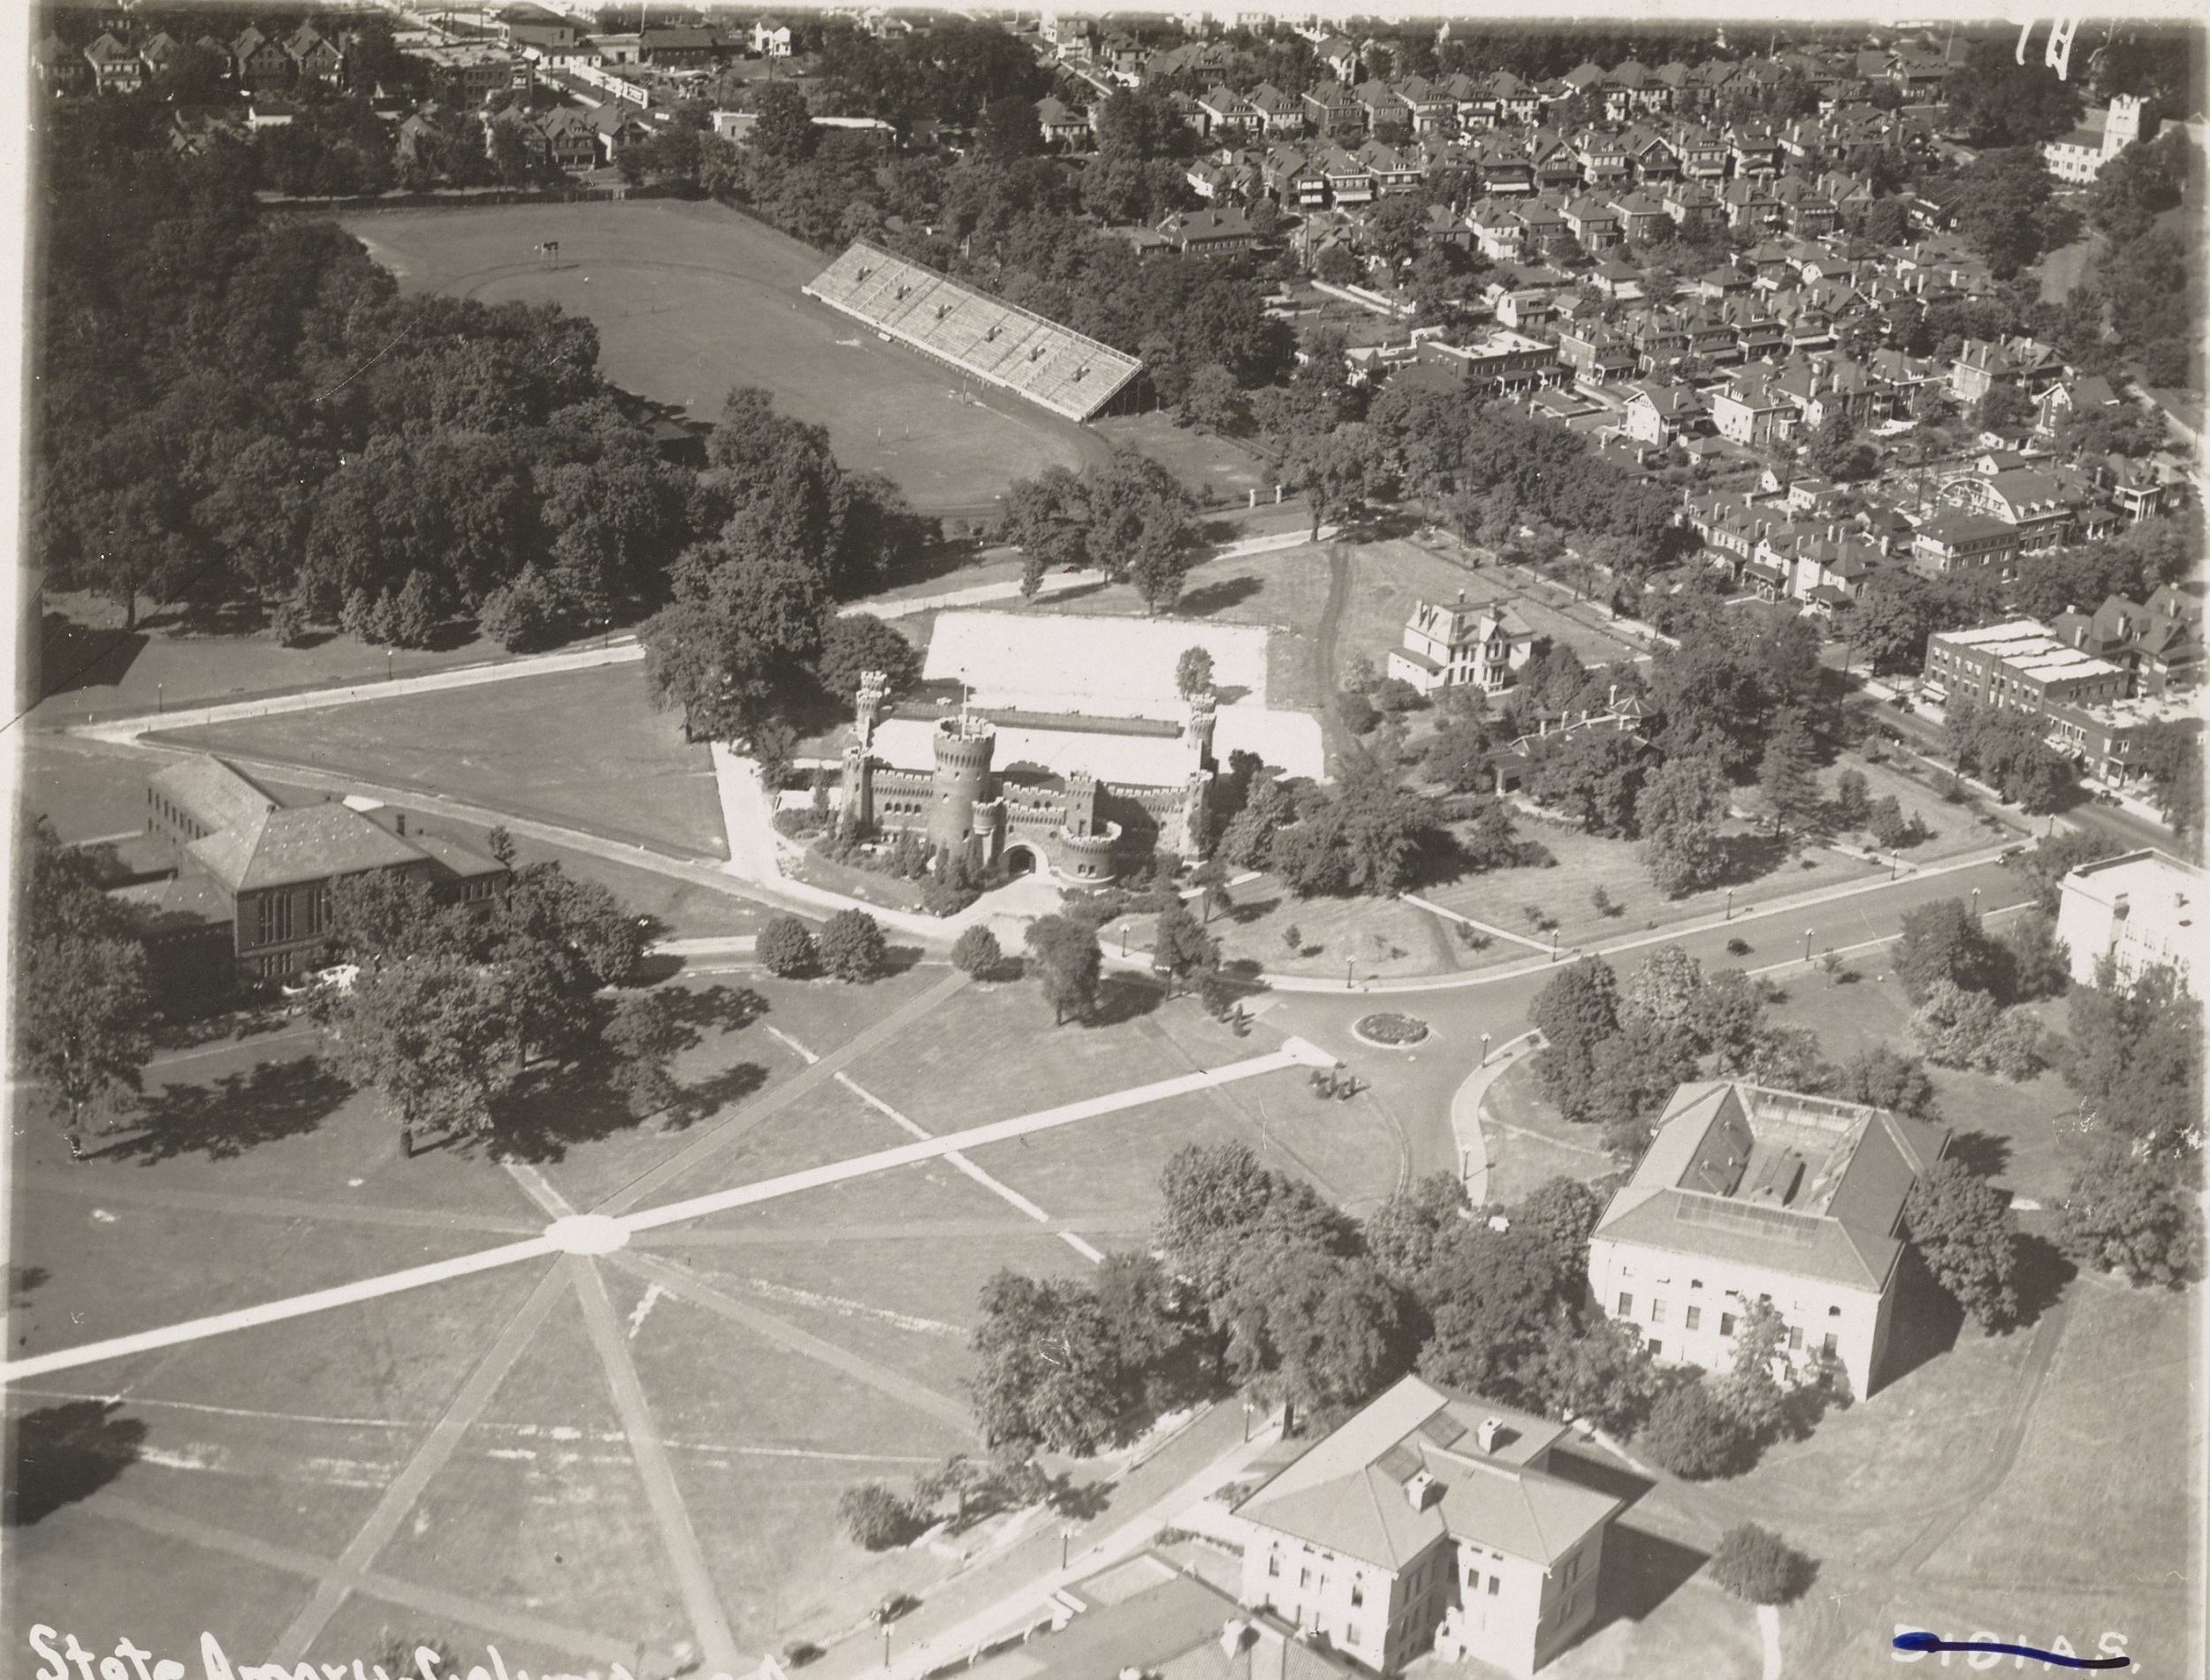
Photo taken in 1919.
This photo of Campus further east show the famous castle-looking Armory, along with an athletic field and part of High Street. After Some buildings remain recognizable, but not many. The athletic field disappeared by the 1930s, and the Armory burned down in disastrous fire in the early 1950s. It iconic castle towers were recreated somewhat in the Wexner Center for the Arts, which occupies the former Armory location.
Clearly, Ohio State’s campus has changed drastically over the last century. No doubt a century from now, it will be equally as unrecognizable to us as the current iteration would be to students from long ago.
The local housing market update May 2021 is finally out, and the trends continue to show a strong sellers market. Prices continued to accelerate upward and supply continued to lag way behind, pushing home sales to occur even faster than they have been in recent months.
Note: LSD= Local School District, CSD= City School District. In both cases, school district boundaries differ from city boundaries.
Top 15 Most Expensive Locations By Median Sales Price in May 2021 1. New Albany: $810,000 2. German Village: $630,000 3. New Albany Plain LSD: $570,000 4. Dublin: $528,750 5. Bexley: $497,500 6. Upper Arlington CSD: $495,000 7. Worthington: $461,420 8. Powell: $460,000 9. Dublin CSD: $450,000 10. Olentangy LSD: $445,000 11. Buckeye Valley LSD: $406,790 12. Granville CSD: $402,500 13. Short North: $400,450 14. Grandview Heights: $394,000 15. Jonathan Alder LSD: $390,000
New Albany proper posted an astronomical median price in May, reaching unprecedented numbers for a Columbus suburb.
Top 15 Least Expensive Locations by Median Sales Price in May 2021 1. Whitehall: $138,000 2. Valleyview: $157,500 3. Groveport Madison LSD: $175,825 4. Lancaster CSD: $176,000 5. Circleville CSD: $182,000 6. Newark CSD: $184,250 7. Jefferson LSD: $207,500 8. Columbus CSD: $220,000 9. London CSD: $225,000 10. Hamilton LSD: $237,000 11. Columbus: $240,000 12. Reynoldsburg CSD: $245,500 13. South-Western CSD: $249,900 14. Canal Winchester CSD: $260,000 15. Teays Valley LSD: $268,894
In general, the further out the place from Columbus, the cheaper the location, but there are some exceptions. Whitehall and Columbus proper remain relatively affordable compared to most locations in the metro.
Overall Market Median Sales Price in May 2021: $227,088 The overall market is defined by Columbus Metro Area counties.
Top 15 Locations with the Highest Median Sales Price % Growth Between May 2020 and May 2021 1. German Village: +59.5% 2. Worthington: +54.6% 3. Obetz: +52.2% 4. New Albany Plain LSD: +40.7% 5. Hamilton LSD: +39.4% 6. Dublin CSD: +32.0% 7. Delaware CSD: +32.0% 8. Dublin: +31.4% 9. Pickerington: +30.3% 10. New Albany: +29.7% 11. Newark CSD: +29.4% 12. Worthington CSD: +29.1% 13. Westerville CSd: +28.6% 14. Pataskala: +27.0% 15. Jonathan Alder LSD: +25.8%
Top 15 Locations with the Lowest Median Sales Price % Growth Between May 2020 and May 2021 1. Lancaster CSD: -7.3% 2. Jefferson LSD: -5.5% 3. Downtown Columbus: -4.2% 4. Hilliard: -0.5% 5. Teays Valley LSD: +3.5% 6. Powell: +5.1% 7. Big Walnut LSD: +6.2% 8. Grandview Heights: +6.8% 9. Granville CSD: +7.6% 10. Short North: +7.6% 11. Canal Winchester CSD: +8.3% 12. Minerva Park: +8.4% 13. London CSD: +10.3% 14. Circleville CSD: +11.3% 15. Buckeye Valley LSD: +11.4%
There were fewer locations down year-over-year in May than in previous months, though urban areas generally saw lower increases.
Overall Market Median Sales Price % Change May 2021 vs. May 2020: +18.6%
Top 10 Locations with the Most New Listings in May 2021 1. Columbus: 1,467 2. Columbus CSD: 972 3. South-Western CSD: 217 4. Hilliard CSD: 171 5. Westerville CSD: 168 6. Olentangy LSD: 166 7. Dublin CSD: 166 8. Worthington CSD: 118 9. Pickerington LSD: 115 10. Upper Arlington CSD: 101
Top 10 Locations with the Fewest New Listings in May 2021 1. Valleyview: 2 2. Lithopolis: 5 3. Minerva Park: 5 4. Jefferson LSD: 6 5. Obetz: 8 6. Sunbury: 8 7. Grandview Heights: 10 8. Johnstown-Monroe LSD: 11 9. Whitehall: 12 10. Circleville CSD: 14
Urban areas and major suburbs saw increases in supply versus previous months, but because sales were also stronger, it didn’t help with actual supply or prices.
Total New Listings in the Columbus Metro in May 2021: +3,468 Overall Metro New Listings % Change May 2021 vs May 2020: +14.3%
Top 10 Fastest-Selling Locations by # of Days Homes Remain on the Market Before Sale in May 2021 1. Jonathan Alder LSD: 3 2. Valleyview: 3 3. Canal Winchester CSD: 4 4. Groveport Madison LSD: 4 5. Lithopolis: 4 6. German Village: 5 7. Worthington: 5 8. Worthington CSD: 5 9. Beechwold/Clintonville: 6 10. Blacklick: 6 11. Gahanna: 6 12. Marysville CSD: 6 13. Pickerington LSD: 6 14. Powell: 6 15. Westerville CSD: 6 16. Whitehall: 6
Top 10 Slowest-Selling Locations by # of Days Homes Remain on the Market Before Sale in May 2021 1. Short North: 51 2. Downtown Columbus: 39 3. Johnstown-Monroe LSD: 28 4. Bexley: 25 5. Lancaster CSD: 25 6. Jefferson LSD: 23 7. Obetz: 22 8. Buckeye Valley LSD: 21 9. Dublin: 19 10. Olentangy LSD: 18
Top 10 Locations with the Greatest % Decline of # of Days on the Market Before Sale May 2021 vs May 2020 1. Powell: -91.2% 2. Jonathan Alder LSD: -90.6% 3. Minerva Park: -85.7% 4. Circleville CSD: -84.2% 5. Whitehall: -82.9% 6. London CSD: -80.0% 7. Sunbury: -78.9% 8. Newark CSD: -78.0% 9. Upper Arlington CSD: -76.5% 10. Granville CSD: -75.8%
Top 10 Locations with the Lowest % Decline of # of Days on the Market Before Sale May 2021 vs May 2020 1. Short North: +264.3% 2. Valleyview: +50.0% 3. Bexley: +13.6% 4. Downtown Columbus: +11.4% 5. Lancaster CSD: -3.8% 6. Teays Valley LSD: -11.1% 7. Dublin: -26.9% 8. Reynoldsburg CSD: -29.4% 9. Westerville: -33.3% 10. Pataskala: -38.5%
% Change for the # of Days Homes Remain on the Market Before Sale Across the Metro Overall: 14
The market’s sales pace only increased further in May, with the entire metro’s supply of homes selling in an average of just 2 weeks. Many locations were selling at far faster rates, however.
A handy link is the Columbus Realtors website, which most of this data is derived from.
Aerial photos have been around for more than a century, ever since someone thought to take photos from airplanes. These photos go back to at least the 1910s, when the airplane was still very much a new technology. I thought it might be interesting to do show a few of these before and after Downtown aerial photos to give an idea of how the same areas look today.
Before
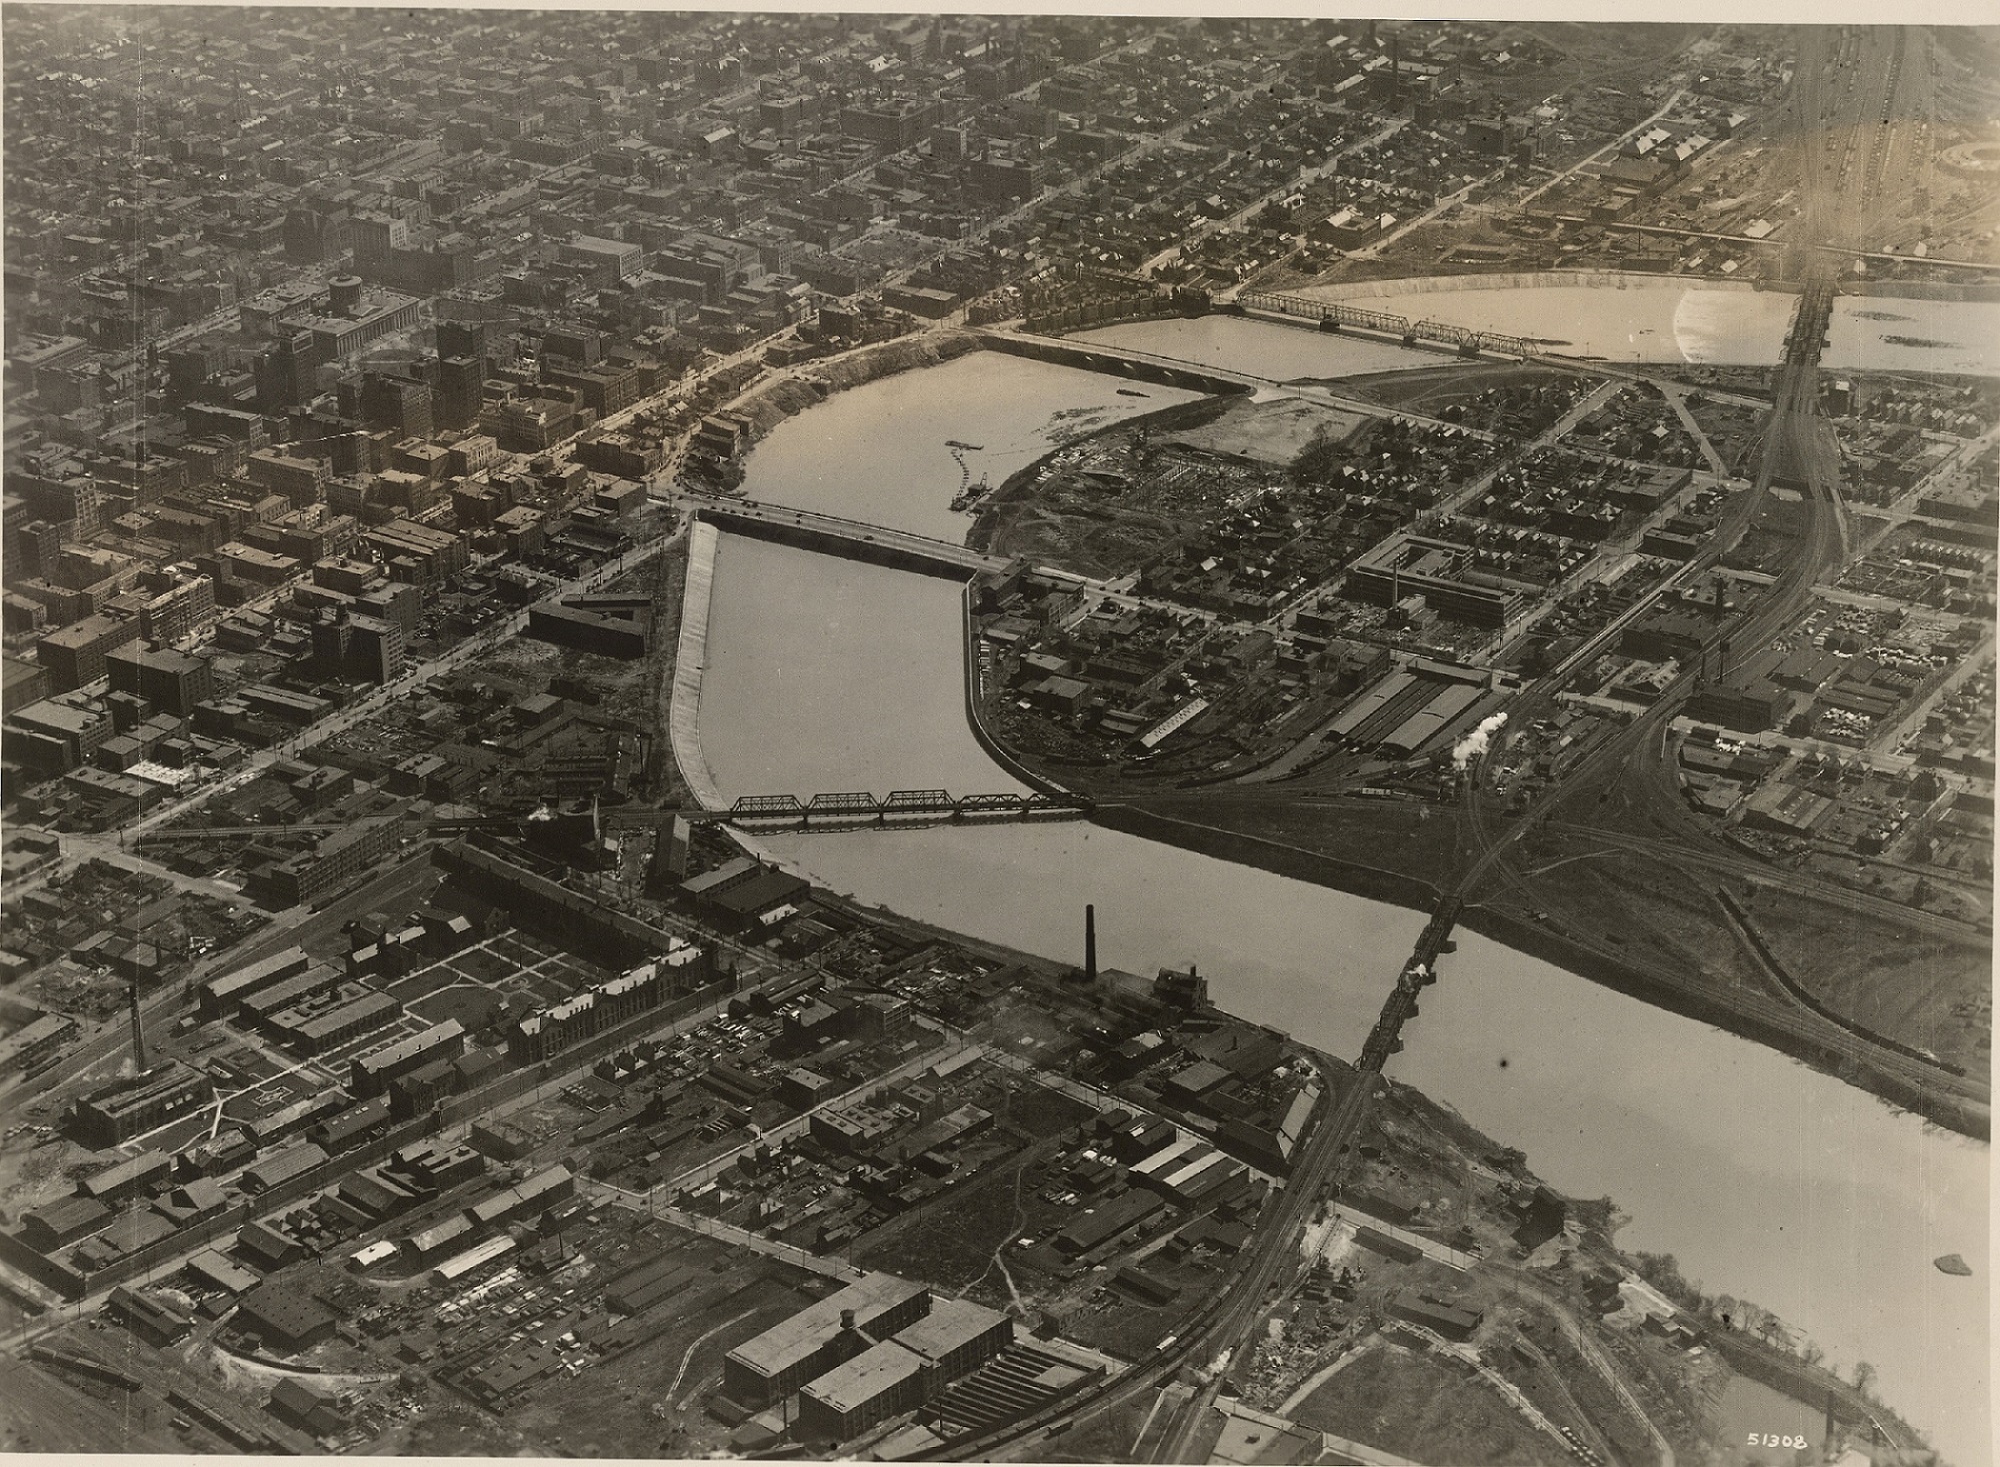
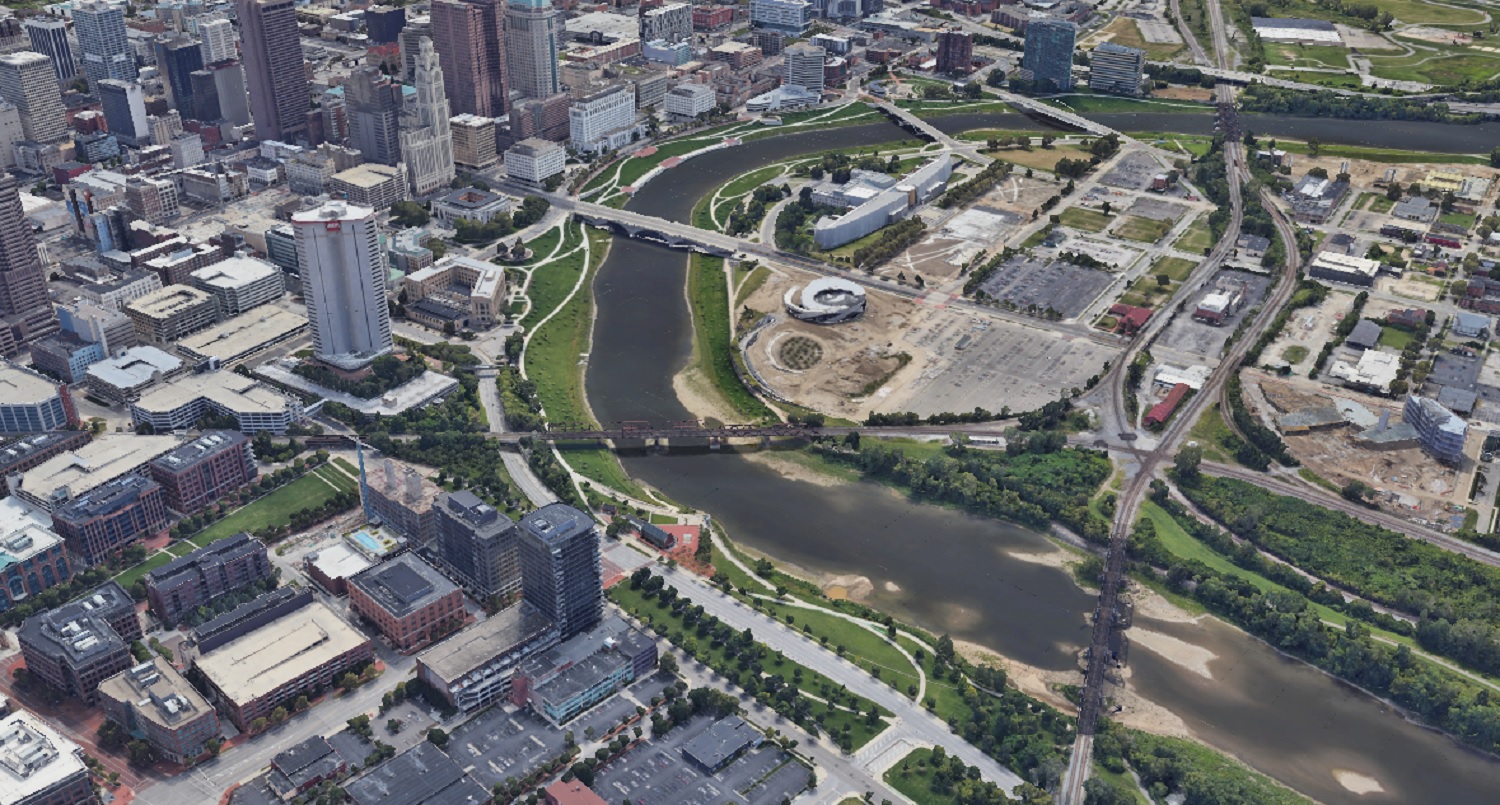
Downtown around 1923.
This photo of Downtown was likely taken sometime between 1922 and 1923. The main clue is that the old Central High School is clearly under construction on the Scioto Peninsula, but seemingly in the early phases. The school would later open in the fall of 1924. Also in the photo is the new Scioto River floodwall under construction just a decade after the Great Flood of 1913. The buildings near and along the riverfront would eventually be demolished for this project, as well as the eventual Civic Center project that would later build the Post Office and Ohio Supreme Court building. Notice as well the lack of Columbus’ signature building- LeVeque Tower. That project would be constructed over the next few years. After
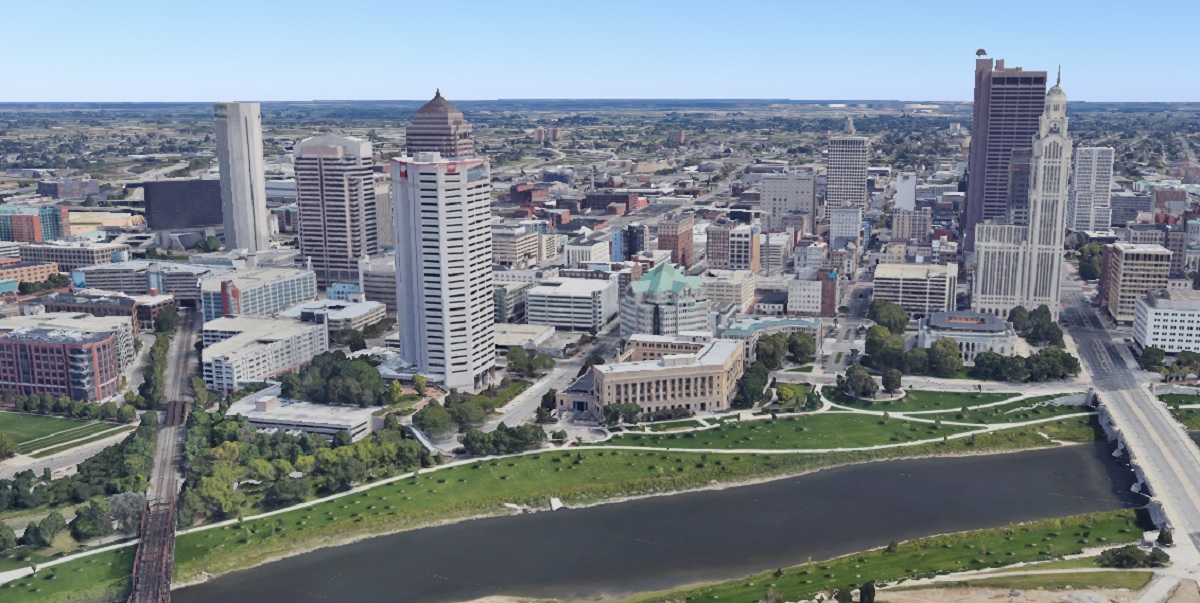
Downtown in 2019.
Downtown has obviously changed enormously in the past century. Skyscrapers now dominate Downtown, and the highway system now cuts through many neighborhoods. The riverfront itself is also significantly nicer and less industrial looking. Before
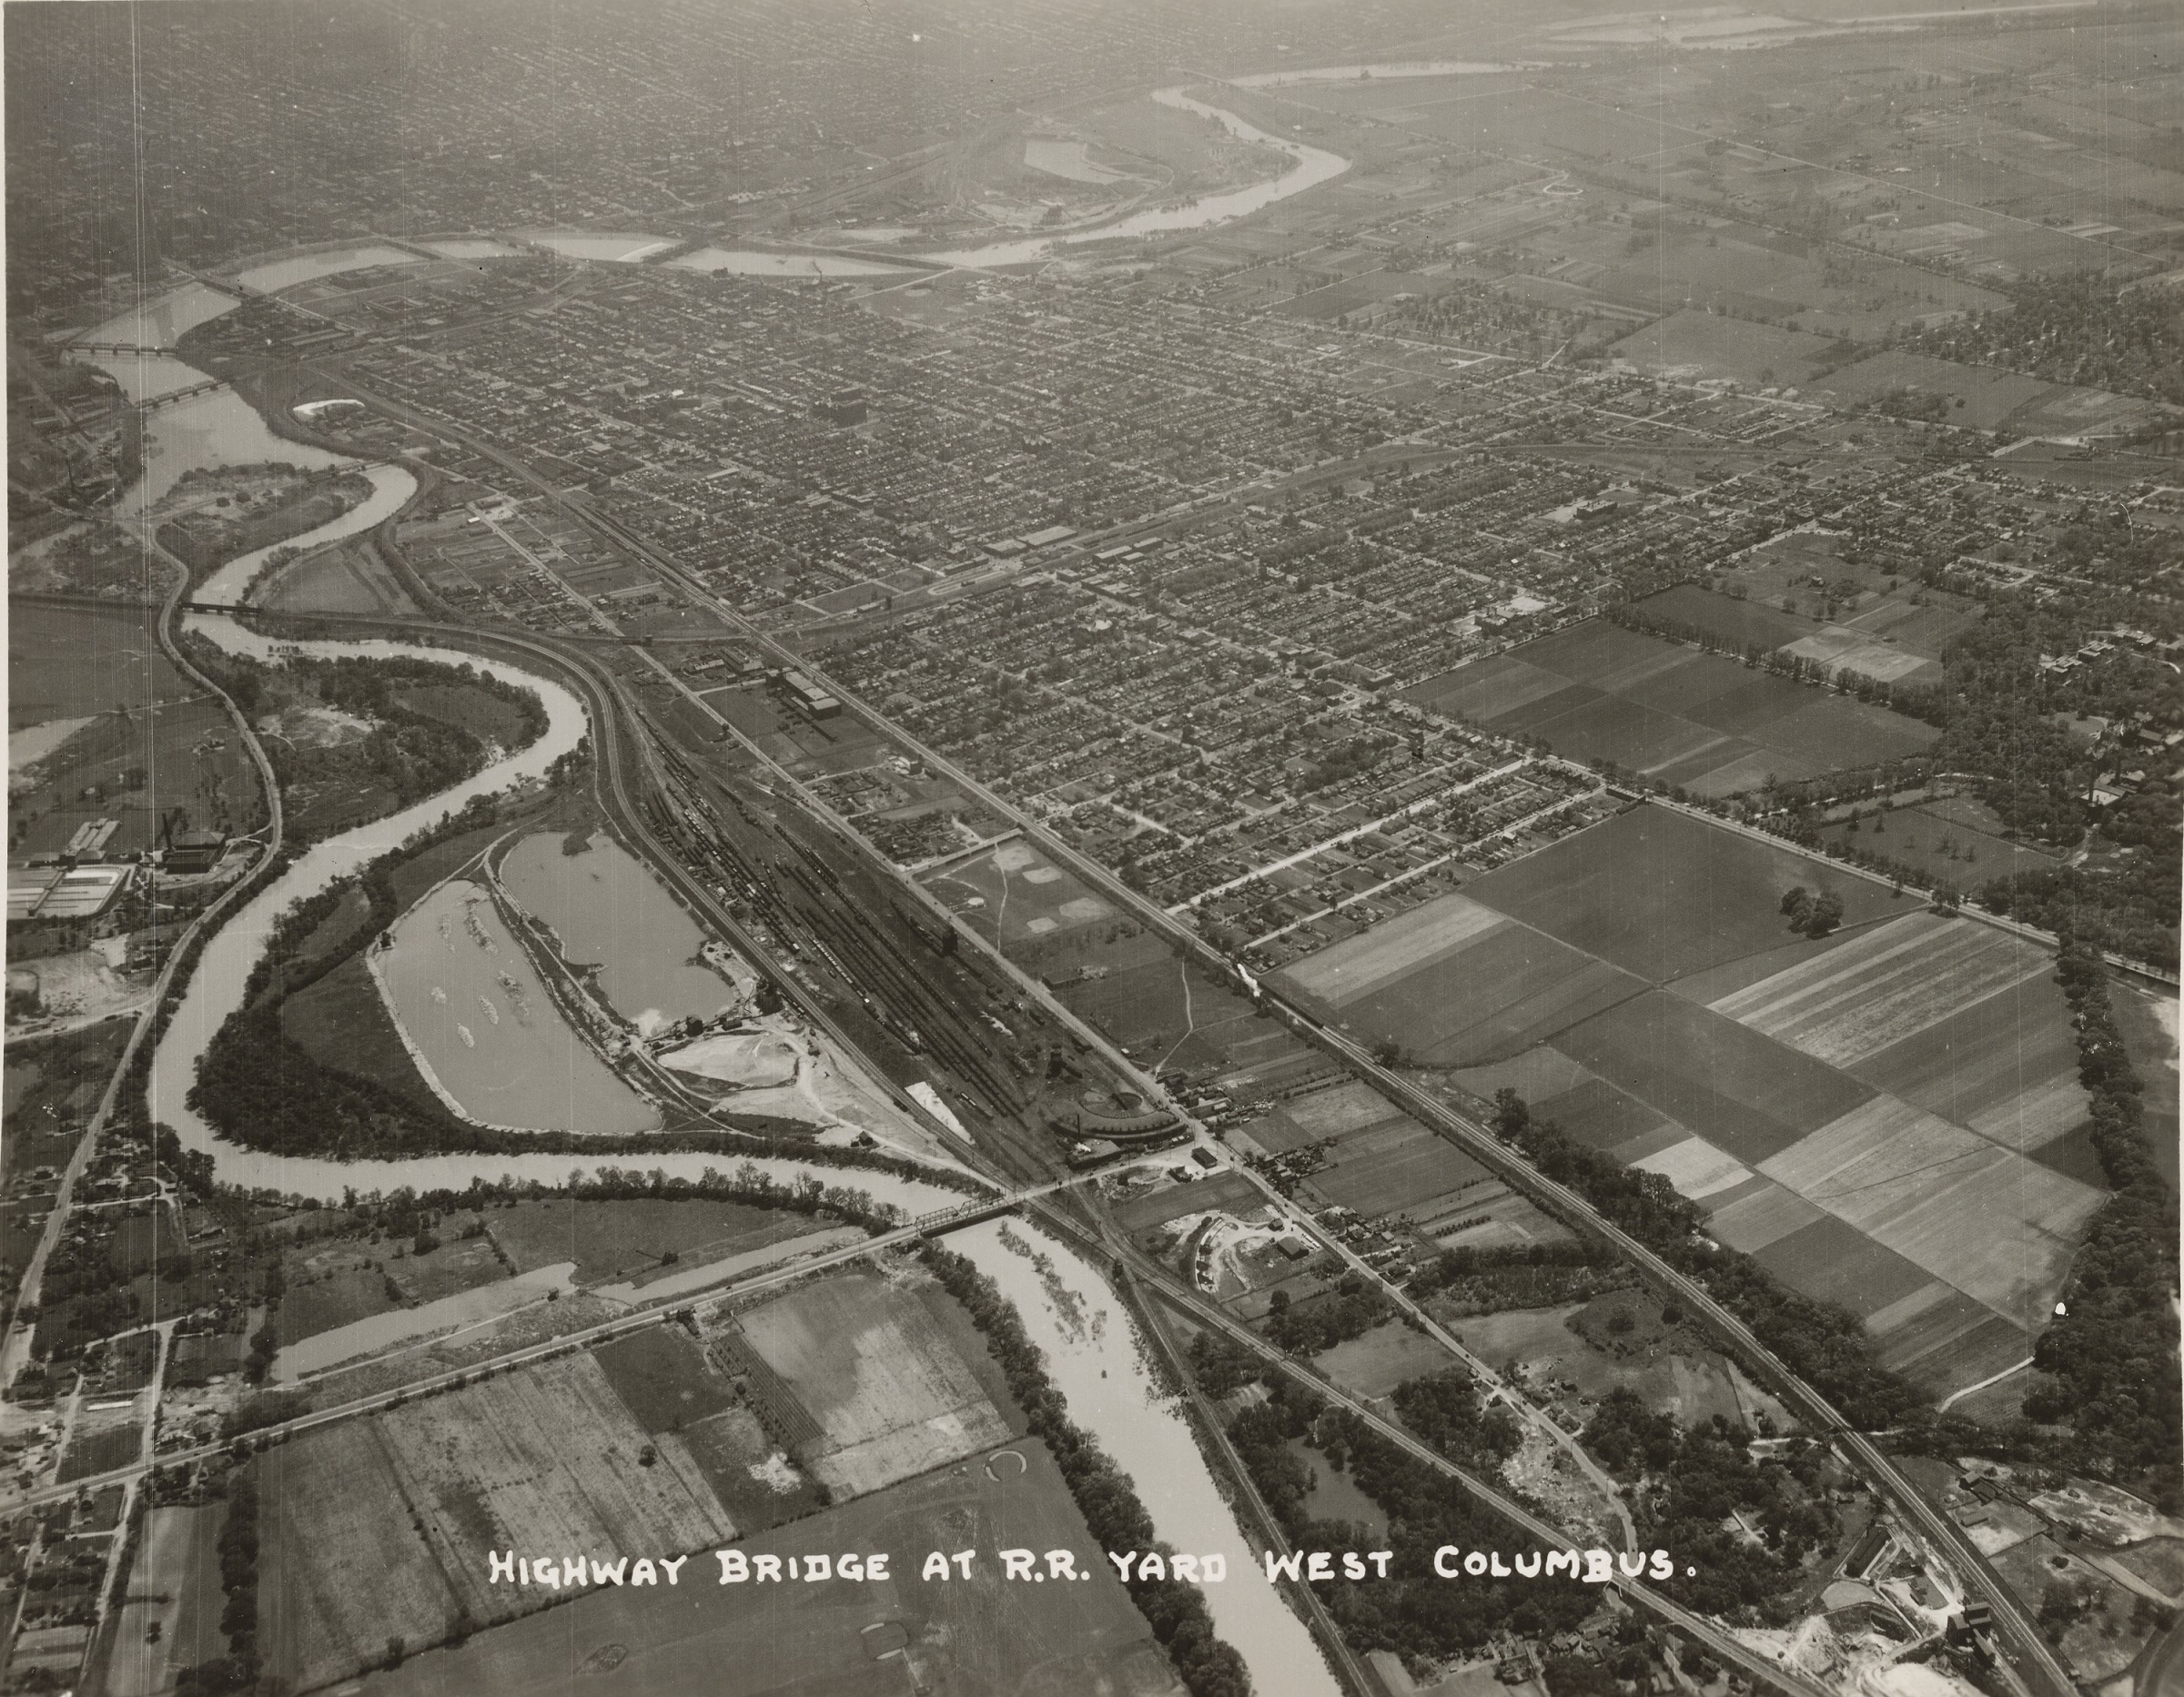
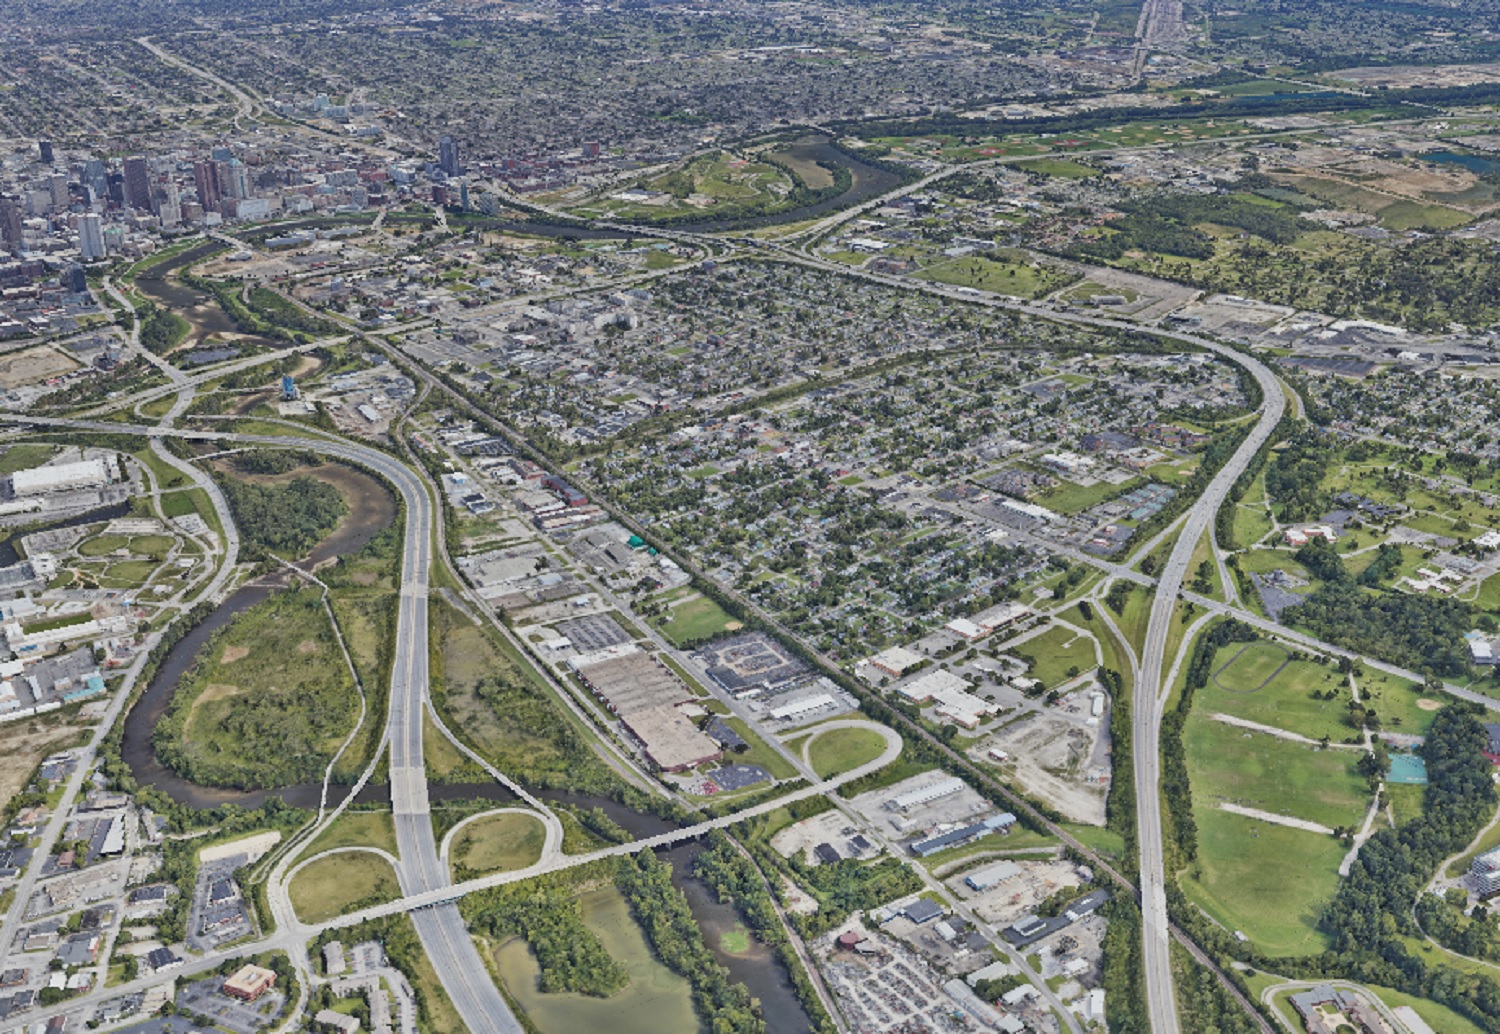
Photo taken in 1929.
This 1929 photo looks west over Franklinton towards Downtown. The most revealing part of this photo is how compact the developed area of Columbus really was at the time. Farm fields can be seen to the south and west of Columbus. After
Photo taken in 2019.
In the after photo, nearly all the vacant land is gone except for park space, Greenlawn Cemetery and areas along the rivers.
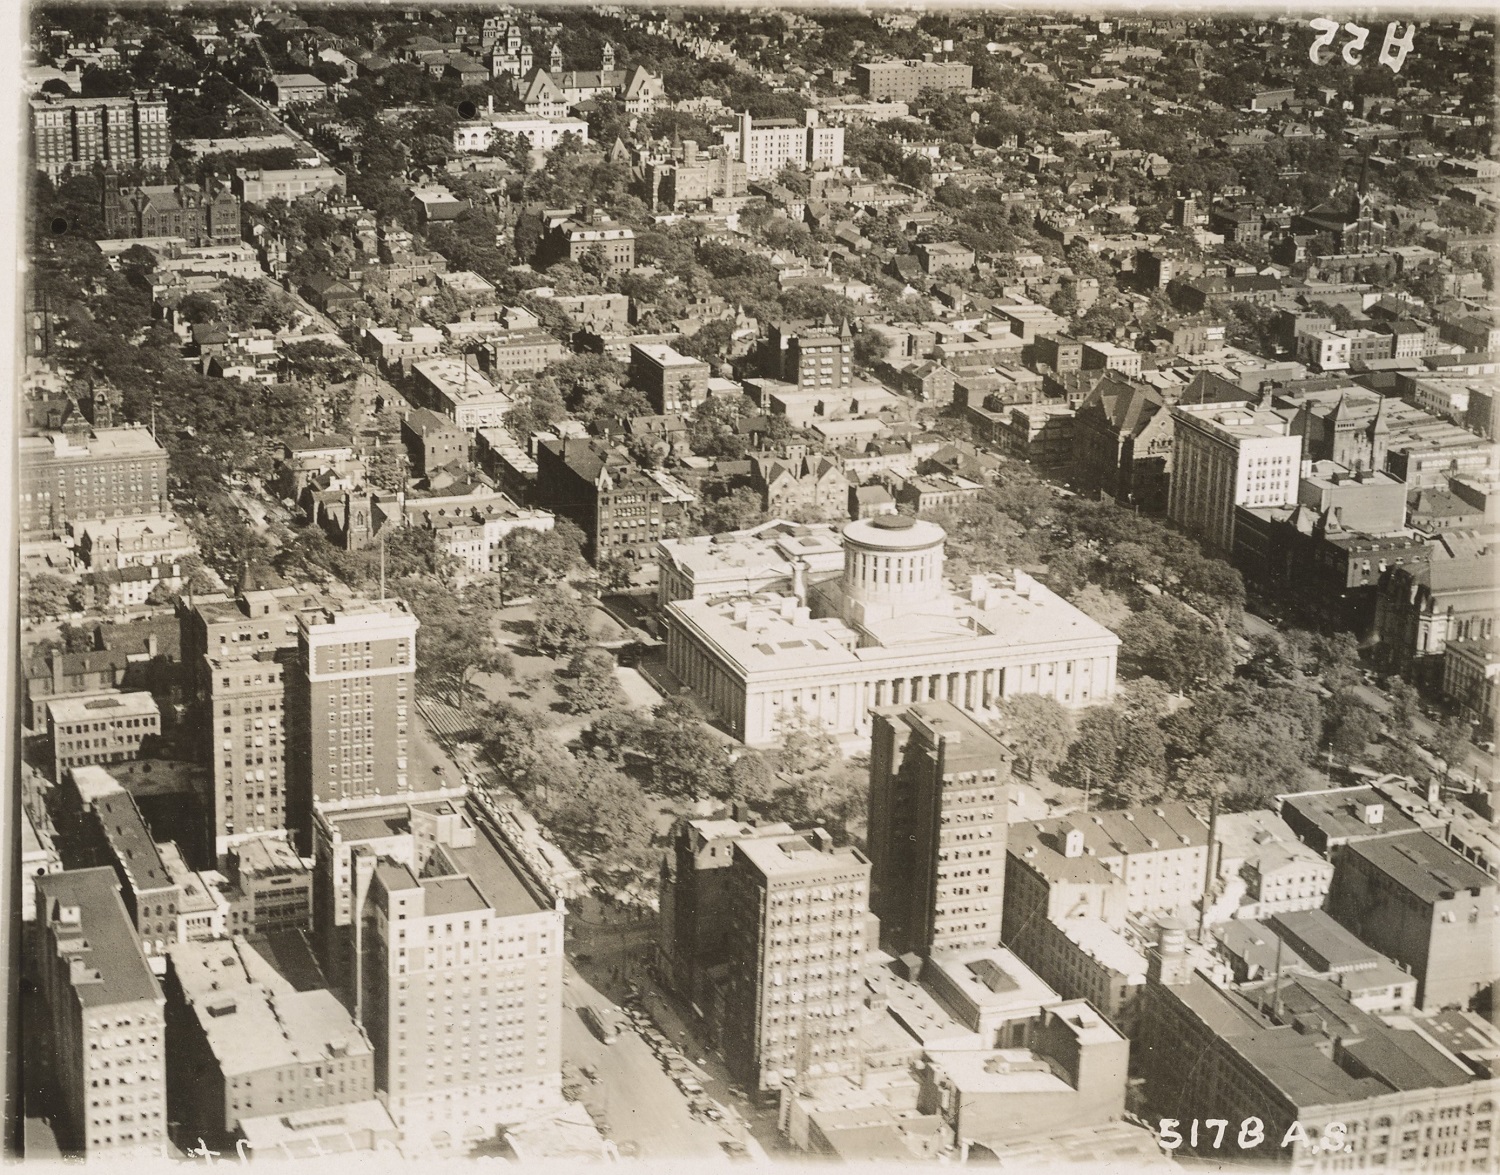
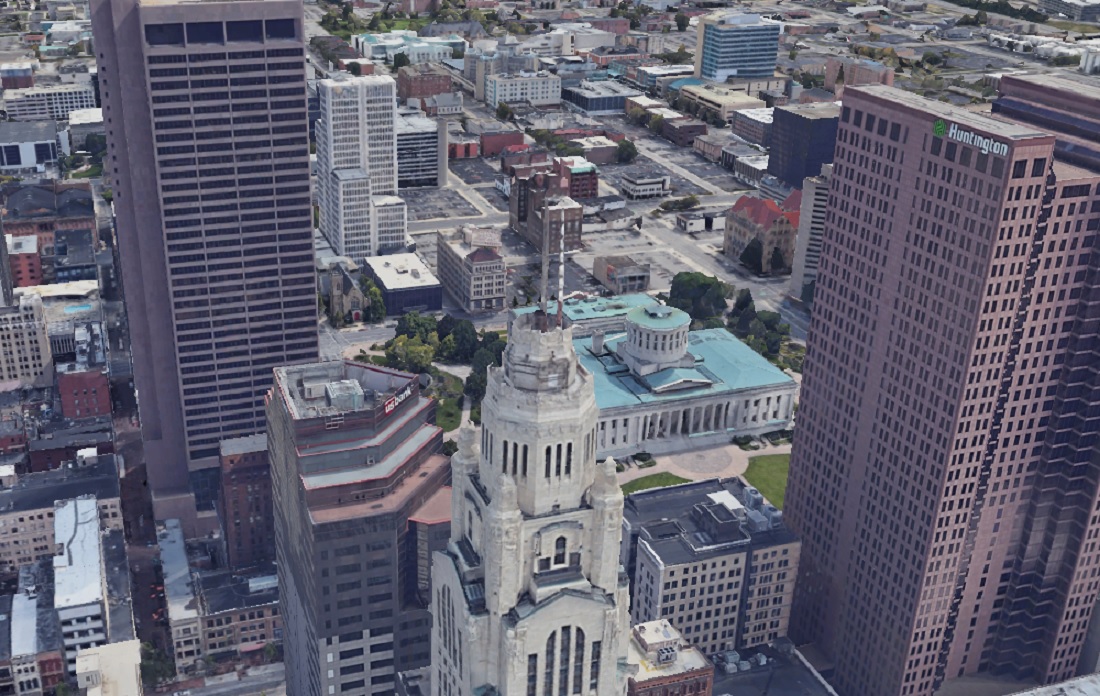
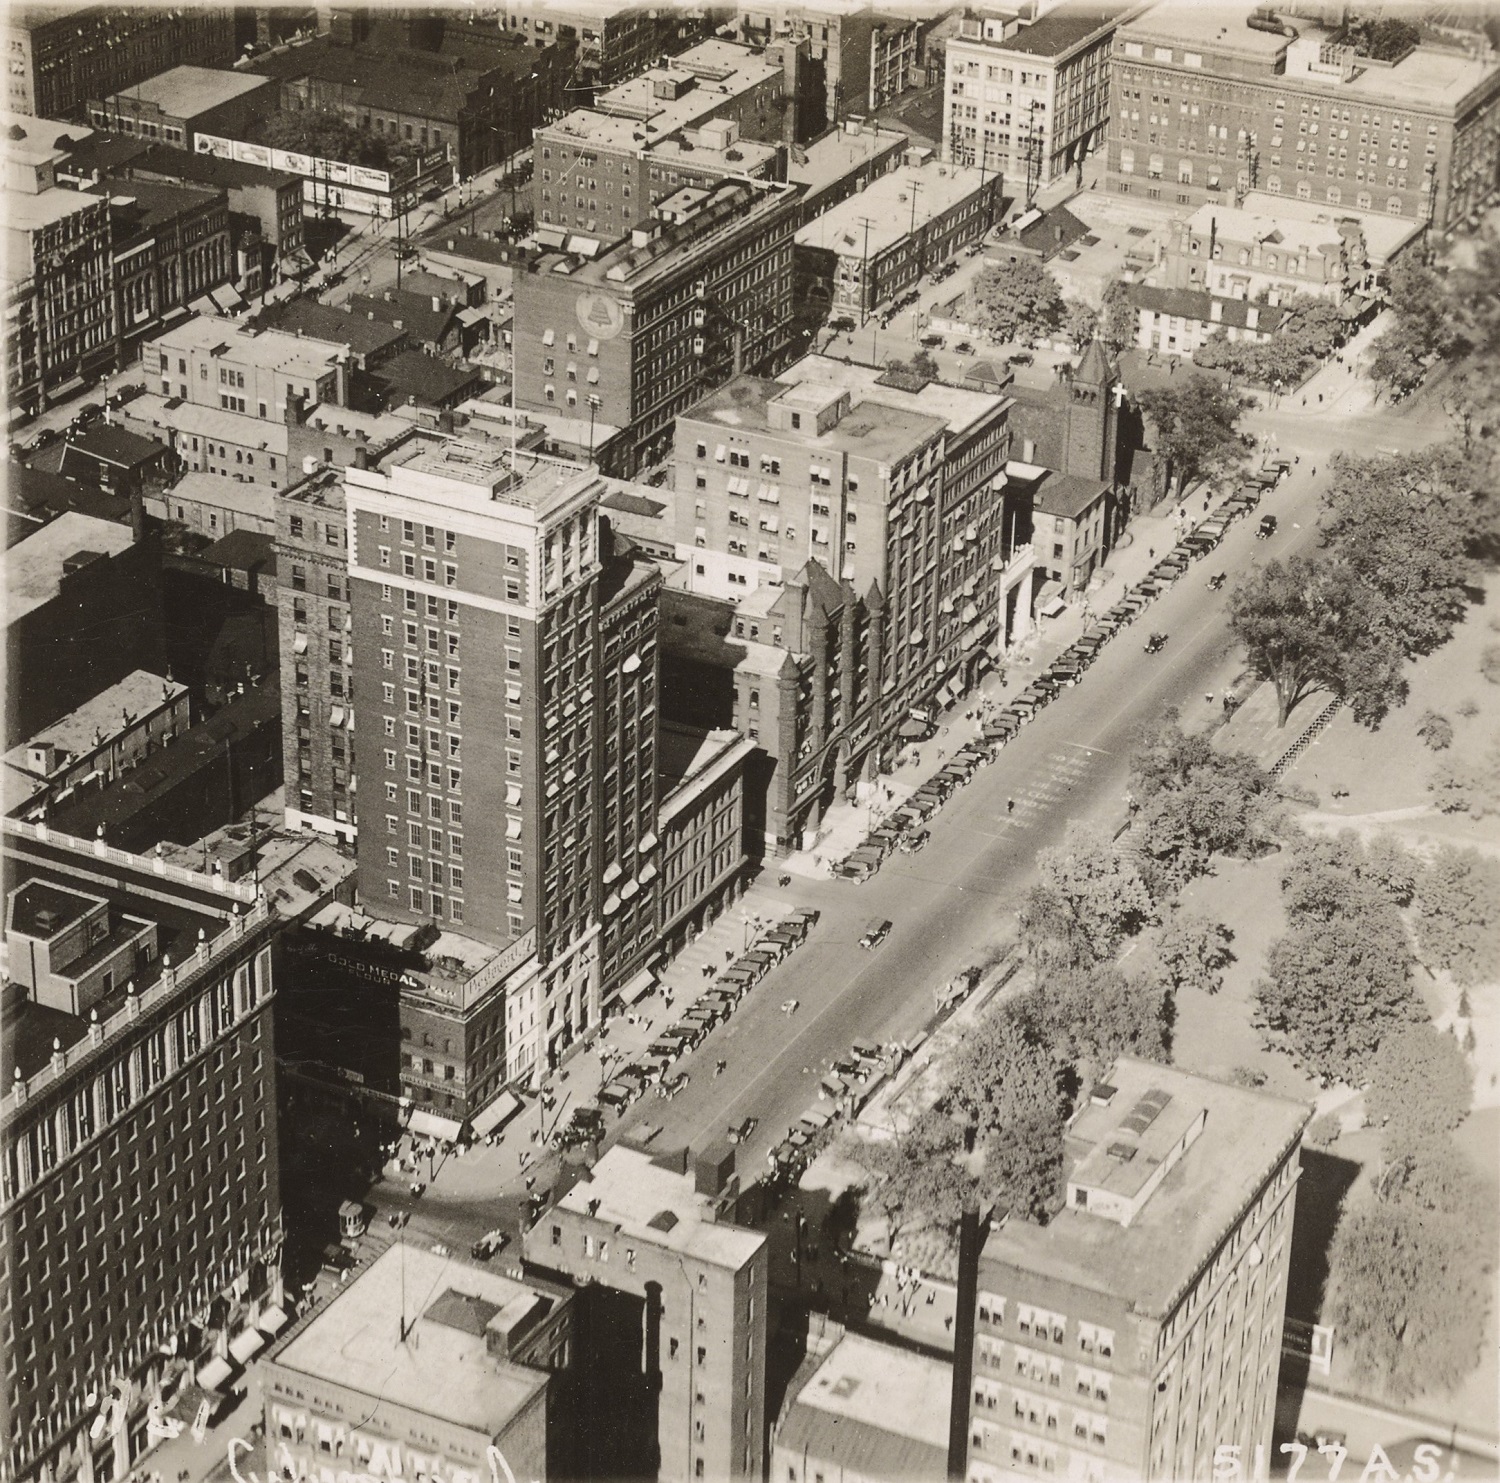
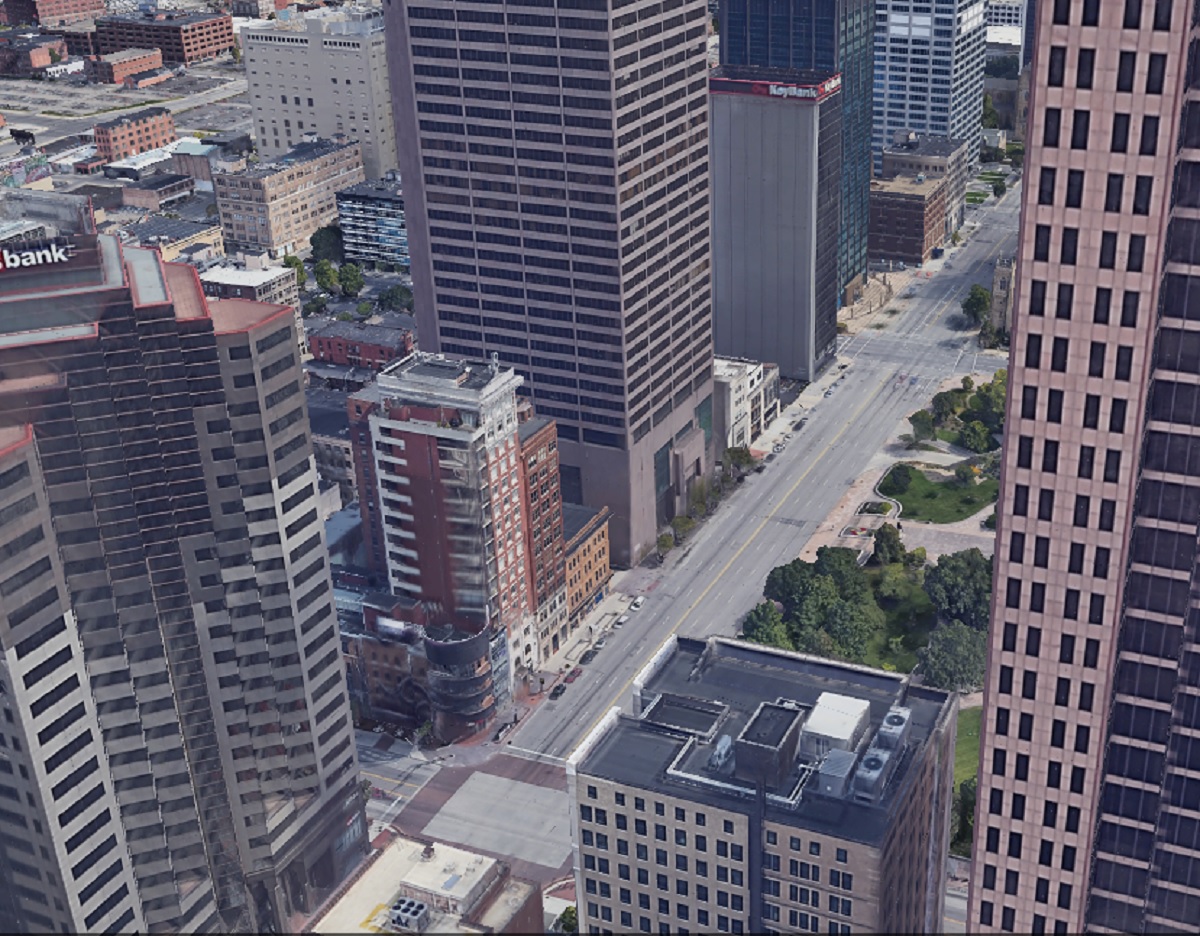
Before This photo of Capitol Square in 1919 is one of the earliest aerials of Downtown I was able to find. This photo predates all highrise construction. The city was compact, dense and dominated by brick buildings. After In the 2019 image, skyscrapers have now replaced many of the older buildings. While the Capitol itself a handful of other buildings remain, the density has largely been lost over the years, with parking lots where many once stood. Before The 1919 image shows the intersection of High and Broad Streets, arguably the very center of Columbus. After Aside from the 8 on the Square building, virtually everything else from 1919 is long gone.
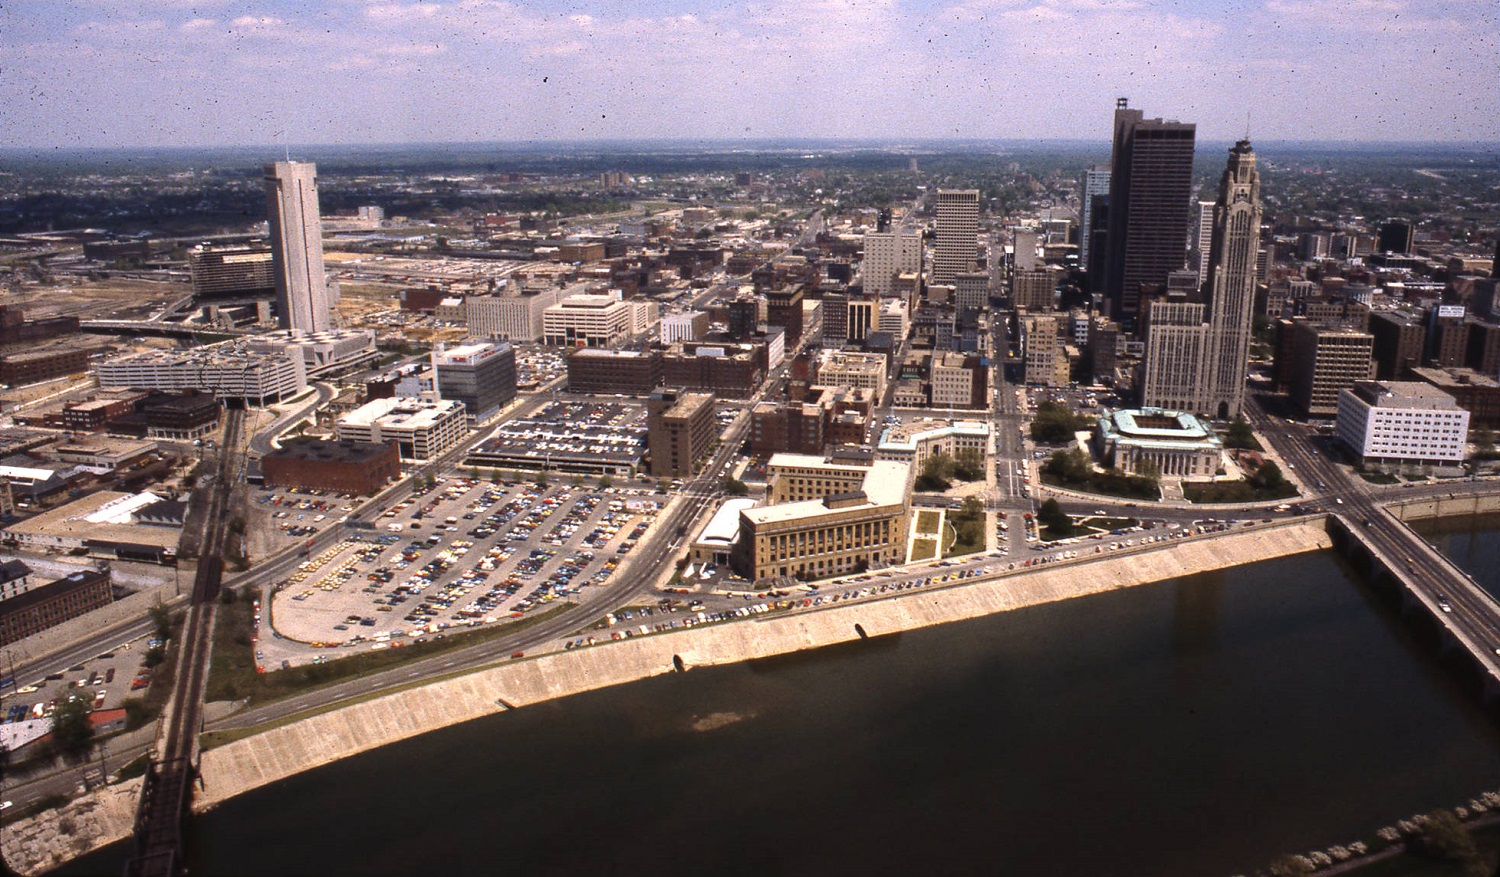
Before This much more modern image of Downtown and the riverfront was taken in 1980. After The 2019 Google Earth image from the same angle shows significant changes in 40 years. New skyscrapers and other development are obvious, but the massive changes to the riverfront itself almost make this look like a different city altogether.
What might these areas look like in another century?
The monthly housing market update April 2021 has been released from Columbus Realtors. The results continue ongoing trends of rising prices and low supply.
Note: LSD= Local School District, CSD= City School District. In both cases, school district boundaries differ from city boundaries.
Top 15 Most Expensive Locations By Median Sales Price in April 2021 1. New Albany: $677,500 2. German Village: $570,000 3. Bexley: $527,500 4. Dublin: $514,000 5. Powell: $500,000 6. Grandview Heights: $486,000 7. New Albany Plain LSD: $469,393 8. Upper Arlington CSD: $465,008 9. Olentangy LSD: $446,575 10. Dublin CSD: $437,000 11. Buckeye Valley LSD: $425,000 12. Jonathan Alder LSD: $422,000 13. Granville CSD: $410,000 14. Worthington: $409,250 15. Short North: $405,500
New Albany continued to top the charts, and remained more than $100K over second place.
Top 15 Least Expensive Locations by Median Sales Price in April 2021 1. Newark CSD: $140,000 2. Circleville CSD: $164,900 3. Whitehall: $165,000 4. Hamilton LSD: $195,250 5. Groveport Madison LSD: $196,000 6. Jefferson LSD: $198,000 7. Lancaster CSD: $200,000 8. London CSD: $207,500 9. Columbus CSD: $217,000 10. Obetz: $225,100 11. Columbus: $228,500 12. South-Western CSD: $230,000 13. Reynoldsburg CSD: $237,900 14. Canal Winchester CSD: $245,500 15. Minerva Park: $245,551
Columbus and some of its suburbs remained relative bargains in April.
Overall Market Median Sales Price in April 2021: $251,135 The overall market is defined by Columbus Metro Area counties.
Top 15 Locations with the Highest Median Sales Price % Growth Between April 2020 and April 2021 1. German Village: +67.2% 2. Jonathan Alder LSD: +42.1% 3. Worthington: +39.3% 4. Blacklick: +38.6% 5. Buckeye Valley LSD: +36.7% 6. Powell: +33.8% 7. Teays Valley LSD: +30.6% 8. Whitehall: +29.7% 9. Worthington CSD: 26.4% 10. London CSD: +25.8% 11. Olentangy LSD: 24.7% 12. Bexley: +24.1% 13. Westerville CSD: 22.9% 14. Jefferson LSD: +21.5% 15. South-Western CSD: +21.1% 16. Marysville CSD: +20.3%
Top 15 Locations with the Lowest Median Sales Price % Growth Between April 2020 and April 2021 1. Grandview Heights: -20.4% 2. New Albany Plain LSD: -10.3% 3. Canal Winchester CSD: -8.4% 4. Downtown: -8.0% 5. Johnstown-Monroe LSD: -6.8% 6. New Albany: -6.6% 7. Lithopolis: -6.3% 8. Newark CSD: -2.1% 9. Big Walnut LSD: +0.3 10. Circleville CSD: +0.6% 11. Granville CSD: +1.4% 12. Reynoldsburg CSD: +2.9% 13. Pataskala: +5.0% 14. Minerva Park: +5.8% 15. Gahanna Jefferson CSD: +6.4%
Urban areas generally improved significantly over earlier in the year. Downtown was still down, but by less than in previous months, so it seems the urban market is now well underway with a recovery.
Overall Market Median Sales Price % Change April 2021 vs. April 2020: +13.8%
Top 10 Locations with the Most New Listings in April 2021 1. Columbus: 1,328 2. Columbus CSD: 917 3. South-Western CSD: 197 4. Westerville CSD: 182 5. Olentangy LSD: 177 6. Hilliard CSD: 171 7. Dublin CSD: 153 8. Worthington CSD: 108 9. Pickerington LSD: 105 10. Grove City: 100
Columbus lead again, and had a few hundred more listings in April than it did in March. Listings overall were up in most places compared to a year ago, a small glimmer of good news.
Top 10 Locations with the Fewest New Listings in April 2021 1. Valleyview: 3 2. Lithopolis: 6 3. Obetz: 8 4. Jefferson LSD: 9 5. Sunbury: 9 6. Johnstown-Monroe LSD: 9 7. Jonathan Alder LSD: 10 8. Minerva Park: 11 9. Circleville CSD: 13 10. Grandview Heights: 14
Total New Listings in the Columbus Metro in April 2021: 3,250 Overall Metro New Listings % Change April 2021 vs April 2020: +41.1%
Top 10 Fastest-Selling Locations by # of Days Homes Remain on the Market Before Sale in April 2021 1. Lithopolis: 2 2. Minerva Park, Sunbury: 3 3. Big Walnut LSD, Jonathan Alder LSD: 4 4. Canal Winchester CSD, Jefferson LSD, Reynoldsburg CSD, Westerville, Worthington: 5 5. Groveport Madison LSD: 7 6. Beechwold/Clintonville, Delaware CSD, Hilliard CSD, Johnstown-Monroe LSD, Powell, Westerville CSD, Worthington CSD: 8 7. Hamilton LSD, South-Western CSD: 9 8. Hilliard, Pickerington LSD: 10 9. Obetz: 11 10. Bexley, Circleville CSD, Columbus: 12
Top 10 Slowest-Selling Locations by # of Days Homes Remain on the Market Before Sale in April 2021 1. Short North: 52 2. New Albany: 49 3. Granville CSD, New Albany Plain LSD: 39 4. German Village: 38 5. Grandview Heights: 28 6. Downtown: 27 7. Buckeye Valley LSD: 25 8. Lancaster CSD: 23 9. Marysville CSD, Olentangy LSD: 20 10. Upper Arlington CSD: 18
Top 10 Locations with the Greatest % Decline of # of Days on the Market Before Sale April 2021 vs March 2020 1. Lithopolis: -97.0% 2. Minerva Park: -94.6% 3. Big Walnut LSD: -93.7% 4. Johnstown-Monroe LSD: -92.3% 5. Canal Winchester CSD: -87.2% 6. Jonathan Alder LSD: -85.7% 7. Downtown: -81.0% 8. Delaware CSD: -80.0% 9. Hamilton LSD: -75.0% 10. Groveport Madison LSD: -73.1%
Top 10 Locations with the Lowest % Decline of # of Days on the Market Before Sale April 2021 vs March 2020 1. Short North: +73.3% 2. New Albany Plain LSD: +62.5% 3. New Albany: +44.1% 4. Jefferson LSD: +25.0% 5. Lancaster CSD: +4.5% 6. Upper Arlington CSD: 0.0% 7. Grove City: -7.1% 8. Buckeye Valley LSD: -16.7% 9. Gahanna: -18.8% 10. German Village: -24.0%
% Change for the # of Days Homes Remain on the Market Before Sale Across the Metro Overall: -46.7%
The market heated up even more in April. Despite more homes on the market, houses were selling the fastest they have in any month year to date. The improvements in sales came across the metro area, including urban areas that had been lagging behind somewhat in previous months.