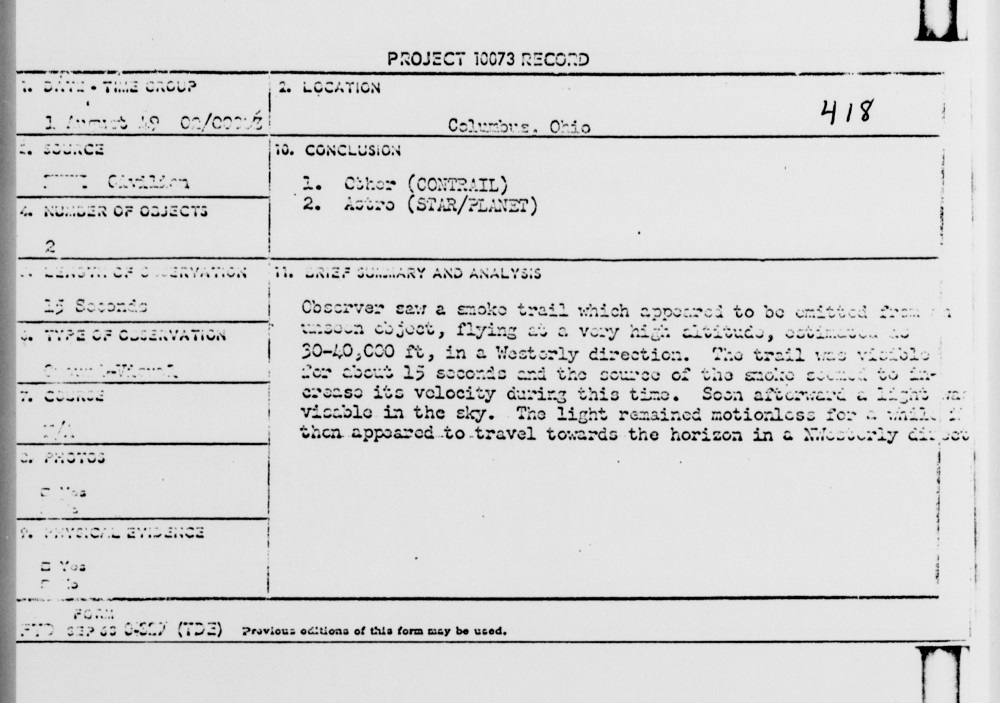
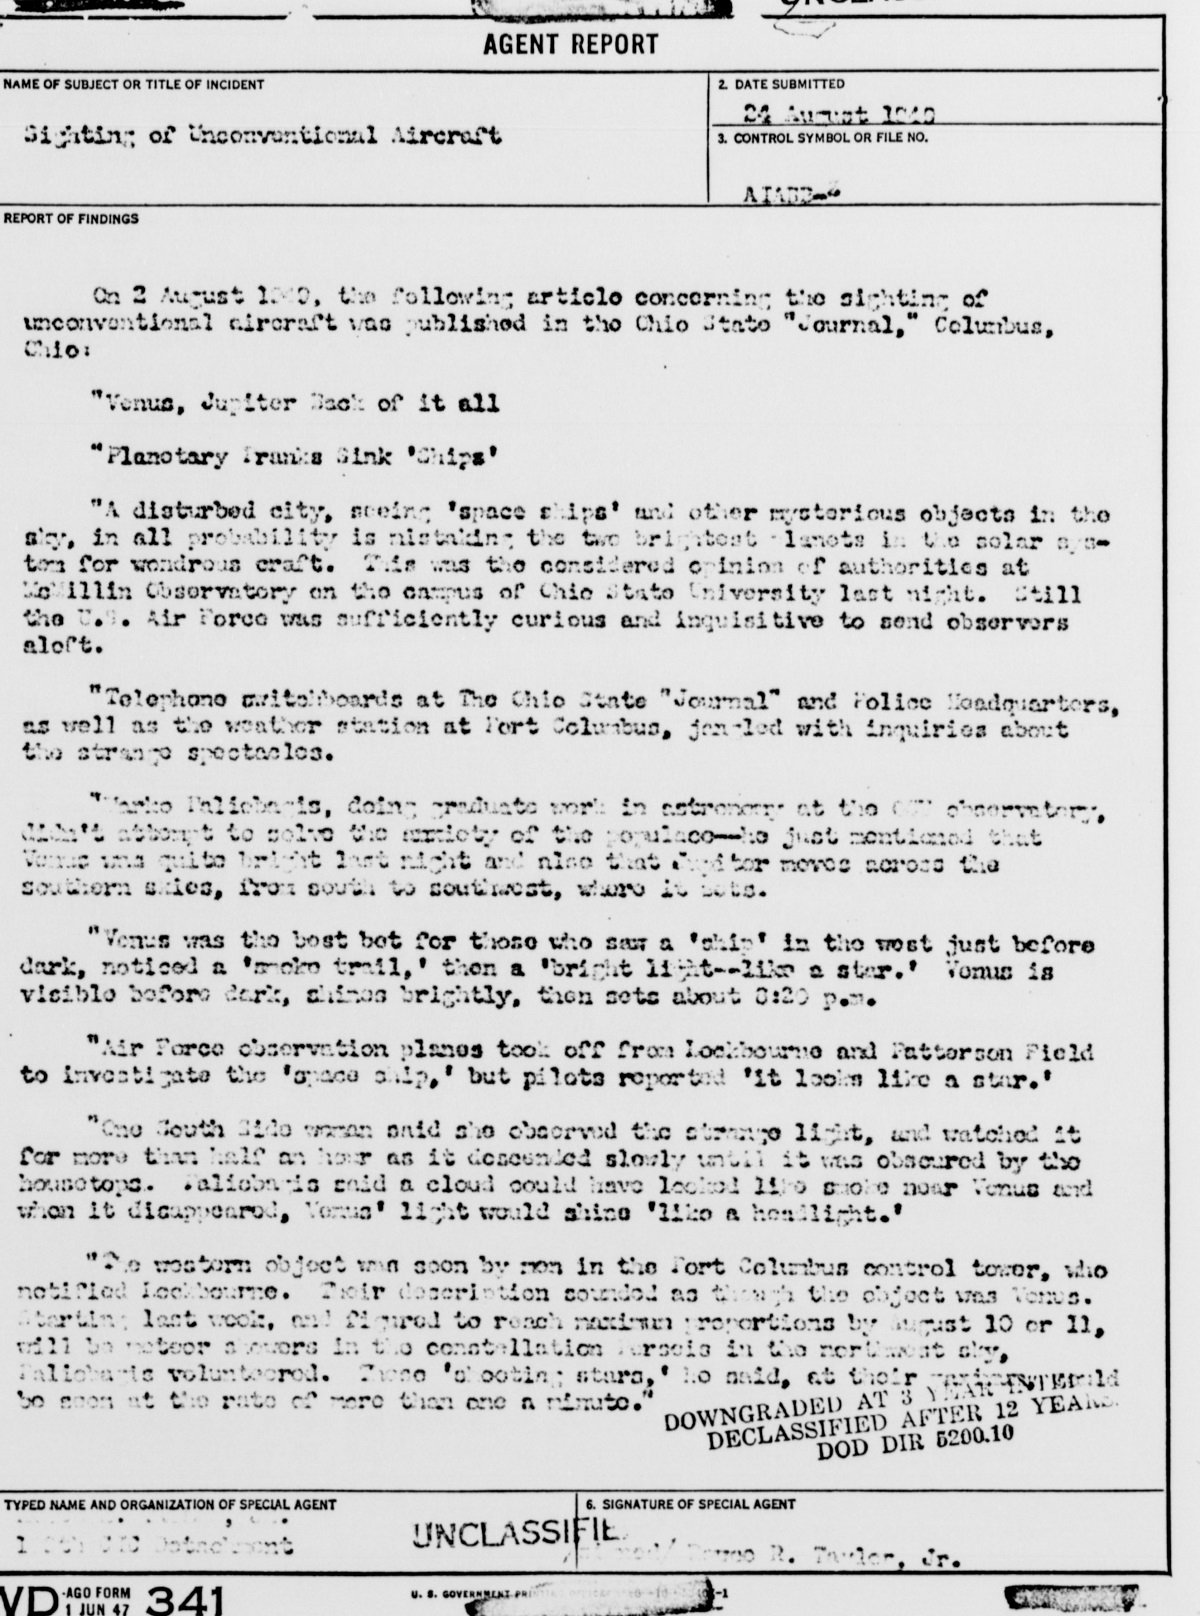
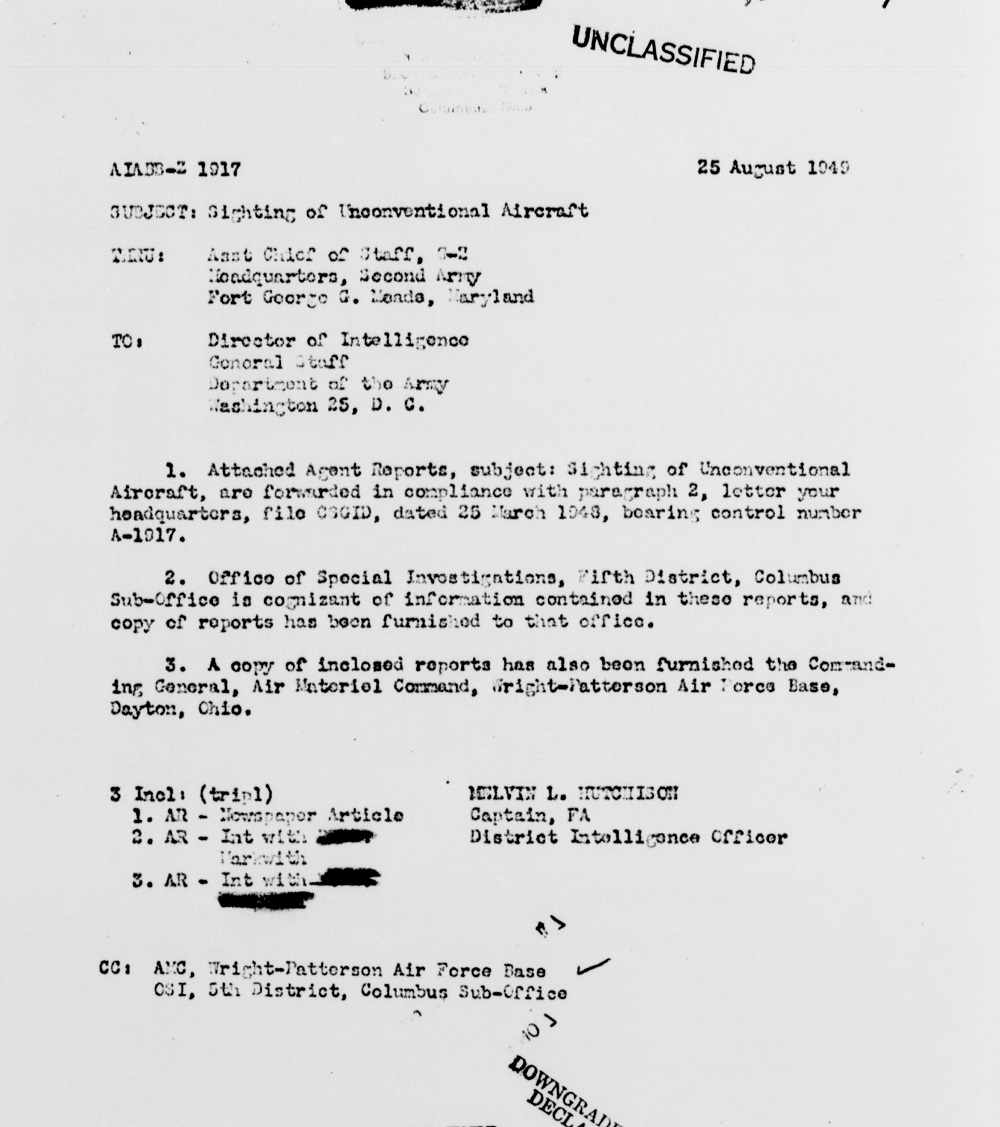
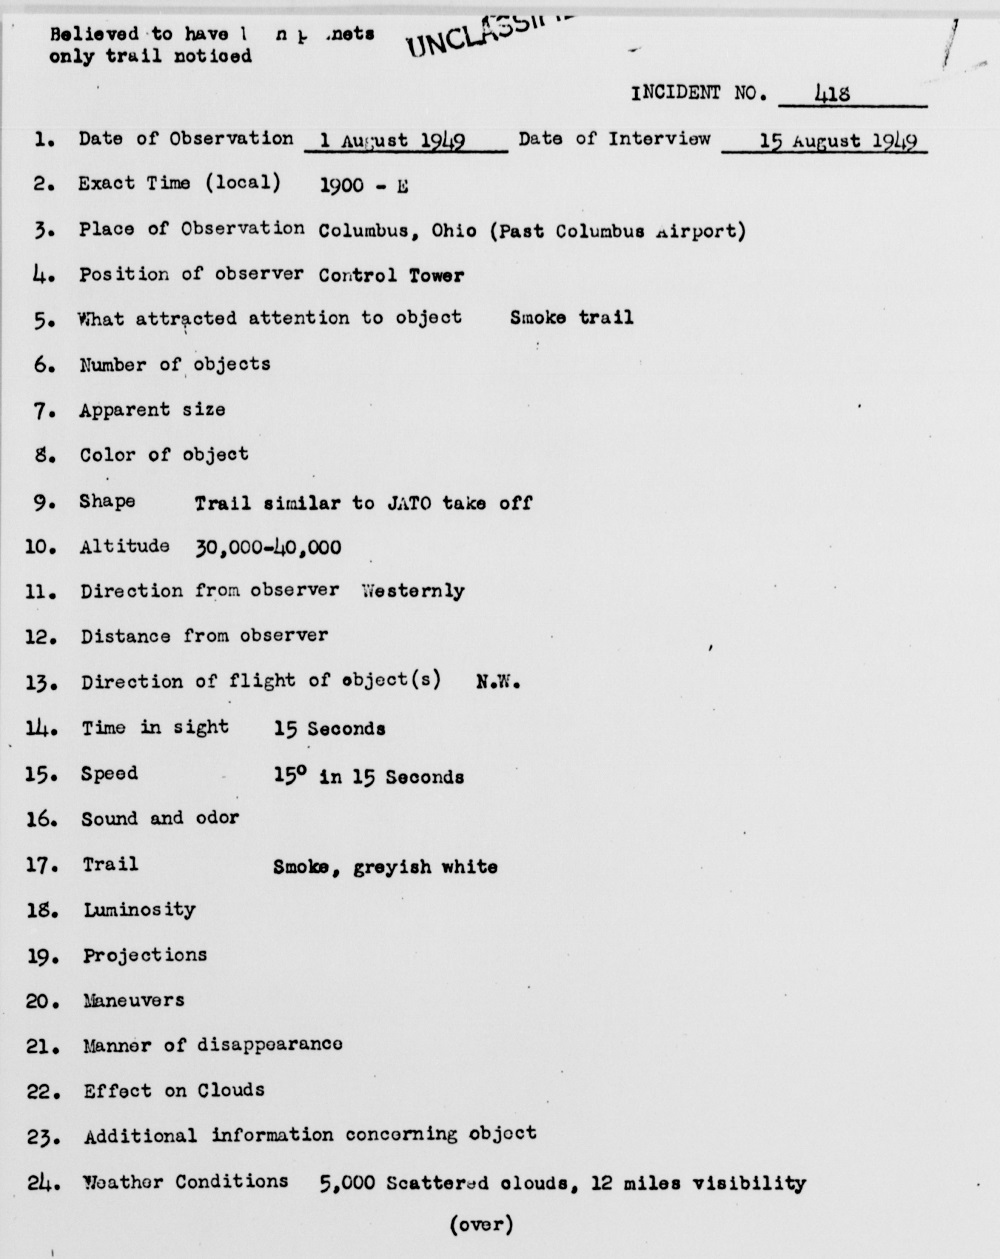
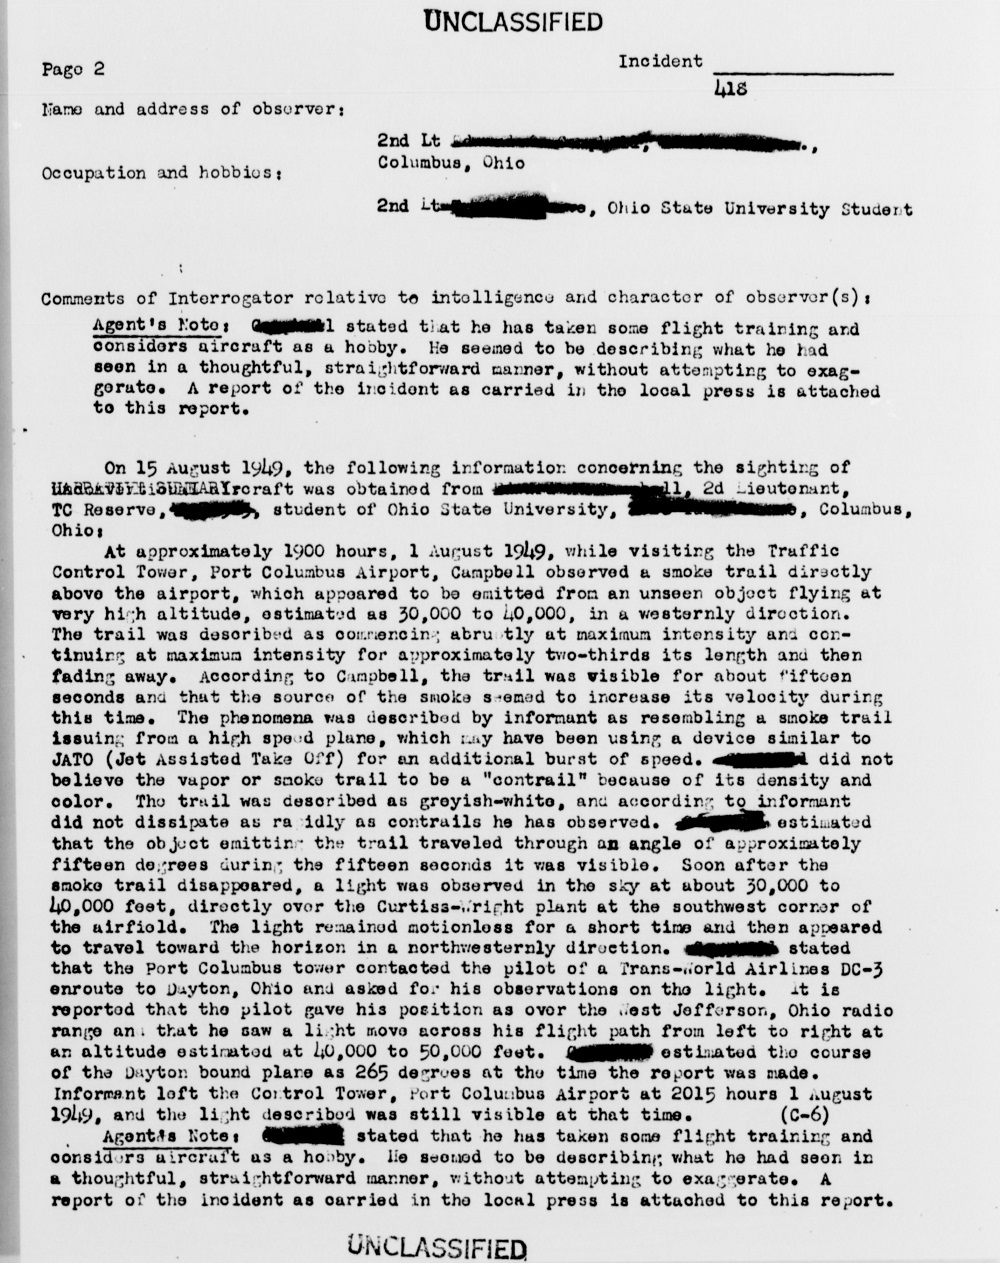
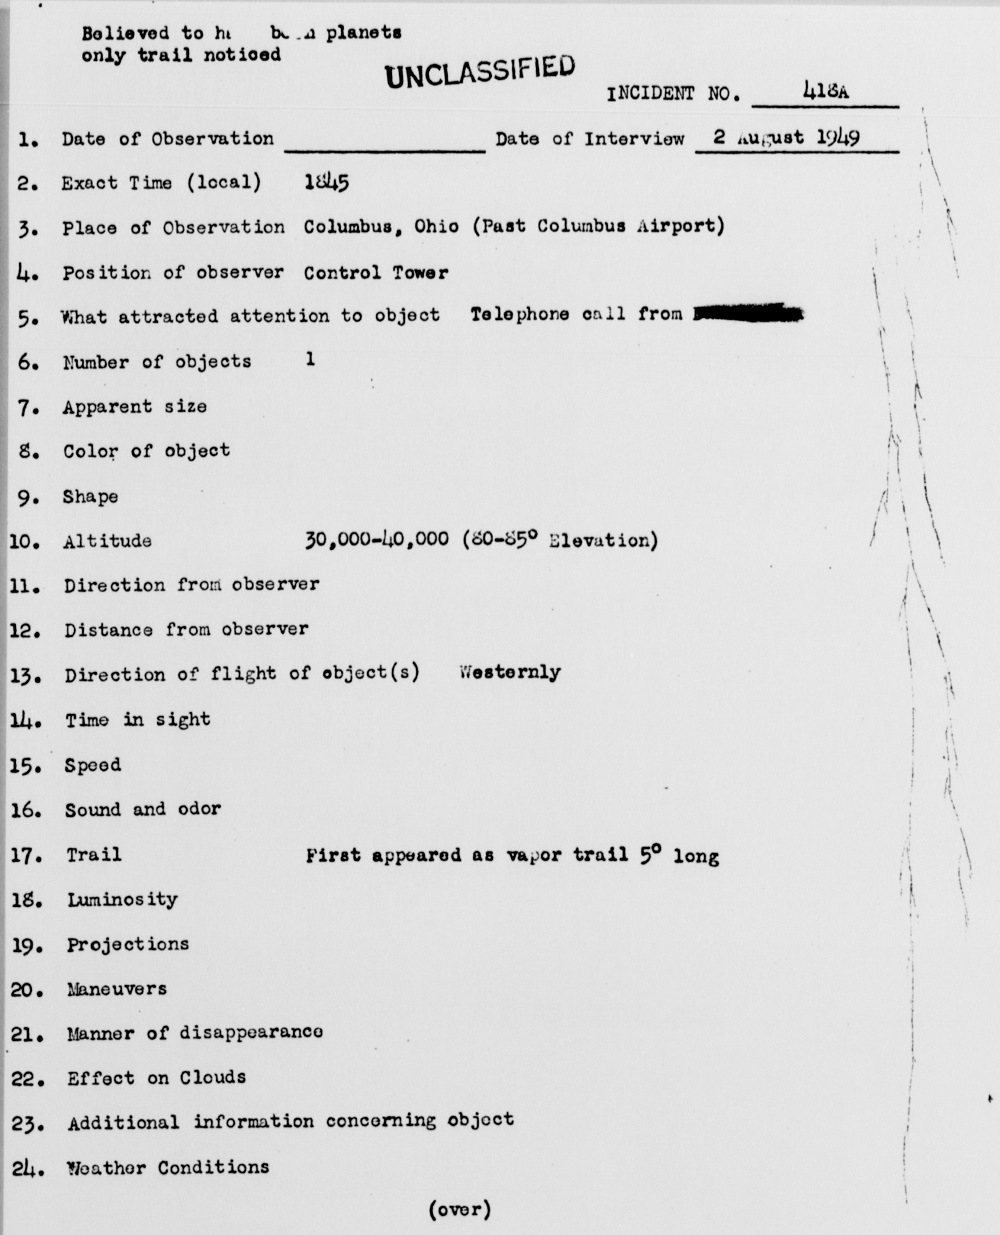
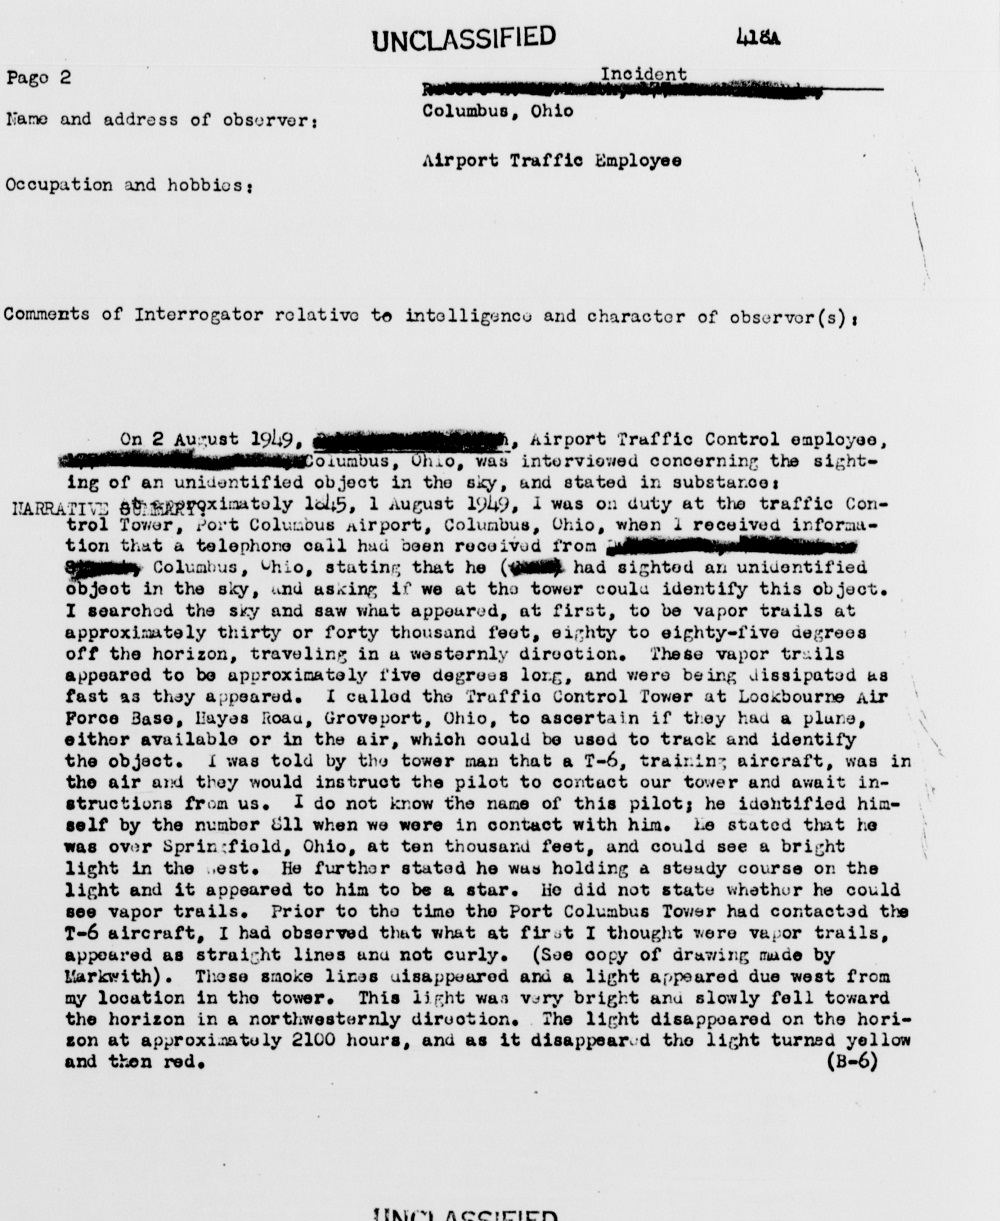
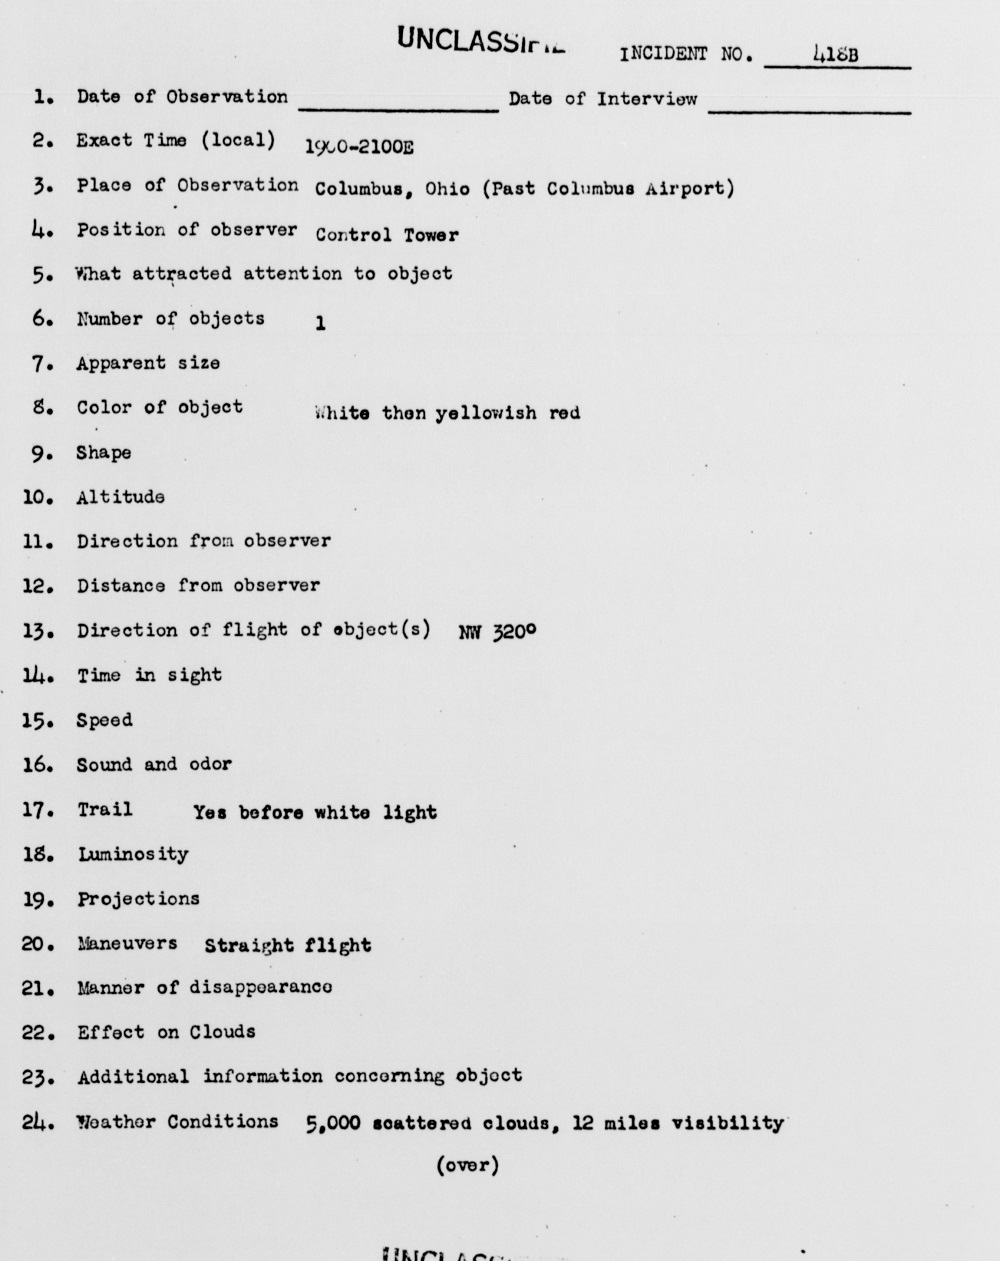
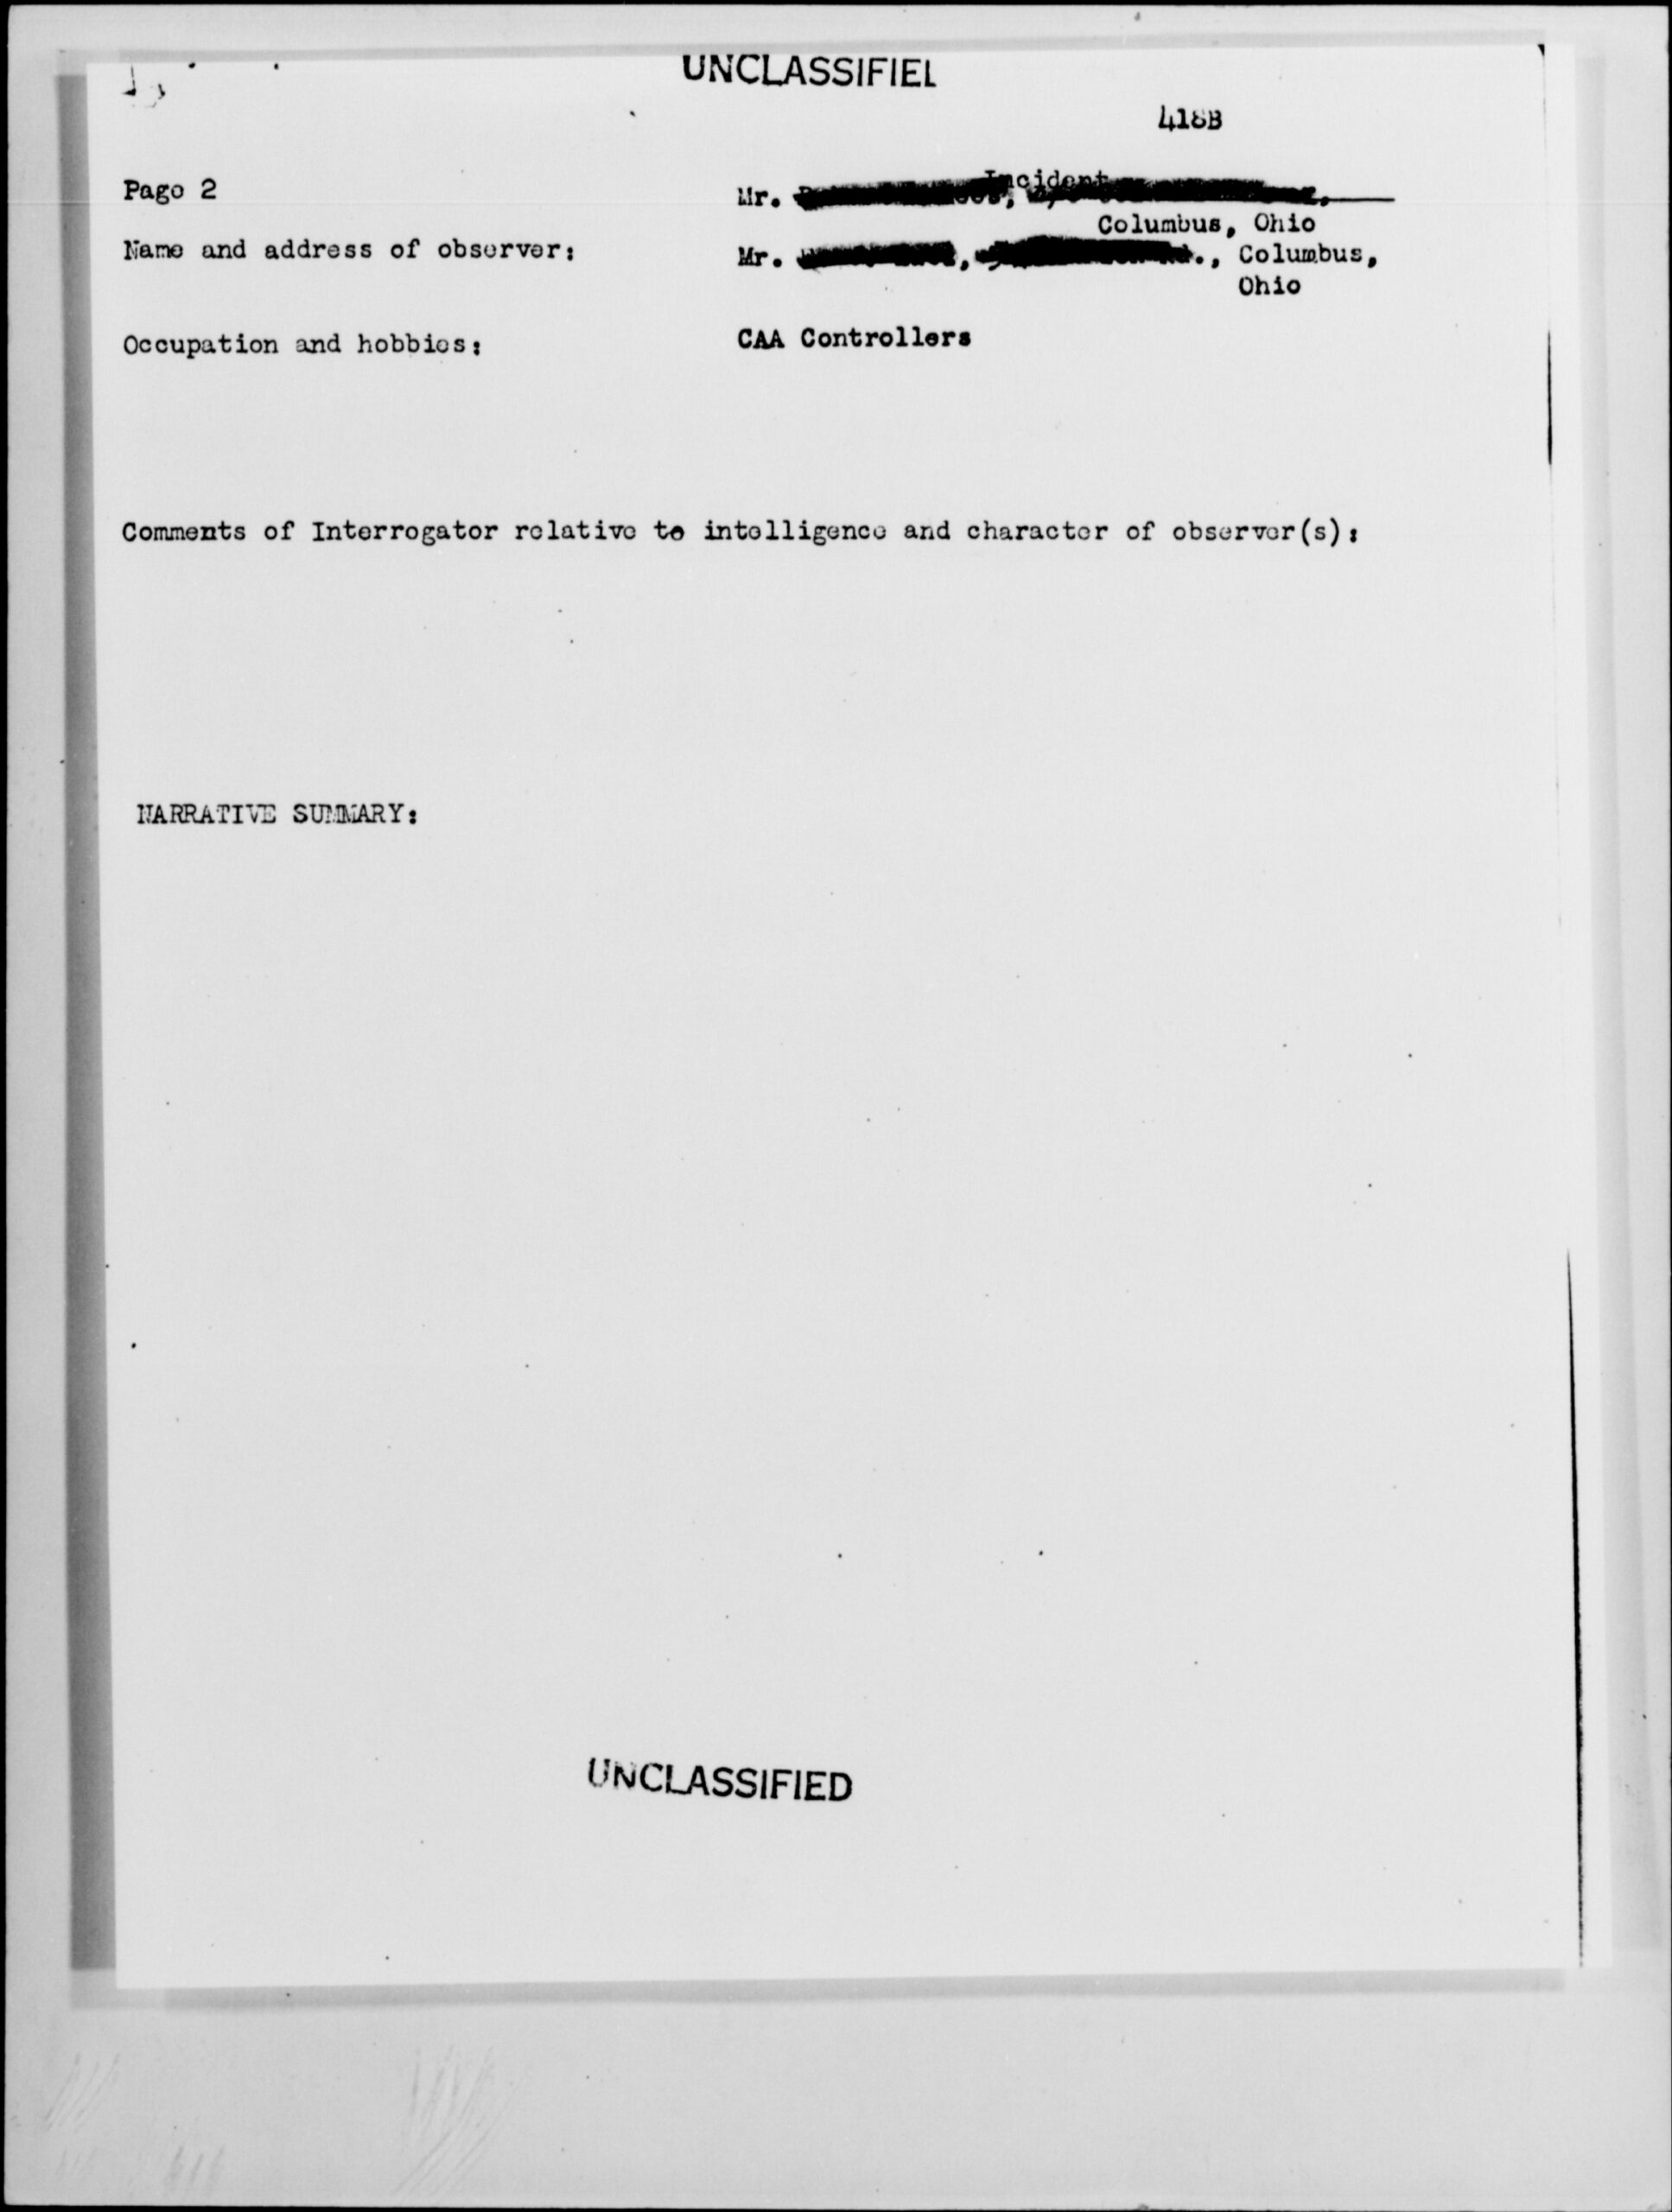
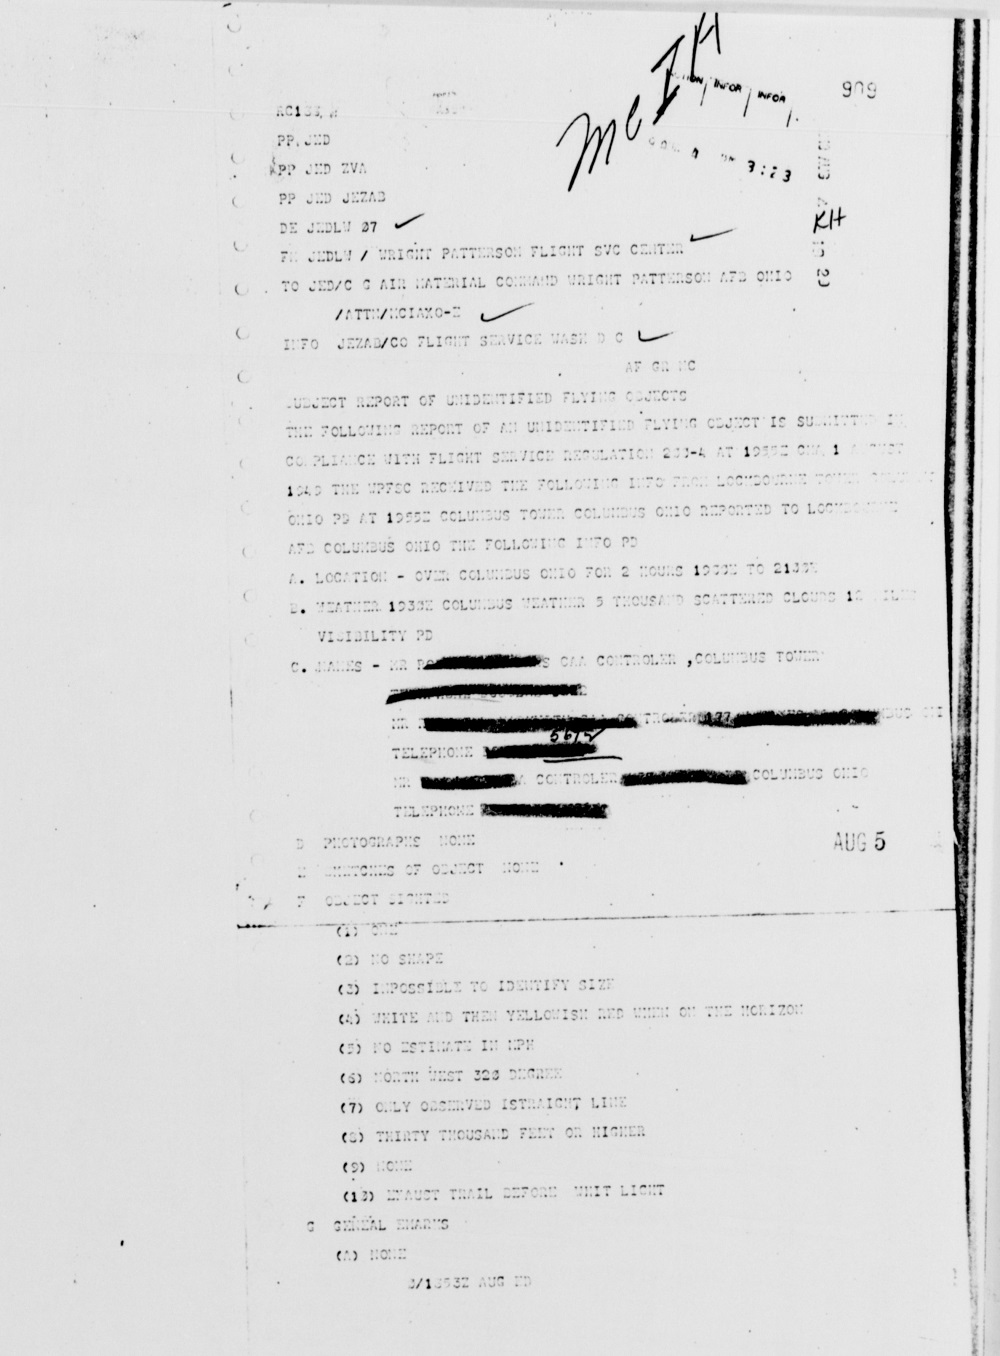
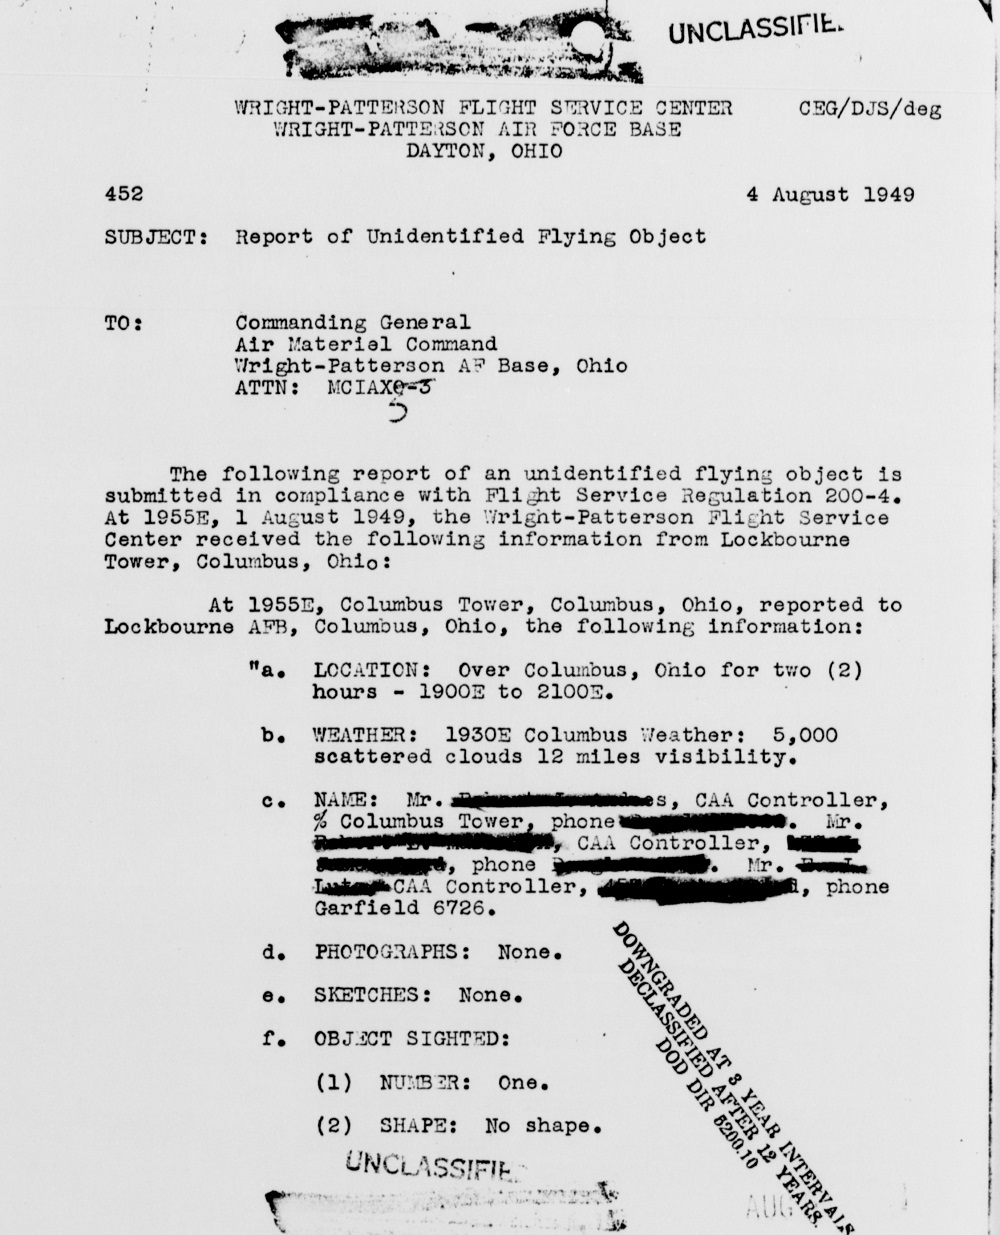
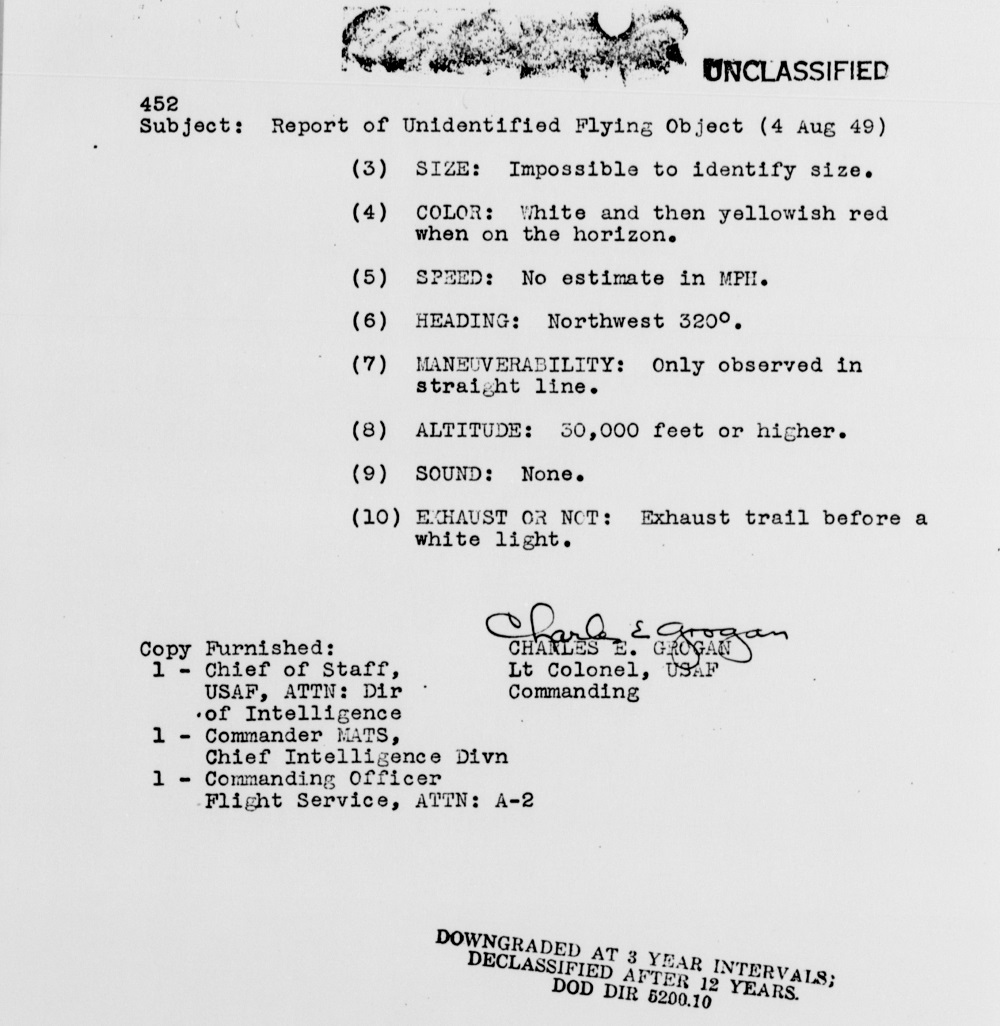
From the files of Project Blue Book, this event involved two objects- a “smoke” trail and a bright light.
To view more incidents around the world, visit this link.
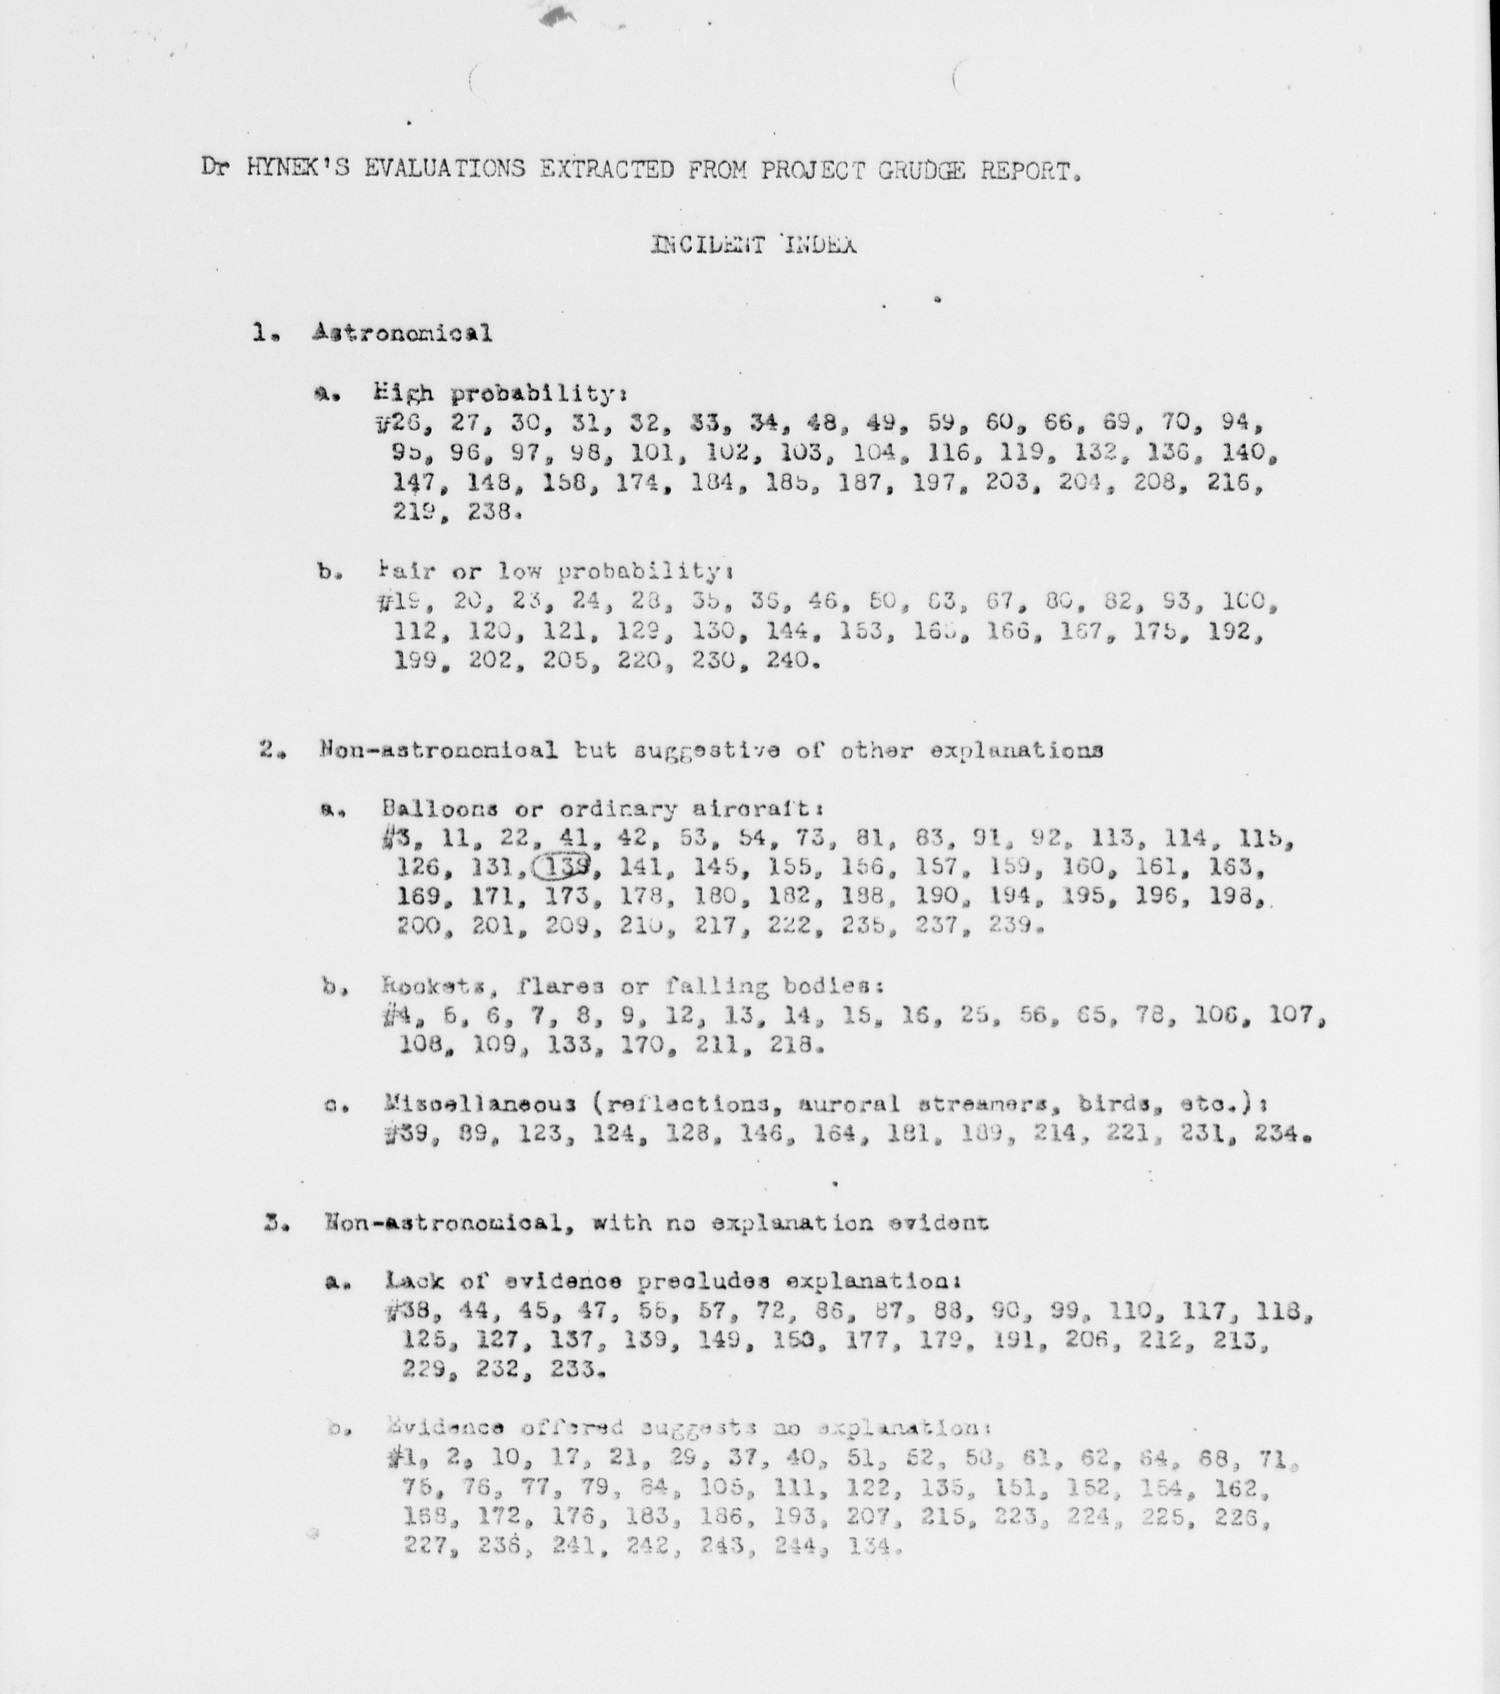
UFO Database

From the files of Project Blue Book, this event involved two objects- a “smoke” trail and a bright light.
To view more incidents around the world, visit this link.
UFO Database
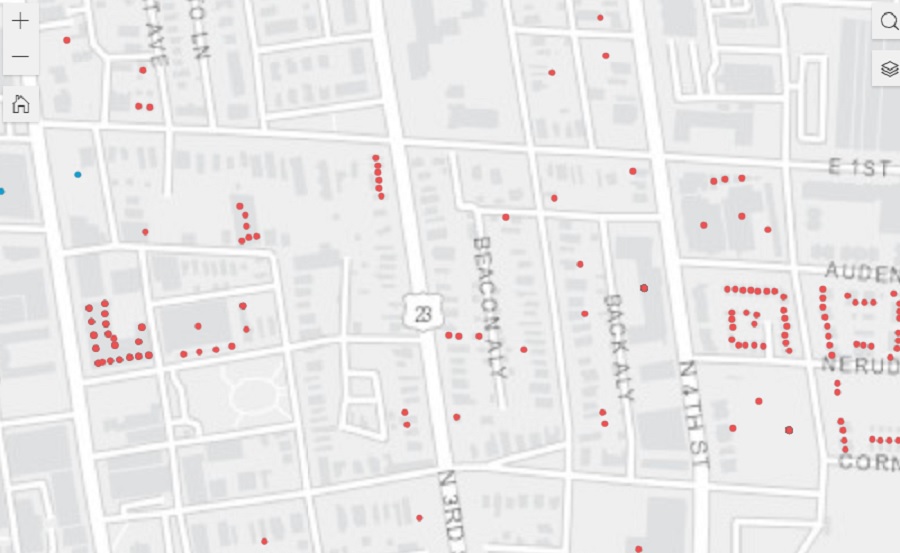
Around Columbus and Franklin County, tax incentives and abatements are granted to properties either for new development or to encourage improvements to existing buildings. Most of these incentives are given to properties in urban neighborhoods that have suffered from a lack of investment. However, in recent years, studies have shown that the distribution of them is both uneven and highly controversial, often going to rich developers in already well-established neighborhoods rather than those that need them the most. The link of the Columbus property tax abatement map provides both descriptions of the types of tax incentives used locally, as well as a map that shows what properties get what incentives and how much they amount to.
Franklin County Tax Incentives
In addition to abatements and incentives, TIFs, or Tax Increment Financing, uses targeted tax collection in specific areas to make improvements within said districts. Unlike tax abatements/incentives, TIFs can be found almost anywhere, and are regularly used in both suburban and urban neighborhoods, and are not always tied to improving declined areas.
Iuka Ravine, much like Glen Echo Ravine to its north, is a hidden gem in the heart of the city. Columbus isn’t exactly known for its interesting topography, so such features offer welcome variety from the otherwise endless flatness of Central Ohio. That the feature sits in the middle of the Campus area makes it even more special.
Iuka Ravine was named by Robert Neil when he returned home from the Civil War and built a home along it. Neil gave names to many local streets in the area, all based on his time in the Union Army and the places he had visited. He named the ravine after the Battle of Iuka, and Indianola Avenue was named after the location of that battle, Indianola, Mississippi.
The ravine went largely untouched until the early part of the 20th Century. Large homes sprung up along its edges beginning in the early 1900s, built to take advantage of the natural scenery. Iuka Avenue seems to have been built around 1905 given references for it don’t appear in any media before then. In 1912, Iuka Avenue was improved and the viaducts were built over the ravine at Indianola and Summit.
Before
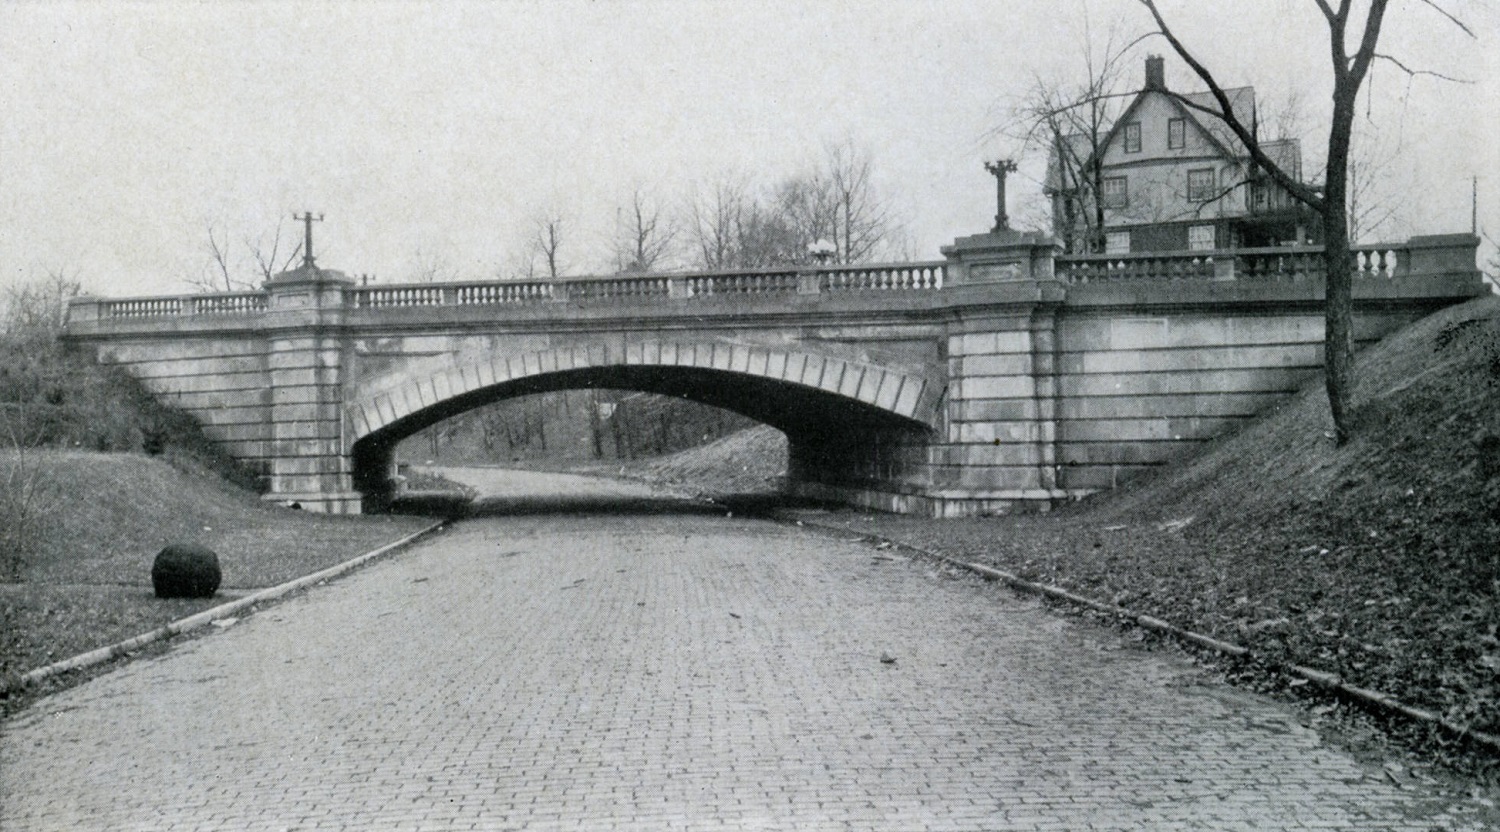
The before photo shows the Indianola viaduct over Iuka Avenue in 1916. Strangely enough, the ravine appears rather treeless, most likely due to construction of the viaducts and improvements 4 years prior to the time of the photo. A large building behind the bridge to the right was home to the Chi Phi fraternity at 2000 Indianola Avenue.
After
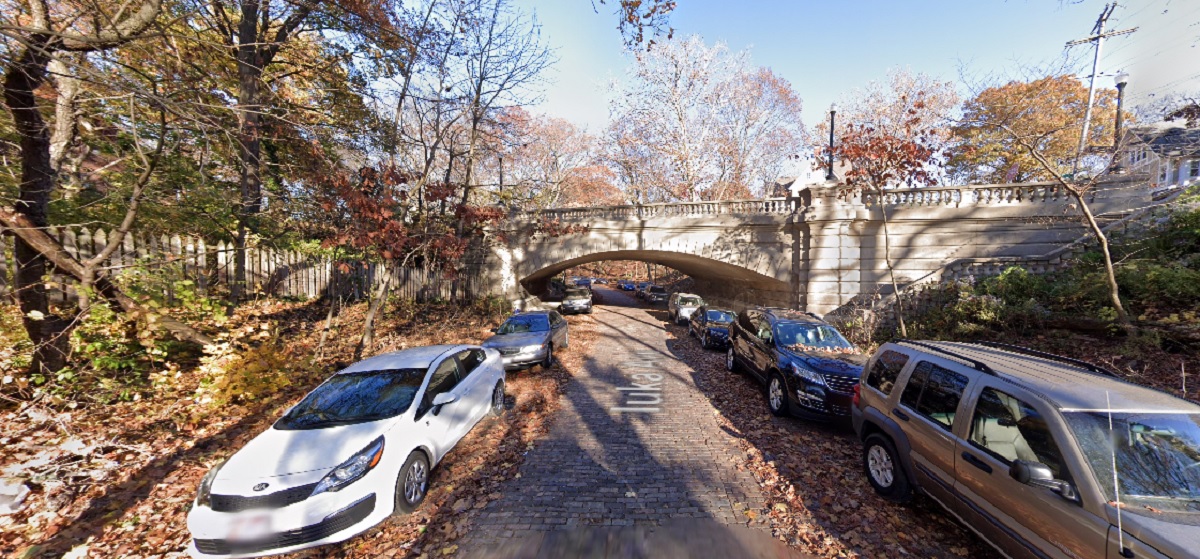
In the 2020 image, Iuka Ravine is now filled with trees- and, unfortunately, many cars- but otherwise remains remarkably untouched. Even the old Chi Phi house can still be seen peeking above the viaduct.
Over the years, Iuka has been threatened by development, but is now on the National Register of Historic Places. This popular running road and adjacent Iuka Park will likely continue to offer a bit of nature in the growing city for generations to come.
The Battle of Iuka was not a huge battle overall in comparison to other Civil War events, but over 400 soldiers still lost their lives during the fighting.

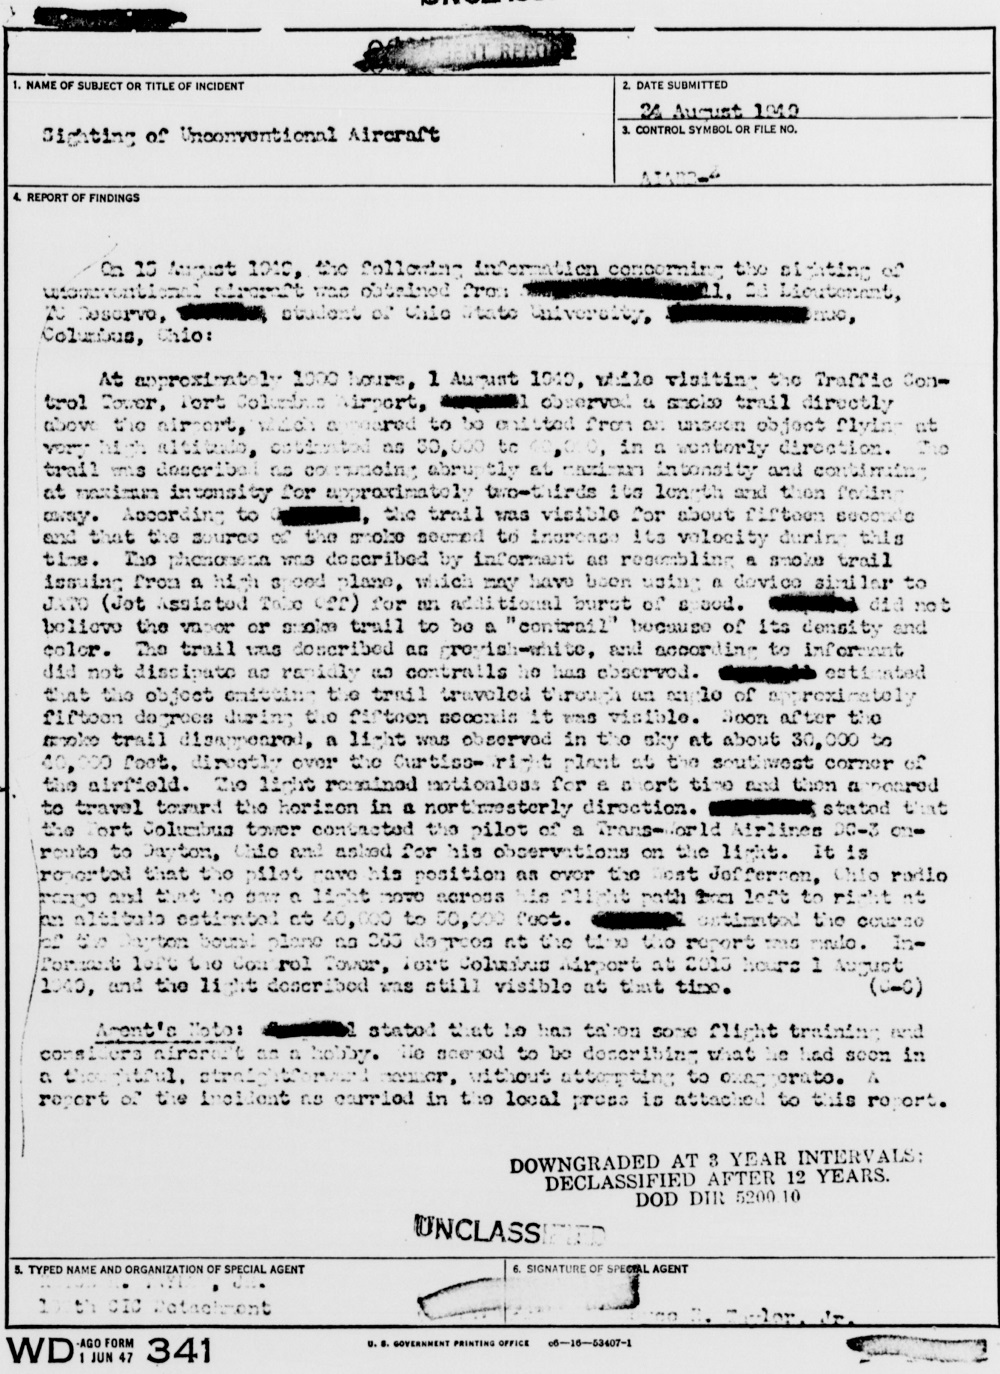
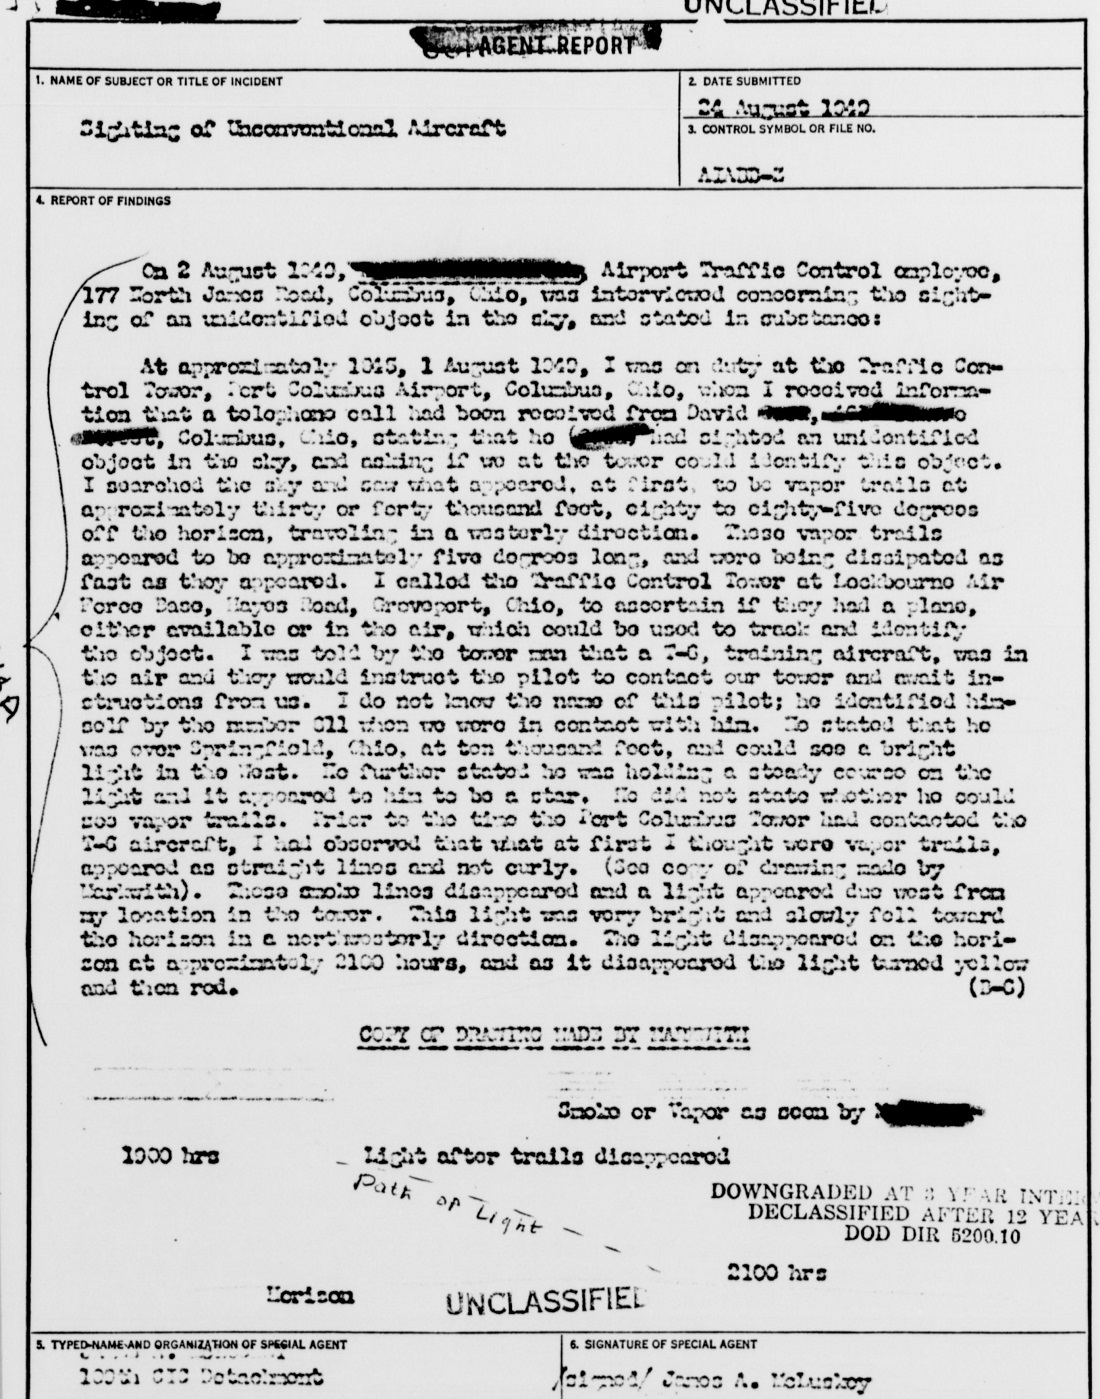
From the files of Project Blue Book. This incident was thought to be some kind of aircraft.
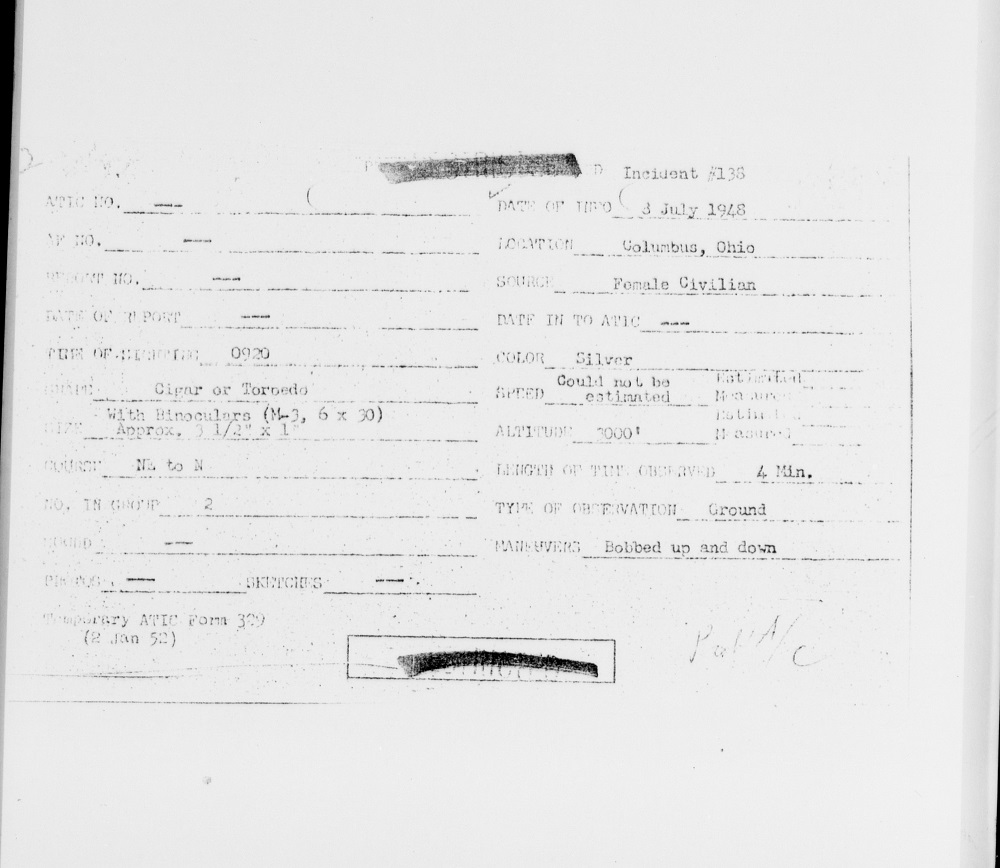
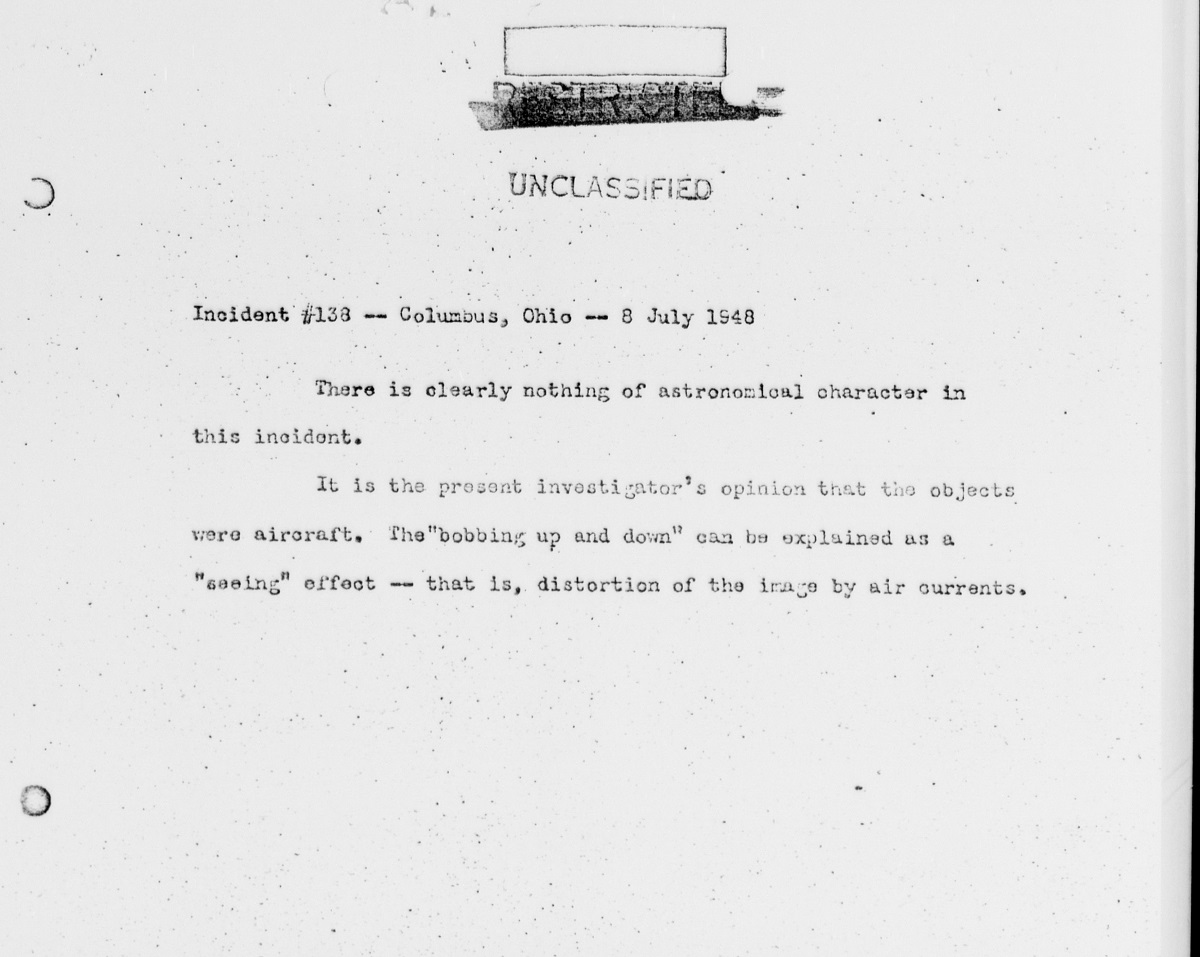
To see more incidents around the world, visit the following link.
UFO Database
The local housing market update June 2021 has been released. Here are the numbers!
Note: LSD= Local School District, CSD= City School District. In both cases, school district boundaries differ from city boundaries.
Top 15 Most Expensive Locations By Median Sales Price in June 2021
1. New Albany: $720,000
2. Bexley: $625,000
3. Powell: $532,500
4. Dublin: $509,000
4. New Albany Plain LSD: $500,000
5. Grandview Heights: $492,500
6. Olentangy LSD: $479,900
7. Upper Arlington CSD: $478,000
8. Big Walnut LSD: $472,500
9. German Village: $465,000
10. Dublin CSD: $445,389
11. Downtown: $445,000
12. Worthington: $440,000
13. Short North: $407,500
14. Jonathan Alder LSD: $407,000
15. Buckeye Valley LSD: $405,000
Top 15 Least Expensive Locations by Median Sales Price in June 2021
1. Newark CSD: $155,000
2. Whitehall: $155,900
3. Circleville CSD: $158,500
4. Lancaster CSD: $176,000
5. Valleyview: $177,925
6. Hamilton LSD: $182,950
7. Groveport Madison LSD: $200,000
8. Columbus CSD: $216,688
9. Obetz: $233,500
10. Jefferson LSD: $237,450
11. Columbus: $240,000
12. Reynoldsburg CSD: $240,250
13. South Western CSD: $250,000
14. Delaware CSD: $252,000
15. London CSD: $261,500
Overall Market Median Sales Price in May 2021: $291,391
Based on the 10 Columbus Metro Area counties.
Top 15 Locations with the Highest Median Sales Price % Growth Between June 2020 and June 2021
1. Jefferson LSD: +62.6%
2. Downtown: +47.6%
3. Bexley: +43.0%
4. London CSD: +39.9%
5. Worthington: +34.1%
6. Big Walnut LSD: +33.5%
7. Gahanna: +31.5%
8. Obetz: +31.2%
9. Sunbury: +29.5%
10. South Western CSD: +28.9%
11. Worthington CSD: +28.7%
12. Canal Winchester CSD: +26.9%
13. Whitehall: +26.7%
14. Pataskala: +26.0%
15. Powell: +25.6%
Top 15 Locations with the Lowest Median Sales Price % Growth Between June 2020 and June 2021
1. New Albany Plain LSD: -7.0%
2. Circleville CSD: -3.2%
3. Delaware CSD: +0.8%
4. Granville CSD: +1.0%
5. Hilliard: +4.3%
6. Short North: +5.0%
7. Hamilton LSD: +6.7%
8. Northridge LSD: +8.3%
9. Newark CSD: +10.1%
10. Buckeye Valley LSD: +10.2%
11. Lancaster CSD: +11.4%
12. Dublin CSD: +11.5%
13. Jonathan Alder LSD: +11.5%
14. Upper Arlington CSD: +12.3%
15. Lithopolis: +12.6%
There were just 2 locations that saw year-over-year median price declines.
Overall Market Median Sales Price % Change June 2021 vs. June 2020: +19.6%
Based on 52 metro market locations.
Top 10 Locations with the Most New Listings in June 2021
1. Columbus: 1,450
2. Columbus CSD: 990
3. South Western CSD: 269
4. Olentangy LSD: 236
5. Dublin CSD: 197
6. Hilliard CSD: 179
7. Westerville CSD: 179
8. Worthington CSD: 136
9. Pickerington LSD: 129
10. Grove City: 114
Top 10 Locations with the Fewest New Listings in June 2021
1. Valleyview: 3
2. Minerva Park: 7
3. Lithopolis: 8
4. Grandview Heights: 10
5. Jefferson LSD: 13
6. Sunbury: 13
7. Obetz: 15
8. Whitehall: 15
9. Northridge LSD: 17
10. German Village: 20
11. Jonathan Alder LSD: 20
Total New Listings in the Columbus Metro in June 2021: +3,852
Overall Metro New Listings % Change June 2021 vs June 2020: +18.0%
Top 10 Fastest-Selling Locations by # of Days Homes Remain on the Market Before Sale in June 2021
1. Minerva Park: 3
2. Hilliard: 4
3. Pickerington: 4
4. Canal Winchester CSD: 5
5. Gahanna: 5
6. Hilliard CSD: 5
7. Jefferson LSD: 5
8. Johnstown Monroe LSD: 5
9. Lithopolis: 5
10. Reynoldsburg CSD: 5
11. Westerville: 5
Top 10 Slowest-Selling Locations by # of Days Homes Remain on the Market Before Sale in June 2021
1. Bexley: 42
2. Downtown: 34
3. German Village: 27
4. Buckeye Valley LSD: 24
5. Grandview Heights: 24
6. Granville CSD: 16
7. New Albany: 16
8. Dublin: 15
9. Dublin CSD: 14
10. Grove City: 14
11. Lancaster CSD: 14
12. Obetz: 14
Top 10 Locations with the Greatest % Decline of # of Days on the Market Before Sale June 2021 vs June 2020
1. Lithopolis: -92.4%
2. Minerva Park: -90.0%
3. Granville CSD: -88.7%
4. Circleville CSD: -88.2%
5. London CSD: -88.1%
6. Northridge LSD: -86.5%
7. Jonathan Alder LSD: -83.3%
8. Pickerington: -81.8%
9. Sunbury: -81.3%
10. Big Walnut LSD: -80.0%
11. Hilliard: -80.0%
Top 10 Locations with the Lowest % Decline of # of Days on the Market Before Sale June 2021 vs June 2020
1. Grandview Heights: +84.6%
2. Bexley: +40.0%
3. Obetz: +27.3%
4. Grove City: +0.0%
5. Pataskala: -9.1%
6. Worthington: -10.0%
7. Whitehall: -27.3%
8. Groveport Madison LSD: -30.0%
9. German Village: -35.7%
10. South Western CSD: -35.7%
% Change for the # of Days Homes Remain on the Market Before Sale Across the Metro Overall: 14.1
Columbus Realtors is the primary source of this data.