For a long time, Columbus has had a reputation for having a relatively easy commute, at least in terms of driving. Its abundant highway and road system allowed commuters to travel to work quickly, with most commutes 20 minutes or less. However, as the city has grown and traffic has increased, the local commute may not be as quick as it once was. Story after story has shown that Columbus’ commute is steadily getting worse.
This post seeks to answer both how people are getting to work, how fast they get to work, and how commuters in Columbus differ from those in other cities. For this comparison, I used cities from metro areas most similar to Columbus’ size- 1.5-2.5 million- as well as major Midwest and Ohio cities.
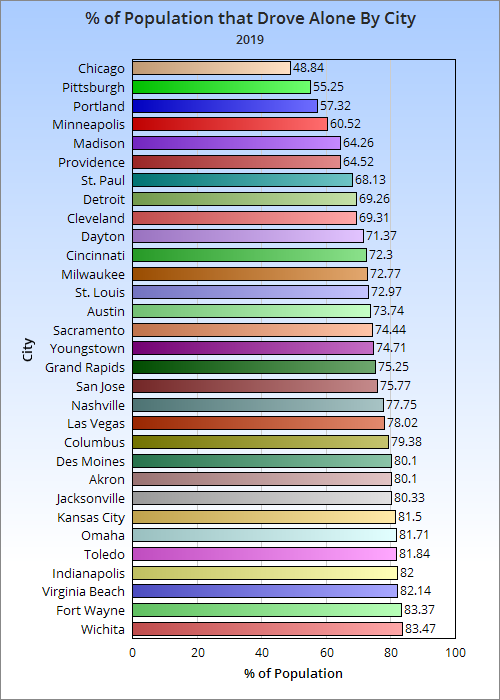
First, let’s look at just how people get to work by the % of workers in 2019, the latest year available.
Out of the 31 cities looked out, Columbus is the 10th most car-dependent city. It is also the 3rd most car-dependent in Ohio after Akron and Toledo.
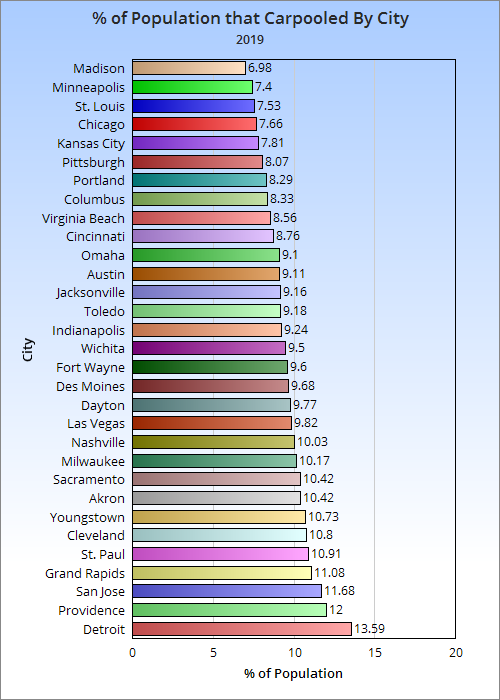
The heavy use of cars in Columbus did not translate to more people carpooling.
With only the COTA bus system available, the portion of the population that uses public transit is also in the bottom half. This despite the city seeing strong bus ridership growth over the last several years.
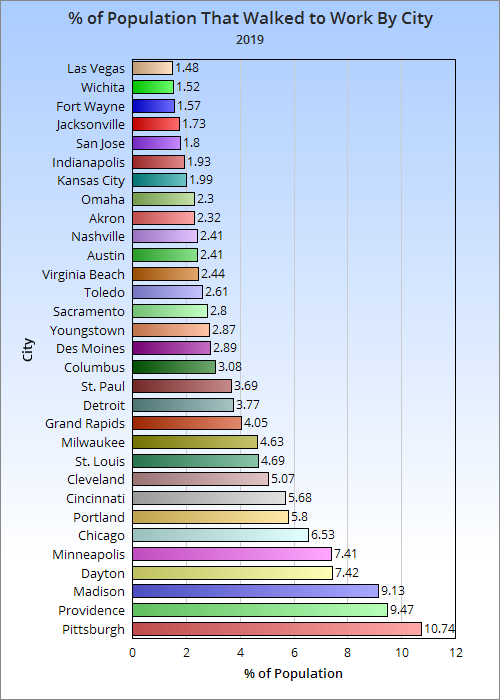
Columbus sat right in the middle of cities with the number of walking commuters. Several parts of the city lack sufficient walking infrastructure. For example, large parts of Linden and the South Side were built without sidewalks of any kind. Crosswalks and other safety features are also lacking in many areas.
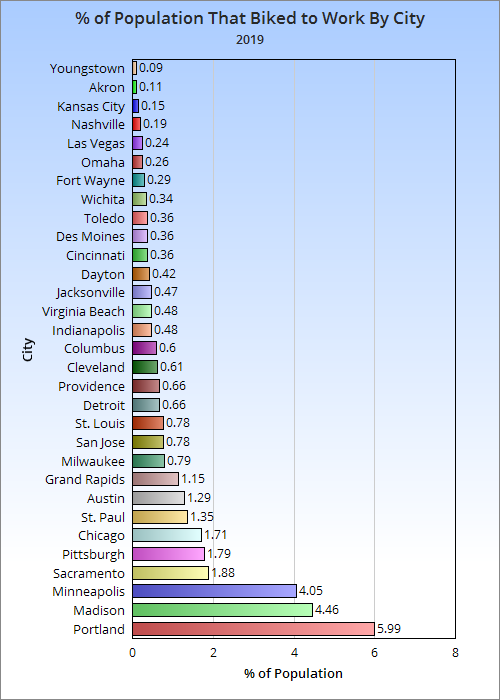
Columbus is again in the middle of the pack on biking commutes, and again infrastructure is the likely reason. There is only a single section of one bike lane that is protected anywhere in the city. Creating more bike lanes, let alone protected ones, remains a low priority for the city. Instead, they have relied on “Shared Use” type signage, along with painting sharrows.
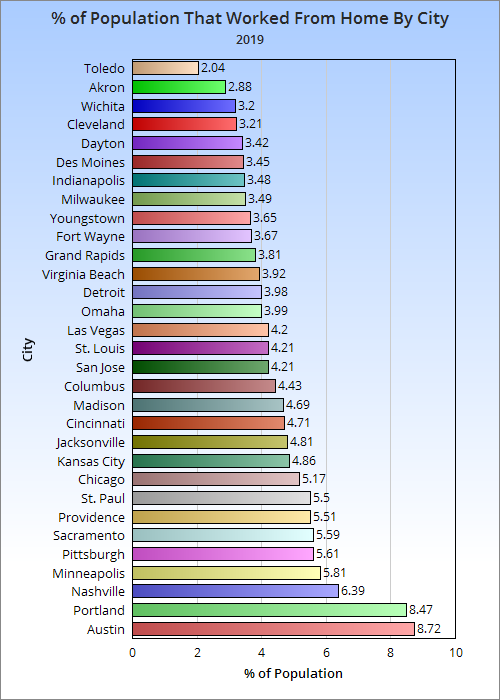
Columbus was in the top half of at-home workers. These numbers were all prior to the pandemic, so it’s likely that there will be significant increases in long-term or permanent home workers in post-2019 numbers.
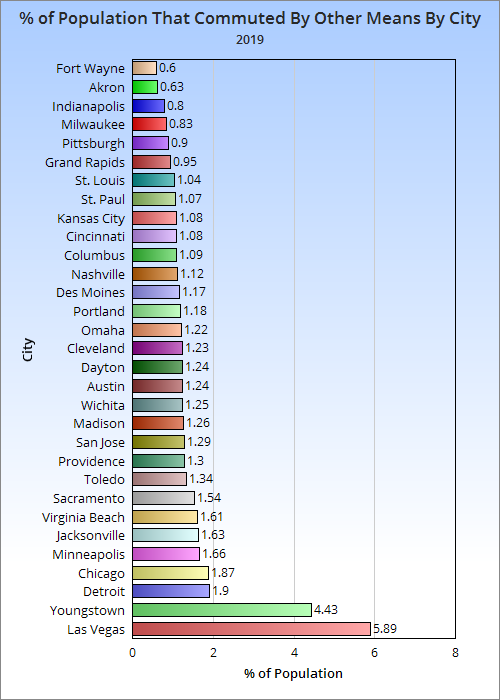
Other types of commuting include everything from taxis to commercial airline flights.
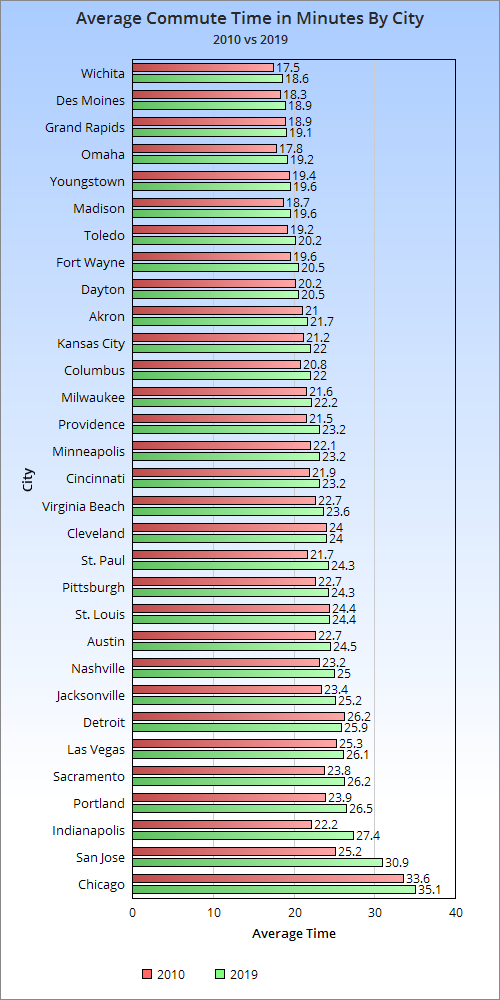
Columbus was in the bottom half of cities for the average commute time. Like almost everywhere else, that time has been increasing, however. Columbus saw the 11th biggest commute time increase and had the 2nd largest in Ohio. With its far larger population growth recently and predicted, that commute time is only going to get worse.
It’s pretty clear that Columbus has significant car dependency. With increasing commute times, it is crucial to plan for how people will get to work in the future. That is why it’s so important that new development is built to be walkable and dense while the average commute is still relatively short. This will promote walking, biking and new transit forms, all of which is better for a more vibrant, healthier city. It will also perhaps keep the number of cars on the road from growing as much. To assist in this process, the city must invest in more pedestrian and bike-friendly infrastructure, while also writing building codes that promote better planning in development.
To be fair, Columbus has made some progress. In 2010, the % of the population that drove alone was 80.76%, 1.38 points above where it was in 2019. Furthermore, the city has promoted more bus usage with its CPASS program. That said, the culture changes could’ve been much better had more policy and infrastructure been in place years ago like many other cities have had. Columbus has a lot of work to do.
Millennials- those born roughly between 1981 and 2001- are big news these days. They are the largest generation ever in terms of total numbers (exceeding 76 million), and their choices are already having big impacts on everything from housing to the economy. I wanted to look at Columbus and its peers to see where it ranks in terms of attracting these young professionals.
For the comparison, I looked at metro areas of 1.5-2.5 million as well as major Midwest metros and then used their core cities to get the numbers. I used the age group of 25-34 specifically, as that is usually the number most often cited in the news.
Rank of Total Population Aged 25-34 2005_______________________2010___________________2014 1. Chicago: 463,236_______1. Chicago: 510,042_______1. Chicago: 525,381 2. San Antonio: 180,981_____2. San Antonio: 200,645____2. San Antonio: 226,711 3. Austin: 137,523_________3. Austin: 162,247_________3. Austin: 199,838 4. San Jose, CA: 133,144___4. Columbus: 147,584______4. Columbus: 170,759 5. Columbus: 131,641______5. San Jose, CA: 142,551___5. San Jose, CA: 153,690 6. Indianapolis: 114,532_____6. Indianapolis: 133,088____6. Charlotte, NC: 141,869 7. Detroit: 110,759_________7. Charlotte, NC: 127,539___7. Indianapolis: 140,491 8. Charlotte, NC: 100,025____8. Portland, OR: 113,210___8. Portland, OR: 116,109 9. Portland, OR: 90,023_____9. Milwaukee: 97,359______9. Milwaukee: 100,205 10. Las Vegas: 84,418______10. Detroit: 85,023________10. Minneapolis: 90,662 11. Milwaukee: 82,060______11. Minneapolis: 81,532____11. Las Vegas: 90,441 12. Sacramento, CA: 75,497___12. Las Vegas: 81,212____12. Detroit: 89,843 13. Minneapolis: 74,208___13. Sacramento, CA: 78,527__13. Sacramento, CA: 84,013 14. Kansas City, MO: 68,060__14. Kansas City: 73,872__14. Kansas City, MO: 79,262 15. Virginia Beach: 60,749__15. Virginia Beach: 67,614__15. Virginia Beach: 75,543 16. Omaha, NE: 56,248____16. Omaha, NE: 62,396_____16. Omaha, NE: 71,040 17. Wichita, KS: 52,426____17. St. Louis: 57,627_______17. Pittsburgh: 62,473 18. Cleveland: 50,558_____18. Wichita, KS: 56,737_____18. St. Louis: 61,718 19. St. Louis: 48,137______19. Cleveland: 54,428______19. Wichita, KS: 58,334 20. Cincinnati: 44,945_____20. Pittsburgh: 51,109______20. Cleveland: 56,134 21. Toledo: 43,134_______21. St. Paul, MN: 50,107_____21. St. Paul, MN: 54,464 22. Orlando: 40,846______22. Cincinnati: 49,067_______22. Orlando: 54,395 23. St. Paul, MN: 39,676__23. Orlando: 48,102________23. Cincinnati: 54,247 24. Lincoln, NE: 38,893___24. Madison, WI: 44,662_____24. Madison, WI: 44,835 25. Madison, WI: 38,826___25. Lincoln, NE: 42,034_____25. Toledo: 43,661 26. Pittsburgh: 38,744____26. Toledo: 41,580_________26. Lincoln, NE: 40,071 27. Grand Rapids: 35,287__27. Fort Wayne, IN: 35,193__27: Grand Rapids: 38,922 28. Des Moines: 32,640__28. Providence, RI: 31,044__28. Fort Wayne, IN: 37,741 29. Fort Wayne, IN: 31,738__29. Grand Rapids: 30,963__29. Des Moines: 33,857 30. Akron: 30,436_______30. Des Moines: 30,376_____30. Providence, RI: 31,902 31. Providence, RI: 29,307__31. Akron: 27,446________31. Akron: 28,207 32. Dayton: 18,591_______32. Dayton: 20,278________32. Dayton: 21,096 33. Youngstown: 8,505____33. Youngstown: 8,484_____33. Youngstown: 8,468
So Columbus ranks highly among total population in the 25-34 age group. But what about growth?
Total Growth Rank in 25-34 Population 2005-2014 1. Austin, TX: 62,315 2. Chicago: 62,145 3. San Antonio, TX: 45,730 4. Charlotte, NC: 41,844 5. Columbus: 39,118 6. Portland, OR: 26,086 7. Indianapolis: 25,959 8. Pittsburgh: 23,729 9. San Jose, CA: 20,546 10. Milwaukee, WI: 18,145 11. Minneapolis, MN: 16,454 12. Virginia Beach, VA: 14,794 13. St. Paul, MN: 14,788 14. Omaha, NE: 14,612 15. St. Louis, MO: 13,581 16. Orlando, FL: 13,549 17. Kansas City, MO: 11,202 18. Cincinnati: 9,302 19. Sacramento, CA: 8,516 20. Las Vegas, NV: 6,023 21. Madison, WI: 6,009 22. Fort Wayne, IN: 6,003 23. Wichita, KS: 5,908 24. Cleveland: 5,576 25. Grand Rapids, MI: 3,635 26. Providence, RI: 2,595 27. Dayton: 2,505 28. Des Moines, IA: 1,217 29. Lincoln, NE: 1,178 30. Toledo: 527 31. Youngstown: -37 32. Akron: -2,229 33. Detroit: -20,736
Again, Columbus ranks near the top during this period. What about more recently, since 2010?
Total Growth Rank of 25-34 Population 2010-2014 1. Austin: 37,591 2. San Antonio: 26,066 3. Columbus: 23,175 4. Chicago: 15,339 5. Charlotte: 14,330 6. Pittsburgh: 11,364 7. San Jose: 11,139 8. Las Vegas: 9,229 9. Minneapolis: 9,130 10. Omaha: 8,644 11. Grand Rapids: 7,959 12. Virginia Beach: 7,929 13. Indianapolis: 7,403 14. Orlando: 6,293 15. Sacramento: 5,486 16. Kansas City: 5,390 17. Cincinnati: 5,180 18. Detroit: 4,820 19. St. Paul: 4,357 20. St. Louis: 4,091 21. Des Moines: 3,481 22. Portland: 2,899 23. Milwaukee: 2,846 24. Fort Wayne: 2,548 25. Toledo: 2,081 26. Cleveland: 1,706 27. Wichita: 1,597 28. Providence: 858 29. Dayton: 818 30. Akron: 761 31. Madison: 173 32. Youngstown: -16 33. Lincoln: -1,963
So Columbus is doing even better since 2010 than it did in the earlier period and attracts significantly more Millennials in the 25-34 age group than cities often cited for this very metric.
Next, let’s look at percentage growth, as city size can affect this.
Total Percent Growth 2005-2014 in 25-34 Population 1. Pittsburgh: +61.25% 2. Austin: +45.31% 3. Charlotte: +41.83% 4. St. Paul: +37.27% 5. Orlando: +33.17% 6. Columbus: +29.72% 7. Portland: +28.98% 8. St. Louis: +28.21% 9. Omaha: +25.89% 10. San Antonio: +25.27% 11. Virginia Beach: +24.35% 12. Indianapolis: +22.67% 13. Minneapolis: +22.17% 14. Milwaukee: +22.11% 15. Cincinnati: +20.70% 16. Fort Wayne: +18.91% 17. Kansas City: +16.46% 18. Madison: +15.48% 19. San Jose: +15.43% 20. Dayton: +13.47% 21. Chicago: +13.42% 22. Sacramento: +11.28% 23. Wichita: +11.27% 24. Cleveland: +11.03% 25. Grand Rapids: +10.30% 26. Providence: +8.85% 27. Las Vegas: +7.13% 28. Des Moines: +3.73% 29. Lincoln: +3.03% 30. Toledo: +1.22% 31. Youngstown: -0.44% 32. Akron: -7.32% 33. Detroit: -18.75%
So Columbus again performs well in percentage growth, despite having one of the largest populations in the age group. It performs even better in the period since 2010, coming in at 3rd place.
Finally, now that we know the totals and the growth, what is the % of total city population that the 25-34 age group makes up?
25-34 % of Total City Population 2014 1. Minneapolis: 22.27% 2. Austin: 21.89% 3. Orlando: 20.73% 4. Pittsburgh: 20.45% 5. Columbus: 20.42% 6. Grand Rapids: 20.08% 7. St. Louis: 19.44% 8. Chicago: 19.30% 9. Portland: 18.74% 10. St. Paul: 18.30% 11. Madison: 18.25% 12. Cincinnati: 18.19% 13. Providence: 17.81% 14. Charlotte: 17.52% 15. Sacramento: 17.32% 16. Kansas City: 16.84% 17. Virginia Beach: 16.75% 18. Milwaukee: 16.71% 19. Indianapolis: 16.50% 20. Des Moines: 16.19% 21. Omaha: 15.91% 22. San Antonio: 15.78% 23. Toledo: 15.54% 24. San Jose: 15.13% 25. Wichita: 15.02% 26. Dayton: 14.96% 27. Fort Wayne: 14.74% 28. Las Vegas: 14.74% 29. Lincoln: 14.68% 30. Cleveland: 14.41% 31. Akron: 14.26% 32. Detroit: 13.21% 33. Youngstown: 13.02%
And here’s a simple % of population projection for just 4 years from now, 2018, provided the 25-34 population grows the same between 2014-2018 as it did 2010-2014. 1. Pittsburgh: 24.18% 2. Grand Rapids: 23.71% 3. Austin: 23.38% 4. Minneapolis: 23.27% 5. Columbus: 22.16% 6. Orlando: 21.34% 7. St. Louis: 20.82% 8. Cincinnati: 19.85% 9. Chicago: 19.70% 10. St. Paul: 19.05% 11. Providence: 18.20% 12. Portland: 18.14% 13. Virginia Beach: 18.1% 14. Sacramento: 17.84% 15. Charlotte: 17.67% 16. Kansas City: 17.64% 17. Des Moines: 17.50% 18. Madison: 17.40% 19. Milwaukee: 17.07% 20. Indianapolis: 16.85% 21. Omaha: 16.61% 22. Toledo: 16.59% 23. San Antonio: 16.52% 24. Fort Wayne: 15.61% 25. Las Vegas: 15.59% 26. Dayton: 15.27% 27. San Jose: 15.24% 28. Wichita: 15.23% 29. Cleveland: 15.08% 30. Akron: 14.73% 31. Detroit: 14.48% 32. Youngstown: 13.35% 33. Lincoln: 13.13%
Columbus has an existing large population of the 25-34 age demographic, and looks to be one of the strongest performers into the near future. Some would ask why that would be considering that Columbus transit is woefully lacking and has a reputation (very undeservedly, in my opinion) of being suburban- characteristics that Millennials supposedly almost universally reject. Perhaps the bottom line is that economics trump all other desires. Cost of living and employment tend to be higher up the list than rail lines, and Columbus has both a strong economy and relatively low COL. Whatever the case may be, Columbus seems to be doing something right. Continue this look at this population in Part 2.
Over the years, I’ve learned that Columbus has a very suburban reputation, meaning that it is perceived to have very low density throughout, especially because it aggressively annexed suburban areas into the city limits decades ago. With those claims, I wondered what the metro population densities would be if Columbus’ area size was scaled down to others, with the goal of finding out if it really deserves the suburban reputation. Bare with me, because there is a lot to look at.
First, I used Columbus’ 18 peer metros (population 1.5-2.5 million) per the Census, as well as the 14 largest Midwest metros. Since there was some overlap in the 2 groups, it made for a total group comparison of 27. So a fairly sizeable group. Next, I used the mile marker population, which in the City Hall census analysis is made up of circles going out from the center. So it’s just a matter of finding the area of each circle and dividing the population into that. What’s left is the density by area.
Density at Mile Marker 3, with an Area of 28.27 Square Miles 2000————————————2010 1. Chicago: 17,528.7_____________________ 1. Chicago: 18,003.2 2. San Jose, CA: 13,883.0________________ 2. San Jose, CA: 14,549.2 3. Las Vegas: 11,646.0___________________ 3. Las Vegas: 11,576.2 4. Minneapolis: 11,494.2_________________ 4. Minneapolis: 11,503.3 5. Milwaukee: 11,448.9___________________ 5. Milwaukee: 11,288.0 6. Providence: 11,173.7__________________ 6. Providence, RI: 11,240.2 7. Pittsburgh: 10,594.4__________________ 7. Pittsburgh: 9,738.7 8. San Antonio. TX: 9,234.3______________ 8. Portland, OR: 8,973.6 9. Portland, OR: 8,257.0_________________ 9. San Antonio, TX: 8,846.8 10. Cincinnati: 8,141.9__________________ 10. Columbus: 7,834.0 11. Columbus: 8,134.9____________________ 11. Sacramento, CA: 7,668.7 12. Sacramento, CA: 7,261.5______________ 12. Austin, TX: 7,534.0 13. Austin, TX: 7,232.3__________________ 13. Cincinnati: 7,273.6 14. Akron: 6,925.4_______________________ 14. Grand Rapids, MI: 6,540.0 15. Grand Rapids, MI: 6,852.0____________ 15. Akron: 6,284.9 16. Indianapolis: 6,727.9________________ 16. Orlando: 6,055.1 17. Toledo: 6,651.5______________________ 17. Omaha: 5,968.3 18. Dayton: 6,382.8______________________ 18. Toledo: 5,982.1 19. St. Louis: 6,093.7___________________ 19. Indianapolis: 5,879.9 20. Kansas City: 6,025.1_________________ 20. St. Louis: 5,663.8
Density at Mile Marker 4, with an Area of 50.27 Square Miles 2000———————————2010 1. Chicago: 15,447.2____________________ 1. Chicago: 15,205.9 2. San Jose, CA: 12,209.3_______________ 2. San Jose, CA: 12,629.6 3. Las Vegas: 9,788.0___________________ 3. Las Vegas: 10,022.2 4. Minneapolis: 8,874.4_________________ 4. Minneapolis: 8,921.8 5. Milwaukee: 8,823.8___________________ 5. Milwaukee: 8,725.5 6. Providence, RI: 8,454.3______________ 6. Providence, RI: 8,483.8 7. Pittsburgh: 8,216.0__________________ 7. Portland, OR: 7,785.5 8. Portland, OR: 7,282.9________________ 8. Pittsburgh: 7,602.6 9. San Antonio, TX: 7,208.6_____________ 9. San Antonio, TX: 6,995.5 10. Cincinnati: 6,922.8_________________ 10. Cincinnati: 6,279.4 11. Columbus: 6,449.3___________________ 11. Columbus: 6,257.4 12. Sacramento, CA: 5,744.7_____________ 12. Sacramento, CA: 6,138.5 13. Austin, TX: 5,541.5_________________ 13. Austin, TX: 5,847.2 14. St. Louis: 5,447.5__________________ 14. Omaha: 5,047.2 15. Cleveland: 5,356.2__________________ 15. St. Louis: 5,001.6 16. Indianapolis: 5,348.8_______________ 16. Grand Rapids, MI: 4,922.9 17. Detroit: 5,163.1____________________ 17. Orlando: 4,911.7 18. Omaha: 5,019.8______________________ 18. Indianapolis: 4,793.5 19. Akron: 4,900.7______________________ 19. Akron: 4,532.0 20. Dayton: 4,889.3_____________________ 20. Cleveland: 4,521.8
Density at Mile Marker 5, with an Area of 78.54 Square Miles Note that this area size is about the current city size of Cincinnati and Cleveland. 2000————————————2010 1. Chicago: 14,213.6___________________ 1. Chicago: 13,591.0 2. San Jose, CA: 10,464.0______________ 2. San Jose, CA: 11,037.1 3. Las Vegas: 8,521.9__________________ 3. Las Vegas: 9,062.8 4. Minneapolis: 7,443.0________________ 4. Minneapolis: 7,455.9 5. Milwaukee: 7,081.2__________________ 5. Milwaukee: 7,029.1 6. Pittsburgh: 7,009.9_________________ 6. Pittsburgh: 6,492.7 7. San Antonio, TX: 6,326.6____________ 7. Portland, OR: 6,442.3 8. Providence, RI: 6,048.3_____________ 8. San Antonio, TX: 6,223.4 9. Portland, OR: 5,950.1_______________ 9. Providence, RI: 6,055.8 10. Cincinnati: 5,588.9________________ 10. Sacramento, CA: 5,664.2 11. Cleveland: 5,494.6_________________ 11. Orlando: 5,274.1 12. Columbus: 5,252.9__________________ 12. Columbus: 5,152.1 13. Sacramento, CA: 5,104.0____________ 13. Cincinnati: 5,096.2 14. Orlando: 4,993.7___________________ 14. Austin, TX: 4,993.7 15. Austin, TX: 4,786.5________________ 15. Cleveland: 4,602.4 16. Detroit: 4,748.7___________________ 16. St. Louis: 4,285.4 17. St. Louis: 4,731.5_________________ 17. Indianapolis: 4,086.1 18. Indianapolis: 4,447.7______________ 18. Omaha: 3,962.2 19. Akron: 4,025.9_____________________ 19. Grand Rapids, MI: 3,887.3 20. Grand Rapids, MI: 3,990.6__________ 20. Akron: 3,778.8
So if Columbus was the same size as Cincinnati and Cleveland, it would be the most dense city of the 3. And it’s generally in the top half of the grouping in its most urban areas.
But what about further out, past the urban core?
Density at Mile Marker 10, with an Area of 314.16 Square Miles. This area size is much larger than the city limits of Columbus, but it gives an idea of the larger area’s density and not just within the city limits. 2000———————————–2010 1. Chicago: 9,344.3______________________ 1. Chicago: 8,795.0 2. San Jose, CA: 4,563.2_________________ 2. San Jose, CA: 4,809.8 3. Minneapolis: 4,183.2__________________ 3. Las Vegas: 4,794.2 4. Detroit: 4,117.4______________________ 4. Portland, OR: 4,230.3 5. Las Vegas: 3,877.3____________________ 5. Minneapolis: 4,178.3 6. Portland: 3,780.8_____________________ 6. San Antonio, TX: 3,454.9 7. Cleveland: 3,308.4____________________ 7. Detroit: 3,354.7 8. Pittsburgh: 3,279.8___________________ 8. Columbus: 3,163.9 9. San Antonio, TX: 3,217.8______________ 9. Pittsburgh: 3,080.4 10. Milwaukee: 3,013.7___________________ 10. Orlando: 3,055.0 11. Columbus: 2,973.3____________________ 11. Sacramento, CA: 3,016.4 12. St. Louis: 2,937.6___________________ 12. Milwaukee: 3,006.2 13. Cincinnati: 2,873.4__________________ 13. Cleveland: 2,923.7 14. Orlando: 2,783.9_____________________ 14. Indianapolis: 2,772.6 15. Sacramento, CA: 2,736.7______________ 15. St. Louis: 2,751.3 16. Indianapolis: 2,652.6________________ 16. Cincinnati: 2,746.8 17. Kansas City: 2,599.0_________________ 17. Kansas City: 2,538.3 18. Providence, RI: 2,360.0______________ 18. Austin, TX: 2,439.6 19. Austin, TX: 2,111.3__________________ 19. Providence, RI: 2,375.1 20. Dayton: 1,920.7______________________ 20. Charlotte, NC: 2,332.7
So what does all this tell us? That while Columbus is not the most dense city of its peer group, or within the Midwest group, it probably does not wholly deserve its low-density, suburban reputation. Most of the measurements are in the top half of the grouping for density, yes, but it is clearly the most weak in the urban core closest to Downtown, as that ranking is the lowest for it. The Mile 0 population, for example, is down near the very bottom, and that is a good reason why densities are not as high as they should/could be. Currently, Downtown and surrounding neighborhoods are seeing a residential development boom, so that will help, but the city needs to think a lot bigger if it wants that stereotype to truly go away. The recent abandonment of the Convention Center mixed-use project is not a good way to go about that goal… and it should be a goal.