New 2023 population estimates of Columbus metro places were just released by the US Census. In general, they showed that most places are now recovering from the pandemic population decline blip.
First, the full list of all available population estimates for Columbus metro area incorporated places. This list does not include Census Designated Places, as estimates for those are only done once per decade. Red places have moved down in the rankings, green have moved up.
2023 Population Estimates by Columbus Metro Places
Rank
2020
2023
1
Columbus: 905,939
Columbus: 913,175
2
Newark: 49,948
Newark: 51,046
3
Dublin: 49,313
Dublin: 48,923
4
Delaware: 41,327
Delaware: 45,158
5
Grove City: 41,244
Grove City: 42,782
6
Reynoldsburg: 41,070
Lancaster: 41,422
7
Lancaster: 40,540
Reynoldsburg: 41,220
8
Westerville: 39,194
Westerville: 37,958
9
Hilliard: 37,113
Hilliard: 37,262
10
Upper Arlington: 36,795
Upper Arlington: 35,743
11
Gahanna: 35,726
Gahanna: 35,159
12
Marysville: 25,585
Marysville: 28,423
13
Pickerington: 23,100
Pickerington: 25,256
14
Whitehall: 20,127
Whitehall: 19,727
15
Pataskala: 17,883
Patakala: 18,346
16
Worthington: 14,783
Worthington: 14,497
17
Powell: 14,250
Powell: 14,491
18
Bexley: 13,925
Circleville: 14,452
19
Circleville: 13,925
Bexley: 12,785
20
New Albany: 11,053
New Albany: 11,335
21
Heath: 10,414
Heath: 10,693
22
London: 10,272
London: 10,533
23
Canal Winchester: 9,119
Canal Winchester: 9,777
24
Grandview Heights: 8,085
Grandview Heights: 8,841
25
Logan: 7,292
Sunbury: 8,340
26
Sunbury: 6,610
Logan: 7,166
27
Groveport: 6,009
Obetz: 6,971
28
Granville: 5,950
Granville: 6,281
29
Obetz: 5,483
Groveport: 5,806
30
Johnstown: 5,183
Johnstown: 5,310
31
Ashville: 4,533
Ashville: 4,760
32
New Lexington: 4,430
West Jefferson: 4,488
33
West Jefferson: 4,145
New Lexington: 4,447
34
Plain City: 4,103
Plain City: 4,338
35
Mount Gilead: 3,499
Mount Gilead: 3,533
36
Commercial Point: 3,079
Commercial Point: 3,215
37
Baltimore: 2,980
Baltimore: 2,991
38
Buckeye Lake: 2,516
Lithopolis: 2,708
39
Crooksville: 2,421
South Bloomfield: 2,660
40
Hebron: 2,325
Buckeye Lake: 2,588
41
Richwood: 2,222
Richwood: 2,494
42
South Bloomfield: 2,147
Crooksville: 2,402
43
Lithopolis: 2,142
Hebron: 2,384
44
Cardington: 2,079
Utica: 2,115
45
Utica: 2,067
Cardington: 2,101
46
Minerva Park: 2,012
Mount Sterling: 2,030
47
Mount Sterling: 1,944
Minerva Park: 1,944
48
Roseville: 1,745
Roseville: 1,740
49
Somerset: 1,482
Bremen: 1,502
50
Bremen: 1,478
Somerset: 1,473
51
Hanover: 1,271
Ashley: 1,318
52
Ashley: 1,201
Hanover: 1,317
53
Ostrander: 1,094
Ostrander: 1,197
54
Thornville: 1,083
Thornville: 1,092
55
Urbancrest: 1,031
Galena: 1,018
56
Millersport: 977
Williamsport: 1,012
57
Williamsport: 972
Urbancrest: 996
58
Pleasantville: 943
Millersport: 975
59
Galena: 929
Pleasantville: 951
60
Shawnee Hills: 836
Shawnee Hills: 915
61
Milford Center: 805
Milford Center: 903
62
New Holland: 803
New Holland: 830
63
Junction City: 722
Junction City: 720
64
Amanda: 669
Marble Cliff: 699
65
Valleyview: 668
Amanda: 680
66
New Straitsville: 653
New Straitsville: 651
67
Marble Cliff: 638
Valleyview: 647
68
Thurston: 606
Thurston: 605
69
Riverlea: 596
Stoutsville: 577
70
Stoutsville: 578
Riverlea: 575
71
Buchtel: 519
Buchtel: 513
72
Laurelville: 512
Shawnee: 500
73
Shawnee: 504
Carroll: 500
74
Carroll: 501
Laurelville: 498
75
Corning: 489
Alexandria: 490
76
Alexandria: 481
Corning: 485
77
Kirkersville: 468
Kirkersville: 477
78
Sugar Grove: 427
Edison: 441
79
Edison: 420
Sugar Grove: 425
80
Hartford: 401
Hartford: 404
81
St. Louisville: 351
St. Louisville: 363
82
Murray City: 345
Murray City: 336
83
South Solon: 326
South Solon: 326
84
Harrisburg: 313
Harrisburg: 309
85
Rushville: 306
Rushville: 304
86
Marengo: 280
Magnetic Springs: 293
87
Midway: 269
Marengo: 280
88
Magnetic Springs: 261
Midway: 269
89
Tarlton: 254
Tarlton: 264
90
Fulton: 249
Fulton: 249
91
Unionville Center: 239
Unionville Center: 234
92
Lockbourne: 237
Lockbourne: 229
93
Gratiot: 214
Gratiot: 216
94
Chesterville: 194
Chesterville: 195
95
Darbyville: 185
Darbyville: 189
96
West Rushville: 165
West Rushville: 165
97
Glenford: 165
Glenford: 164
98
Hemlock: 145
Hemlock: 145
99
Sparta: 122
Sparta: 123
100
Brice: 94
Brice: 91
Out of Ohio’s 925 incorporated communities, 660 showed a population loss between 2020-2023, or 71.35%. 27 saw no population change, and 238- or 25.73%- saw population growth. In the Columbus metro, however, 60% of its communities saw growth, with 6% seeing no change and 34% seeing a loss. The Columbus metro places represented just 5.15% of the total communities seeing loss within the state, but 25.73% of all the communities seeing growth. This shows just how poorly most of the state is doing in comparison to the Columbus area.
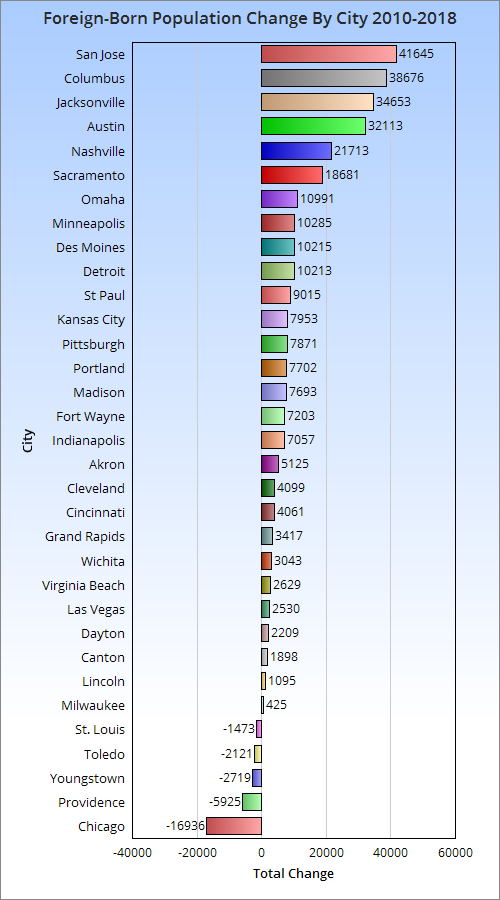
In the ongoing series discussing topics related to the 2018 Census demographic estimates, today I will update the foreign-born comparison. Beyond the simple comparison, I will also talk about the regions and countries that the foreign-born populations come from.
Total Foreign-Born Population Rank by City 2010 and 2018 2010————————————-——-2018 1. Chicago: 557,674—————1. Chicago: 540,738 2. San Jose: 366,194————-2. San Jose: 407,839 3. Austin: 148,431—————-3. Austin: 180,544 4. Las Vegas: 130,503———–4. Las Vegas: 133,033 5. Sacramento: 96,105———-5. Columbus: 125,339 6. Columbus: 86,663————-6. Sacramento: 114,786 7. Portland: 83,026—————7. Jacksonville: 111,798 8. Jacksonville: 77,145——–8. Nashville: 95,040 9. Indianapolis: 74,707——–9. Portland: 90,728 10. Nashville: 73,327———-10. Indianapolis: 81,764 11. Minneapolis: 57,846——11. Minneapolis: 68,131 12. Milwaukee: 57,222——–12. St. Paul: 59,381 13. Providence: 52,920——-13. Milwaukee: 57,647 14. St. Paul: 50,366———–14. Omaha: 50,279 15. Virginia Beach: 40,756—15. Providence ;46,995 16. Omaha: 39,288————16. Detroit: 44,520 17. Wichita: 39,128————17. Kansas City: 43,485 18. Kansas City: 35,532——18. Virginia Beach: 43,385 19. Detroit: 34,307————19. Wichita: 42,171 20. Madison: 24,929———20. Madison: 32,622 21. St. Louis: 23,011———-21. Des Moines: 31,013 22. Lincoln: 22,214———–22. Pittsburgh: 26,569 23. Des Moines: 20,798—–23. Lincoln: 23,309 24. Pittsburgh: 18,698——24. Fort Wayne: 22,489 25. Cleveland: 17,739——-25. Cleveland: 21,838 26. Grand Rapids: 16,615—26. St. Louis: 21,538 27. Cincinnati: 16,531——-27. Cincinnati: 20,592 28. Fort Wayne: 15,286—-28. Grand Rapids: 20,032 29. Toledo: 11,159———–29. Akron: 13,649 30. Akron: 8,524————30. Toledo: 9,038 31. Dayton: 5,102———–31. Dayton: 7,311 32. Youngstown: 3,695—-32. Canton: 3,241 33. Canton: 1,343———–33: Youngstown: 976
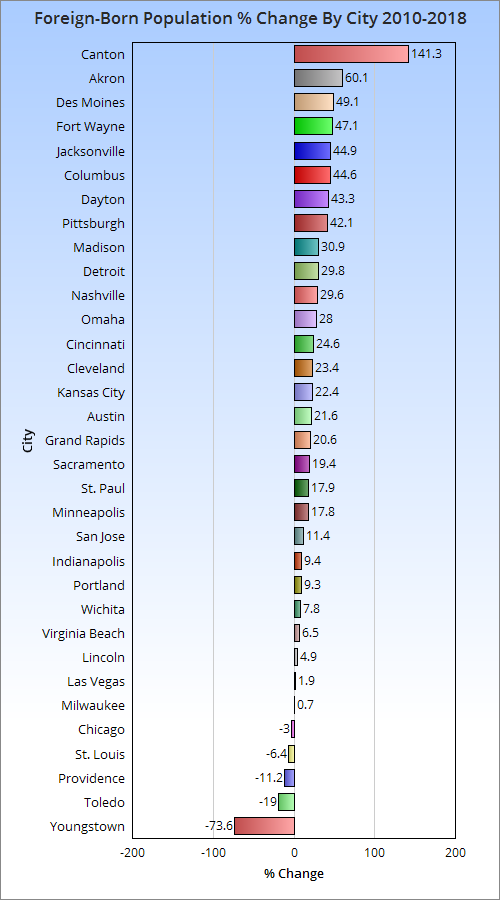
Here’s the 2010-2018 total change. And the 2010-2018 change by %.
Columbus has done very well in both total and % growth of its foreign-born population since 2010.
So now that we know how many foreign-born immigrants are arriving and how fast, let’s take a look at where they are coming from.
Total Foreign-Born Residents From Europe in 2000 and 2018 2000———————————————–2018 1. Chicago: 145,462———————1. Chicago: 91,397 2. San Jose: 21,904———————2. San Jose: 22,043 3. Portland: 17,572———————-3. Jacksonville: 18,808 4. Jacksonville: 10,883————4. Portland: 17,016 5. Las Vegas: 9,070—————-5. Austin: 11,981 6. Cleveland: 8,796—————-6. Las Vegas: 11,472 7. St. Louis: 8,543——————7. Columbus: 8,141 8. Sacramento: 8,204————-8. Nashville: 8,108 9. Milwaukee: 7,841—————9. Virginia Beach: 6,710 10. Austin: 7,474——————10. Sacramento: 6,275 11. Pittsburgh: 7,413————–11. Pittsburgh: 5,047 12. Columbus: 7,017————–12. Minneapolis: 5,031 13. Indianapolis: 6,543———–13. Omaha: 3,845 14. Virginia Beach: 6,333——–14. St. Louis: 4,711 15. Detroit: 5,600—————–15. Indianapolis: 4,199 16. Minneapolis: 5,409———–16. Omaha: 3,845 17. Providence: 5,126————-17. Milwaukee: 3,808 18. Nashville: 4,859—————18. Madison: 3,519 19. Cincinnati: 3,851————–19. Providence: 3,030 20. Grand Rapids: 3,396———20. Lincoln: 2,777 21. Omaha: 3,320—————–21. Cincinnati: 2,738 22. St. Paul: 3,255—————-22. St. Paul: 2,449 23. Des Moines: 3,216———–23. Grand Rapids: 2,336 24. Kansas City: 2,985———-24. Kansas City: 2,320 25. Madison: 2,871—————25. Fort Wayne: 2,235 26. Lincoln: 2,701—————-26. Wichita: 1,851 27. Akron: 2,687—————–27. Detroit: 1,767 28. Fort Wayne: 2076———–28. Akron: 1,580 29. Toledo: 2,020—————-29. Des Moines: 1,042 30. Wichita: 2,004————–30. Toledo: 496 31. Dayton: 901——————31. Canton: 347 32. Youngstown: 870———–32. Dayton: 347 33. Canton: 590—————–33. Youngstown: 337
Columbus had more European immigrants than most in 2000 and 2018, and was one of the relatively few cities that saw an increase by 2018.
Total Foreign-born Population from Asia 2000 and 2018 2000————————————————–2018 1. San Jose: 182,712—————————1. San Jose: 256,504 2. Chicago: 112,932—————————2. Chicago: 144,970 3. Sacramento: 40,253———————3. Austin: 59,711 4. Portland: 26,271—————————4. Sacramento: 56,084 5. Austin: 25,036——————————5. Columbus: 49,185 6. St. Paul: 23,245———————-6. Portland: 42,245 7. Columbus: 22,354——————-7. Jacksonville: 39,543 8. Jacksonville: 17,427—————–8. Las Vegas: 35,959 9. Minneapolis: 17,376—————–9. St. Paul: 34,246 10. Las Vegas: 17,062—————–10. Nashville: 28,142 11. Virginia Beach: 15,176————-11. Indianapolis: 24,992 12. Detroit: 15,114———————-12. Virginia Beach: 21,954 13. Nashville: 12,573——————-13. Milwaukee: 18,192 14. Milwaukee: 12,114——————14. Minneapolis: 17,929 15. Wichita: 10,826——————–15. Detroit: 17,474 16. Madison: 9,736——————–16. Madison: 17,021 17. Indianapolis: 9,190—————-17. Omaha: 14,582 18. Pittsburgh: 7,938—————–18. Wichita: 14,107 19. Providence: 7,871—————–19. Kansas City: 13,753 20. Kansas City: 7,312—————-20. Des Moines: 13,139 21. Lincoln: 6,691———————-21. Pittsburgh: 12,929 22. St. Louis: 6,425——————–22. Lincoln: 11,233 23. Omaha: 6,302 ———————23. Fort Wayne: 10,809 24. Cleveland: 6,213——————-24. Cleveland: 10,351 25. Des Moines: 5,239—————-25. St. Louis: 9,505 26. Cincinnati: 4,326——————26. Akron: 8,391 27. Toledo: 3,847———————-27. Providence: 7,744 28. Grand Rapids: 3,206————–28. Cincinnati: 5,599 29. Akron: 3,099———————–29. Toledo: 3,597 30. Fort Wayne: 2,792—————–30. Grand Rapids: 3,369 31. Dayton: 903————————-31. Dayton: 2,575 32. Youngstown: 338——————32. Canton: 542 33. Canton: 296————————33. Youngstown: 196
Columbus ranks even higher with its foreign-born Asian population.
Total Foreign-born Population from Africa 2000 and 2018 2000—————————————————2018 1. Minneapolis: 12,765——————–1. Columbus: 45,092 2. Chicago: 12,613————————-2. Minneapolis: 26,271 3. Columbus: 9,530———————–3. Chicago: 25,573 4. San Jose: 5,189————————-4. Nashville: 18,423 5. St. Paul: 4,697———————5. Indianapolis: 14,965 6. Nashville: 4,183——————-6. St. Paul: 13,594 7. Detroit:: 3,249———————7. Austin: 9,961 8. Providence: 3,138—————-8. Kansas City: 8,558 9. Indianapolis: 2,650—————9. San Jose: 8,546 10. Portland: 2,430—————–10. Cincinnati: 7,113 11. Austin 2,263———————11. Des Moines: 6,191 12. Kansas City: 2,192————–12. Omaha: 5,474 13. Cincinnati: 1,781—————-13. Grand Rapids: 3,932 14. Jacksonville: 1,719————-14. Portland: 3,899 15. St. Louis: 1,500—————–15. St. Louis: 3,777 16. Omaha: 1,497——————-16. Providence: 3,571 17. Milwaukee: 1,332—————17. Milwaukee: 3,552 18. Cleveland: 1,075—————-18. Jacksonville: 3,426 19. Sacramento: 1,051————-19. Lincoln: 2,942 20. Des Moines: 1,038————-20. Wichita: 2,752 21. Madison: 991——————–21. Madison: 2,599 22. Wichita: 946——————–22. Detroit: 2,081 23. Las Vegas: 916—————–23. Pittsburgh: 1,909 24. Pittsburgh: 905—————-24. Sacramento: 1,784 25. Virginia Beach: 840———–25. Virginia Beach: 1,783 26. Grand Rapids: 718————-26. Fort Wayne: 1,614 27. Toledo: 638——————–27. Dayton: 1,573 28. Lincoln: 637——————–28. Akron: 1,312 29. Dayton: 522——————–29. Las Vegas: 1,206 30. Fort Wayne: 384————–30. Cleveland: 622 31. Akron: 197———————-31. Toledo: 416 32. Canton: 89———————32. Youngstown: 277 33. Youngstown: 50—————33. Canton: 95
Columbus has claimed the number 1 spot in its foreign-born African population, passing previous top city Minneapolis.
And finally, the total foreign-born population from the Americas in 2000 and 2018 2000—————————————————-2018 1. Chicago: 357,235————————–1. Chicago: 277,742 2. San Jose: 117,989————————2. San Jose: 119,455 3. Austin: 73,935———————-3. Austin: 97,933 4. Las Vegas: 63,277——————4. Las Vegas: 83,782 5. Sacramento: 28,927—————5. Jacksonville: 49,339 6. Providence: 27,649—————-6. Sacramento: 42,722 7. Milwaukee: 24,781——————7. Nashville: 39,633 8. Detroit: 21,527———————-8. Indianapolis: 37,287 9. Portland: 20,939——————-9. Providence: 32,650 10. Minneapolis: 19,648————-10. Milwaukee: 31,917 11. Indianapolis: 17,530————–11. Omaha: 26,012 12. Nashville: 17,125——————12. Wichita: 23,429 13. Omaha: 14,467——————–13. Detroit: 23,198 14. Wichita:: 13,988——————14. Columbus: 22,469 15. Grand Rapids: 13,477————15. Portland: 20,407 16. Kansas City: 12,948————–16. Minneapolis: 18,765 17. Jacksonville: 11,881—————17. Kansas City: 18,170 18. St.Paul: 9,804———————18. Virginia Beach: 12,667 19. Columbus: 8,596—————–19. Des Moines: 10,675 20. Des Moines: 6,201—————20. Grand Rapids: 10,395 21. Virginia Beach: 5,754————21. Madison: 9,349 22. Cleveland: 5,192—————–22. St. Paul: 9,070 23. Madison: 5,080——————23. Fort Wayne: 7,831 24. Fort Wayne: 4,930————–24. Lincoln: 6,280 25. Lincoln: 3,106——————–25. Pittsburgh: 5,898 26. St. Louis: 2,961——————-26. Cleveland: 5,810 27. Toledo: 2,942———————27. Cincinnati: 4,901 28. Pittsburgh: 2,463—————-28. Toledo: 4,347 29. Cincinnati: 2,432—————–29. St. Louis: 3,545 30. Dayton: 919———————-30. Dayton: 2,816 31. Akron: 891————————31. Akron: 2,366 32. Canton: 347———————-32. Canton: 2,257 33. Youngstown: 333—————33. Youngstown: 166
Columbus does the worst with this group, but even here it moved up 5 spots in the rankings.
The rest of the foreign-born population is made up of small groups of people from Oceania- or basically island nations.
Yesterday, the US Census released tons of new demographic data for 2018. The next few posts will detail some of that data and how Columbus compares to Midwestern and national peers in terms of population, racial diversity and other metrics. These peers are based on either large Midwestern cities or metro areas between 1.5-2.5 million. This post will be a racial diversity comparison, specifically.
Total Non-Hispanic White Population by City by Year 2010———————————–2018 1. Chicago: 853,910————–1. Chicago: 899,980 2. Indianapolis: 482,195———2. Columbus: 486,431 3. Columbus: 470,971———–3. Austin: 470,620 4. Jacksonville, FL: 452,926—-4. Indianapolis: 465,466 5. Portland, OR: 417,876——–5. Portland: 457,042 6. Austin: 384,065—————6. Jacksonville: 455,487 7. Virginia Beach: 282,812——7. Omaha: 307,845 8. Las Vegas: 280,604———-8. Virginia Beach: 275,371 9. Omaha, NE: 277,606———9. Las Vegas: 272,870 10. San Jose, CA: 265,311——10. Kansas City: 269,854 11. Kansas City, MO: 247,473–11. San Jose: 253,571 12. Wichita, KS: 245,146——-12. Minneapolis: 252,327 13. Minneapolis: 242,848——13. Wichita: 242,671 14. Milwaukee: 221,514——–14. Lincoln: 227,215 15. Lincoln, NE: 216,076——-15. Milwaukee: 204,250 16. Pittsburgh: 203,622——–16. Pittsburgh: 195,468 17. Fort Wayne, IN: 179,646—17. Madison: 186,034 18. Madison, WI: 178,307——18. Fort Wayne: 173,088 19. Toledo: 177,341————–19. St. Paul: 159,782 20. Sacramento, CA: 165,610–20. Sacramento: 158,333 21. St. Paul, MN: 159,704——-21. Toledo: 157,967 22. Des Moines, IA: 145,937—22. Cincinnati: 150,693 23. Cincinnati: 143,120———23. Des Moines: 137,268 24. Cleveland: 137,977———24. St. Louis: 133,688 25. St. Louis: 134,146———–25. Cleveland: 131,010 26. Grand Rapids, MI: 104,636–26. Grand Rapids: 115,719 27. Providence, RI: 64,284——27. Detroit: 72,982 28. Detroit: 55,298————–28. Providence: 58,856
Previous peers, such as San Antonio, Charlotte and Orlando were removed as their metros are now larger than the 2.5 million comparison limit. Jacksonville, Florida entered the comparison with a metro population of just over 1.5 million in 2018. Smaller Ohio cities like Dayton, Akron, Canton and Youngstown, which are normally compared, did not have this data available.
Total Non-Hispanic White Change 2010-2018 1. Austin: +86,555 2. Chicago: +46,070 3. Portland: +39,166 4. Omaha: +30,239 5. Kansas City: +22,381 6. Detroit: +17,684 7. Columbus: +15,460 8. Lincoln: +11,139 9. Grand Rapids: +11,083 10. Minneapolis: +9,479 11. Madison: +7,727 12. Cincinnati: +7,573 13. Jacksonville: +2,561 14. St. Paul: +28 15. St. Louis: -458 16. Wichita: -2,475 17. Providence: -5,428 18. Fort Wayne: -6,558 19. Cleveland: -6,967 20. Sacramento: -7,277 21. Virginia Beach: -7,441 22. Las Vegas: -7,734 23. Pittsburgh: -8,154 24. Des Moines: -8,669 25. San Jose: -11,740 26. Indianapolis: -16,729 27. Milwaukee: -17,264 28. Toledo: -19,374
Non-Hispanic White % of Total Population by City in 2018 1. Lincoln: 79.1% 2. Madison: 72.1% 3. Portland: 70.0% 4. Omaha: 65.7% 5. Fort Wayne: 65.5% 6. Pittsburgh: 64.9% 7. Des Moines: 63.3% 8. Wichita: 62.3% 9. Virginia Beach: 61.2% 10. Minneapolis: 59.3% 11. Grand Rapids: 57.8% 12. Toledo: 57.5% 13. Kansas City: 54.9% 14. Columbus: 54.3% 15. Indianapolis: 53.9% 16. St. Paul: 51.9% 17. Jacksonville: 50.4% 18. Cincinnati: 49.8% 19. Austin: 48.8% 20. St. Louis: 44.2% 21. Las Vegas: 42.3% 22. Milwaukee: 34.5% 23. Cleveland: 34.1% 24. Chicago: 33.3% 25. Providence: 32.8% 26. Sacramento: 31.1% 27. San Jose: 24.6% 28. Detroit: 10.9%
Total Non-Hispanic Black Population by City by Year 2010————————————2018 1. Chicago: 895,294————1. Chicago: 784,266 2. Detroit: 587,707————–2. Detroit: 520,161 3. Jacksonville: 249,532——-3. Jacksonville: 274,290 4. Milwaukee: 230,473——–4. Columbus: 259,803 5. Indianapolis: 226,314——-5. Indianapolis: 251,958 6. Columbus: 216,486———6. Milwaukee: 222,619 7. Cleveland: 208,528———7. Cleveland: 178,909 8. St. Louis: 157,382———–8. Kansas City: 137,867 9. Kansas City: 138,461——-9. St. Louis: 137,087 10. Cincinnati: 131,909——-10. Cincinnati: 122,261 11. Virginia Beach: 79,583—11. Virginia Beach: 84,333 12. Toledo: 75,033————12. Minneapolis: 81,930 13. Pittsburgh: 71,539——-13. Austin: 78,354 14. Minneapolis: 63,749—–14. Toledo: 74,630 15. Sacramento: 61,976—–15. Pittsburgh: 68,637 16. Austin: 61,833————16. Las Vegas: 68,488 17. Las Vegas: 60,187——–17. Sacramento: 64,824 18. Omaha: 55,086———–18. Omaha: 56,503 19. Wichita: 42,662———-19. St. Paul: 44,572 20. St. Paul: 41,923———-20. Wichita: 42,874 21. Grand Rapids: 41,848—21. Fort Wayne: 40,640 22. Fort Wayne: 39,016—–22. Portland: 39,882 23. Portland: 37,355——–23. Grand Rapids: 35,264 24. San Jose: 29,831——–24. San Jose: 29,432 25. Des Moines: 19,962—-25. Providence: 26,594 26. Providence: 19,265—–26. Des Moines: 24,018 27. Madison: 17,560——–27. Madison: 20,276 28. Lincoln: 9,023———-28. Lincoln: 12,203
Total Non-Hispanic Black Change 2010-2018 1. Columbus: +43,317 2. Indianapolis: +25,644 3. Jacksonville: +24,758 4. Minneapolis: +18,181 5. Austin: +16,521 6. Las Vegas: +8,301 7. Providence: +7,329 8. Virginia Beach: +4,750 9. Des Moines: +4,056 10. Lincoln: +3,180 11. Sacramento: +2,848 12. Madison: +2,716 13. St. Paul: +2,649 14. Portland: +2,527 15. Fort Wayne: +1,624 16. Omaha: +1,417 17. Wichita: +212 18. San Jose: -399 19. Toledo: -403 20. Kansas City: -594 21. Pittsburgh: -2,902 22. Grand Rapids: -6,584 23. Milwaukee: -7,854 24. Cincinnati: -9,648 25. St. Louis: -20,295 26. Cleveland: -29,619 27. Detroit: -67,546 28. Chicago: -111,028
Non-Hispanic Black % of Total Population by City in 2018 1. Detroit: 77.3% 2. Cleveland: 46.6% 3. St. Louis: 45.3% 4. Cincinnati: 40.4% 5. Milwaukee: 37.7% 6. Jacksonville: 30.4% 7. Indianapolis: 29.2% 8. Columbus: 29.0% 9. Chicago: 29.0% 10. Kansas City: 28.0% 11. Toledo: 27.1% 12. Pittsburgh: 22.8% 13. Minneapolis: 19.3% 14. Virginia Beach: 18.7% 15. Grand Rapids: 17.6% 16. Fort Wayne: 15.4% 17. Providence: 14.8% 18. St. Paul: 14.5% 19. Sacramento: 12.8% 20. Omaha: 12.1% 21. Des Moines: 11.1% 22. Wichita: 11.0% 23. Las Vegas: 10.6% 24. Austin: 8.1% 25. Madison: 7.9% 26. Portland: 6.1% 27. Lincoln: 4.3% 28. San Jose: 2.9%
Total Non-Hispanic Asian Population by City by Year 2010——————————-2018 1. San Jose: 303,227————1. San Jose: 367,280 2. Chicago: 148,280————2. Chicago: 179,841 3. Sacramento: 84,556——–3. Sacramento: 97,192 4. Austin: 46,575—————4. Austin: 73,185 5. Portland: 43,185————5. St. Paul: 59,395 6. St. Paul: 41,989————–6. Portland: 57,526 7. Las Vegas: 37,406———-7. Columbus: 54,902 8. Columbus: 35,468———-8. Las Vegas: 46,422 9. Jacksonville: 33,663——–9. Jacksonville: 42,639 10. Virginia Beach: 27,303—10. Virginia Beach: 31,875 11. Milwaukee: 22,670——–11. Indianapolis: 31,777 12. Minneapolis: 21,426——12. Minneapolis: 26,768 13. Wichita: 19,420———-13. Milwaukee: 25,17 14. Indianapolis: 17,137——14. Madison: 23,594 15. Madison: 16,671———-15. Wichita: 17,410 16. Pittsburgh: 12,036——-16. Omaha: 17,185 17. Providence: 11,497——-17. Pittsburgh: 16,724 18. Lincoln: 10,452———–18. Des Moines: 15,057 19. Kansas City: 10,263—–19. Fort Wayne: 13,661 20. Des Moines: 8,867——20. Providence: 12,556 21. St. Louis: 8,717———–21. Lincoln: 12,494 22. Omaha: 8,397———–22. Kansas City: 12,130 23. Fort Wayne: 6,945—–23. St. Louis: 10,662 24. Detroit: 6,549———-24. Detroit: 10,597 25. Cincinnati: 5,938——25. Cleveland: 10,595 26. Cleveland: 5,392——26. Cincinnati: 6,999 27. Grand Rapids: 3,695–27. Grand Rapids: 4,431 28. Toledo: 3,125———-28. Toledo: 2,802
Total Non-Hispanic Asian Change 2010-2018 1. San Jose: +64,053 2. Chicago: +31,561 3. Austin: +26,610 4. Columbus: +19,434 5. St. Paul: +17,406 6. Indianapolis: +14,640 7. Portland: +14,341 8. Sacramento: +12,636 9. Las Vegas: +9,016 10. Jacksonville: +8,976 11. Omaha: +8,788 12. Madison: +6,923 13. Fort Wayne: +6,716 14. Des Moines: +6,190 15. Minneapolis: +5,342 16. Cleveland: +5,203 17. Pittsburgh: +4,688 18. Virginia Beach: +4,572 19. Detroit: +4,048 20. Milwaukee: +2,501 21. Lincoln: +2,042 22. St. Louis: +1,945 23. Kansas City: +1,867 24. Cincinnati: +1,061 25. Providence: +1,059 26. Grand Rapids: +736 27. Toledo: -323 28. Wichita: -2,010
Non-Hispanic Asian % of Total Population by City in 2018 1. San Jose: 35.7% 2. St. Paul: 19.3% 3. Sacramento: 19.1% 4. Madison: 9.1% 5. Portland: 8.8% 6. Austin: 7.6% 7. Las Vegas: 7.2% 8. Virginia Beach: 7.1% 9. Providence: 7.0% 10. Des Moines: 6.9% 11. Chicago: 6.7% 12. Minneapolis: 6.3% 13. Columbus: 6.1% 14. Pittsburgh: 5.6% 15. Fort Wayne: 5.2% 16. Jacksonville: 4.7% 17. Wichita: 4.5% 18. Lincoln: 4.4% 19. Milwaukee: 4.3% 20. Indianapolis: 3.7% 21. Omaha: 3.7% 22. St. Louis: 3.5% 23. Cleveland: 2.8% 24. Kansas City: 2.5% 25. Cincinnati: 2.3% 26. Grand Rapids: 2.2% 27. Detroit: 1.6% 28. Toledo: 1.0%
Total Hispanic Population by City By Year 2010———————————2018 1. Chicago: 763,968————-1. Chicago: 776,661 2. San Jose: 318,389————2. San Jose: 333,819 3. Austin: 288,130—————3. Austin: 314,949 4. Las Vegas: 181,923———–4. Las Vegas: 222,860 5. Sacramento: 124,461———5. Sacramento: 148,343 6. Milwaukee: 104,619———-6. Milwaukee: 119,876 7. Indianapolis: 78,467———-7. Jacksonville: 94,158 8. Providence: 76,645———-8. Indianapolis: 88,022 9. Jacksonville: 64,081———-9. Providence: 75,177 10. Wichita: 59,823————-10. Wichita: 70,564 11. Portland: 58,986————11. Omaha: 68,747 12. Omaha: 53,661————–12. Portland: 60,760 13. Kansas City: 49,800——–13. Columbus: 53,935 14. Detroit : 45,580————-14. Detroit: 52,718 15. Columbus: 43,276———-15. Kansas City: 52,638 16. Cleveland: 36,067———-16. Cleveland: 47,144 17. Minneapolis: 34,504——-17. Minneapolis: 40,912 18. Grand Rapids: 30,659—–18. Virginia Beach: 37,365 19. Virginia Beach: 29,206—-19. Grand Rapids: 36,469 20. St. Paul: 28,725————20. Des Moines: 31,706 21. Des Moines: 23,832——-21. St. Paul: 26,081 22. Toledo: 21,346————-22. Toledo: 24,625 23. Fort Wayne: 19,576——-23. Fort Wayne: 24,623 24. Lincoln: 16,007————24. Lincoln: 22,339 25. Madison: 14,062———-25. Madison: 18,867 26. St. Louis: 11,207———–26. St. Louis: 12,509 27. Cincinnati: 8,710———-27. Cincinnati: 10,773 28. Pittsburgh: 7,282———28. Pittsburgh: 10,180
Total Hispanic Population Change 2010-2018 1. Las Vegas: +40,937 2. Jacksonville: +30,077 3. Austin: +26,819 4. Sacramento: +23,882 5. San Jose: +15,430 6. Milwaukee: +15,257 7. Omaha: +15,086 8. Chicago: +12,693 9. Cleveland: +11,077 10. Wichita: +10,741 11. Columbus: +10,659 12. Indianapolis: +9,555 13. Virginia Beach: +8,159 14. Des Moines: +7,874 15. Detroit: +7,138 16. Minneapolis: +6,408 17. Lincoln: +6,332 18. Grand Rapids: +5,810 19. Fort Wayne: +5,047 20. Madison: +4,805 21. Toledo: +3,279 22. Pittsburgh: +2,898 23. Kansas City: +2,838 24. Cincinnati: +2,063 25. Portland: +1,774 26. St. Louis: +1,302 27. Providence: -1,468 28. St. Paul: -2,644
Hispanic % of Total Population by City in 2018 1. Providence: 41.9% 2. Las Vegas: 34.6% 3. Austin: 32.7% 4. San Jose: 32.4% 5. Sacramento: 29.2% 6. Chicago: 28.7% 7. Milwaukee: 20.3% 8. Grand Rapids: 18.2% 9. Wichita: 18.1% 10. Omaha: 14.7% 11. Des Moines: 14.6% 12. Cleveland: 12.3% 13. Kansas City: 10.7% 14. Jacksonville: 10.4% 15. Indianapolis: 10.2% 16. Minneapolis: 9.6% 17. Portland: 9.3% 18. Fort Wayne: 9.3% 19. Toledo: 9.0% 20. St. Paul: 8.5% 21. Virginia Beach: 8.3% 22. Detroit: 7.8% 23. Lincoln: 7.8% 24. Madison: 7.3% 25. Columbus: 6.0% 26. St. Louis: 4.1% 27. Cincinnati: 3.6% 28. Pittsburgh: 3.4%
Total Non-Hispanic Other Population by City by Year 2010——————————–2018 1. Chicago: 37,379————–1. Chicago: 65,240 2. San Jose: 32,439————-2. San Jose: 46,017 3. Sacramento: 30,900——–3. Columbus: 40,806 4. Portland: 28,027————-4. Sacramento: 39,825 5. Las Vegas: 24,521———–5. Portland: 37,363 6. Columbus: 23,738———–6. Jacksonville: 37,322 7. Jacksonville: 23,114———-7. Las Vegas: 34,024 8. Minneapolis: 20,753———8. Austin: 27,135 9. Virginia Beach: 20,268——9. Indianapolis: 26,908 10. Indianapolis: 20,086——10. Minneapolis: 23,458 11. Detroit: 16,776————-11. Virginia Beach: 21,245 12. Milwaukee: 16,311——– 12. Kansas City: 19,320 13. Wichita: 16,091————13. Milwaukee: 19,286 14. Omaha: 15,519————14. Omaha: 17,987 15. Austin: 14,915————-15. St. Paul: 17,871 16. Kansas City: 14,668——16. Detroit: 16,223 17. St. Paul: 13,098———–17. Cleveland: 16,123 18. Pittsburgh: 11,280——-18. Wichita: 15,740 19. Toledo: 10,134————19. Toledo: 14,949 20. Fort Wayne: 8,513——-20. Lincoln: 13,148 21. Cleveland: 8,276———21. Fort Wayne: 12,158 22. St. Louis: 7,704———-22. Cincinnati: 11,889 23. Lincoln: 7,483———–23. Pittsburgh: 10,029 24. Grand Rapids: 7,376—24. Madison: 9,263 25. Cincinnati: 7,230——-25. Des Moines: 8,944 26. Madison: 7,177———26. St. Louis: 8,892 27. Providence: 6,471——27: Grand Rapids: 8,347 28. Des Moines: 5,598—–28. Providence: 6,152
Total Non-Hispanic Other Population Change 2010-2018 1. Chicago: +27,861 2. Columbus; +17,068 3. Jacksonville: +14,208 4. San Jose: +13,578 5. Austin: +12,220 6. Las Vegas: +9,503 7. Portland: +9,336 8. Sacramento: +8,925 9. Cleveland: +7.847 10. Indianapolis: +6,822 11. Lincoln: +5,665 12. Toledo: +4,815 13. St. Paul: +4,773 14. Cincinnati: +4,659 15. Kansas City: +4,652 16. Fort Wayne: +3,645 17. Des Moines: +3,346 18. Milwaukee: +2,975 19. Minneapolis: +2,705 20. Omaha: +2,468 21. Madison: +2,086 22. St. Louis: 1,188 23. Virginia Beach: +977 24. Grand Rapids: +971 25. Providence: -319 26. Wichita: -351 27. Detroit: -553 28. Pittsburgh: -1251
Non-Hispanic Other % of Total Population by City in 2018 1. Sacramento: 7.8% 2. St. Paul: 5.8% 3. Portland: 5.7% 4. Minneapolis: 5.5% 5. Toledo: 5.4% 6. Las Vegas: 5.3% 7. Virginia Beach: 4.7% 8. Fort Wayne: 4.6% 9. Lincoln: 4.6% 10. Columbus: 4.6% 11. San Jose: 4.5% 12. Cleveland: 4.2% 13. Grand Rapids: 4.2% 14. Jacksonville: 4.1% 15. Des Moines: 4.1% 16. Wichita: 4.0% 17. Cincinnati: 3.9% 18. Kansas City: 3.9% 19. Omaha: 3.8% 20. Madison: 3.6% 21. Providence: 3.4% 22. Pittsburgh: 3.3% 23. Milwaukee: 3.3% 24. Indianapolis: 3.1% 25. St. Louis: 2.9% 26. Austin: 2.8% 27. Chicago: 2.4% 28. Detroit: 2.4%
Now that we can see all the numbers, what is the 2018 ranking of most to least racially diverse? To find out, I assigned points by the ranking of % of population, so #1 of a particular ranking would get 1 point, the next 2 points and so on. The cities with the fewest points are the most diverse. Here are the rankings for both 2010 and 2018.
Most to Least Diverse by Year and Total Points 2010——————————–2018 1. Portland: 50—————–1. Portland: 54 2. Sacramento: 52————2. Sacramento: 54 3. St. Paul: 53—————–3. Minneapolis: 55 4. Minneapolis: 54———–4. St. Paul: 58 5. Virginia Beach: 55——–5. Las Vegas: 59 6. Wichita: 57—————-6. Virginia Beach: 59 7. Las Vegas: 60————-7. Fort Wayne: 62 8. Providence: 61————8. Des Moines: 64 9. Omaha: 66—————-9. Jacksonville: 67 10. Grand Rapids: 69——-10. Columbus: 70 11. Des Moines: 71———-11. San Jose: 71 12. Madison: 72————-12. Cleveland: 72 13. San Jose: 72————-13. Wichita: 72 14. Fort Wayne: 73———14. Grand Rapids: 73 15. Kansas City: 73———15. Providence: 73 16. Milwaukee: 73———-16. Omaha: 74 17. Pittsburgh: 74———-17. Madison: 75 18. Jacksonville: 75——–18. Toledo: 75 19. Chicago: 76————-19. Milwaukee: 76 20. Columbus: 77———-20. Chicago: 77 21. Austin: 80—————21. Austin: 78 22. Indianapolis: 81——–22. Kansas City: 78 23. Toledo: 81————–23. Lincoln: 78 24. Lincoln: 85————-24. Indianapolis: 81 25. St. Louis: 94———–25. Pittsburgh: 82 26. Cleveland: 95———-26. Cincinnati: 91 27. Cincinnati: 97———-27. St. Louis: 96 28. Detroit: 104————28. Detroit: 106
Columbus had one of the fastest improvements of its diversity, moving up 10 spots from 20th to 10th.
So once again, 2017 Ohio city population estimates came out today from the Census. As has been the case for a long time now, Columbus is rocketing upward at record pace. The 2016 comparison numbers have been adjusted by the Census for the 2017 update.
Some milestones include Grove City and Lancaster passing 40,000 for the first time and Johnstown passing the 5,000 mark. 11 places lost population, 8 stayed the same and 83 gained population. The growing portions of the Columbus metro continue to encompass the vast majority of incorporated places.
Nationally, here were the top 20 fastest-growing cities by numerical change between July 1, 2016 and July 1, 2017 1. San Antonio, Texas: +24,208 2. Phoenix, Arizona: 24,036 3. Dallas, Texas: +18,935 4. Fort Worth, Texas: +18,664 5. Los Angeles: 18,643 6. Seattle, Washington: +17,490 7. Charlotte, North Carolina: +15,551 8. Columbus: +15,429 9. Frisco, Texas: +13,470 10. Atlanta, Georgia: +13,323 11. San Diego, California: +12,834 12. Austin, Texas: +12,515 13. Jacksonville, Florida: +11,169 14. Irvine, California: +11,068 15. Henderson, Nevada: +10,534 16. Las Vegas, Nevada: 9,966 17. Denver, Colorado: 9,844 18. Washington, DC: 9,636 19. Tampa, Florida: 9,383 20. Mesa, Arizona: 9,025
Now that we have the full set of 2017 population estimates, I wanted to examine a popular claim a little more closely. The claim is that suburban growth far exceeds that of core cities/counties, and it’s often repeated in media throughout the country. One of the things that always bothered me about this was the constant use of basing this claim largely on % change. This has a major flaw, one that I will go into more below.
For this little study on suburban vs urban growth, I will look at the top 50 largest metro areas.
First, let’s look at the total change in the whole metro area, the core county and the core city between the 2010 Census and July 1, 2017. They will be ranked here by total metro change. 1. Dallas, TX: +973,431 2. Houston, TX: +971,941 3. New York, NY: +754,396 4. Atlanta, GA: +597,993 5. Miami, FL: +592,525 6. Washington, DC: +580,228 7. Phoenix, AZ: +544,141 8. Los Angeles, CA: +524,946 9. Seattle, WA: +427,240 10. Austin, TX: +399,507 11. San Francisco, Ca: +391,784 12. Orlando, FL: +375,432 13. Riverside, CA: +355,705 14. Denver, CO: +344,635 15. San Antonio, TX: +331,458 16. Charlotte, NC: +308,313 17. Tampa, FL: +307,930 18. Boston, MA: +283,935 19. Las Vegas, NV: +252,810 20. Minneapolis, MN: +251,760 21. San Diego, CA: +242,343 22. Nashville, TN: +232,162 23. Portland, OR: +227,167 24. Raleigh, NC: +204,590 25. Columbus: +176,724 26. Sacramento, CA: +175,740 27. San Jose, CA: +161,523 28. Jacksonville, FL: +159,382 29. Indianapolis, IN: +140,524 30. Oklahoma City, OK: +130,746 31. Philadelphia, PA: +130,427 32. Kansas City, MO: +119,574 33. Salt Lake City, UT: +115,297 34. Baltimore, MD: +97,572 35. Richmond, VA: +86,117 36. New Orleans, LA: +85,903 37. Chicago: +71,499 38. Cincinnati: +64,396 39. Louisville, KY: +58,247 40. Virginia Beach, VA: +48,429 41. Memphis, TN: +23,433 42. Birmingham, AL: +21,751 43. Milwaukee, WI: +20,282 44. Providence, RI: +19,912 45. St. Louis, MO: +19,575 46. Detroit: +16,685 47. Buffalo, NY: +1,239 48. Hartford, CT: -2,139 49. Cleveland: -18,427 50. Pittsburgh, PA: -22,924
Now that we have the total growth, let’s break it down a bit more.
How much of the total metro change occurred in the core county of each metro? This will be ranked by the highest to lowest % occurring in the core county.
*New York includes all 5 main boroughs, so it is different than core county, but still represents the urban center of the metro area. **Core County and City are consolidated, or city exists as separate entity.
Going down even further, let’s compare the core city to the total metro, again ranked by %.
*Again, I used the 5 boroughs of New York here, so the numbers don’t change. **See above.
Finally, because core counties and cities can be absolutely huge, like in Phoenix, I wanted to take see the ratio of people moving vs. the area size. To do this, I divided the growth by the land area of each core county and city.
So basically, how many people moved there per each square mile.
So what’s all this mean? Columbus performs particularly well here. Franklin County attracts a high percentage of the total metro population, and Columbus itself is one of only 5 cities with more than 50% of the metro growth entering the city limits. Even accounting for area size, Columbus does fairly well. This suggests that urban growth there is stronger than in most cities.