And here were the top 25 cities with the highest numeric growth 2010-2018. 1. Columbus: +105,500 2. Hilliard: +7,979 3. Dublin: +6,896 4. Grove City: +6,050 5. Cincinnati: +5,662 6. Delaware: +5,177 7. North Ridgeville: +4,424 8. Westerville: +4,267 9. New Albany: +3,165 10. Pickerington: +2,910 11. Mason: +2,874 12. Newark: +2,456 13. Reynoldsburg: +2,385 14. Gahanna: +2,303 15. Wadsworth: +2,214 16. Beavercreek: +2,198 17. Marysville: +2,173 18. Avon: +2,070 19. Powell: +1,809 20. Grandview Heights: +1,785 21. Upper Arlington: +1,751 22. Harrison: +1,711 23. Lancaster: +1,634 24. Oxford: +1,514 25. Sunbury: +1,485
Columbus’ growth is very impressive in Ohio, but it has also been a top 15 fastest-growing city in the country for the past few years now, and there appears to be little standing in the way of that continuing.
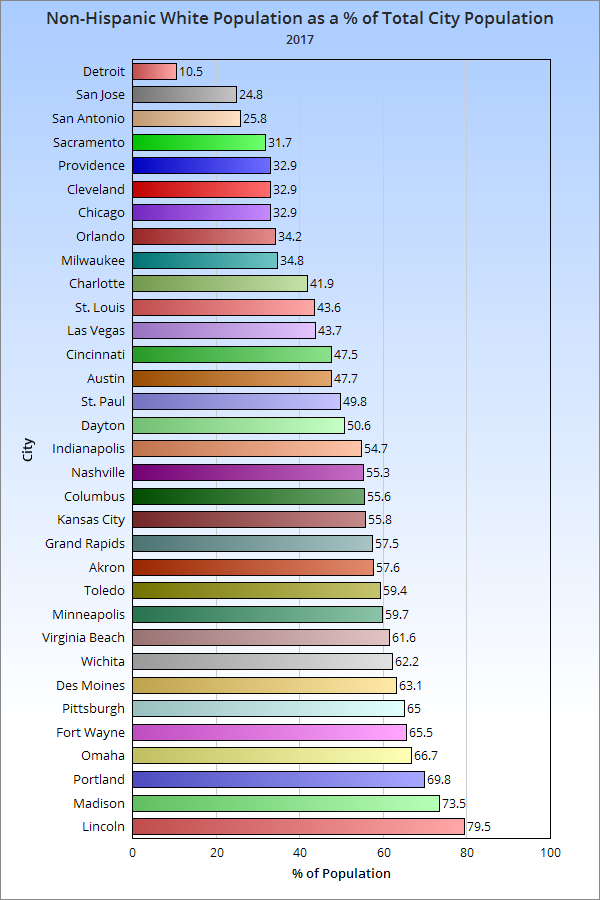
In the 2nd post related to the recently-released Census demographic data, I’ll look at Columbus city diversity and peer comparison for how it’s been changing since 2005.
Rank by City of Total White, non-Hispanic Population by Year 2005————————————–2010————————————-2017 1. Chicago, IL: 819,215————1. Chicago: 853,910————1. Chicago: 879,334 2. Indianapolis, IN: 491,044—2. Indianapolis: 482,195—–2. Columbus: 490,149 3. Columbus: 442,958———-3. Columbus: 470,971—-3. Indianapolis: 468,665 4. Portland, OR: 382,033———-4. Portland: 417,876————4. Austin: 453,801 5. San Antonio, TX: 356,420—–5. Austin: 384,065————5. Portland: 452,132 6. Austin, TX: 347,013——-6. San Antonio: 351,420—6. San Antonio: 375,463 7. Nashville, TN: 314,518——–7. Nashville: 339,030——–7. Nashville: 368,195 8. Charlotte, NC: 302,789——-8. Charlotte: 331,357——8. Charlotte: 360,270 9. Virginia Beach, VA: 290,891–9. Virginia Beach: 282,812——9. Omaha: 311,349 10. San Jose, CA: 281,822—–10. Las Vegas: 280,604———–10. Las Vegas: 280,201 11. Las Vegas, NV: 281,679—-11. Omaha: 277,606———–11. Virginia Beach: 277,338 12. Omaha, NE: 267,685——–12. San Jose: 265,311————12. Kansas City: 272,548 13. Kansas City, MO: 249,123—13. Kansas City: 247,473——13. San Jose: 267,315 14. Wichita, KS: 245,527———-14. Wichita: 245,146————14. Minneapolis: 252,304 15. Milwaukee, WI: 219,891——15. Minneapolis: 242,848——15. Wichita: 243,143 16. Minneapolis, MN: 216,975—16. Milwaukee: 221,514——–16. Lincoln: 226,297 17. Lincoln, NE: 197,287———-17. Lincoln: 216,076————-17. Milwaukee: 207,043 18. Toledo: 183,746—————-18. Pittsburgh: 203,622———18. Pittsburgh: 196,687 19. Pittsburgh, PA: 180,725——19. Fort Wayne: 179,646——-19. Madison: 187,566 20. Madison, WI: 161,631——–20. Madison: 178,307————20. Fort Wayne: 166,912 21. St. Paul, MN: 161,329——–21. Toledo: 177,341————–21. Toledo: 164,104 22. Sacramento, CA: 160,599—22. Sacramento: 165,610——22. Sacramento: 159,291 23. Fort Wayne, IN: 157,672—–23. St. Paul: 159,704———–23. St. Paul: 152,558 24. Des Moines, IA: 149,786—–24. Des Moines: 145,937——24. Cincinnati: 143,028 25. Cleveland: 147,359———–25. Cincinnati: 143,120———25. Des Moines: 137,235 26. St. Louis, MO: 143,590——26. Cleveland: 137,977———26. St. Louis: 134,471 27. Cincinnati: 138,486———–27. St. Louis: 134,146———–27. Cleveland: 126,714 28. Akron: 128,976—————-28. Akron: 120,800————–28. Grand Rapids: 114,349 29. Grand Rapids, MI: 113,791—29. Grand Rapids: 104,636—29. Akron: 113,951 30. Orlando, FL: 92,326———–30. Orlando: 96,867————-30. Orlando: 95,876 31. Detroit, MI: 77,163————-31. Dayton: 72,663————–31. Dayton: 71,094 32. Dayton: 67,581—————–32. Providence: 64,284——–32. Detroit: 70,931 33. Providence, RI: 64,223——-33. Detroit: 55,298————–33. Providence: 59,321
Columbus moved from 3rd to 2nd over the period.
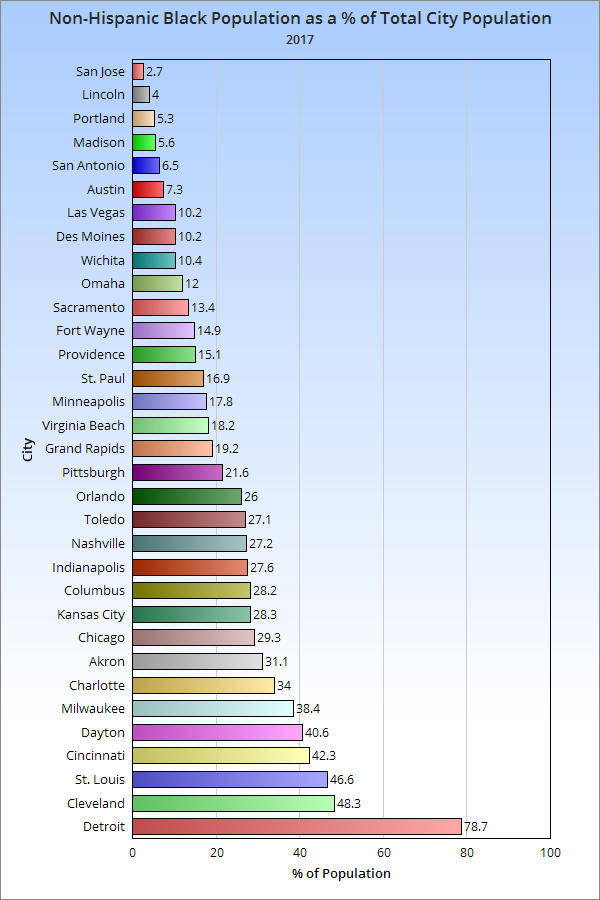
Rank by City of Total Black, non-Hispanic Population by Year 2005—————————————–2010———————————2017 1. Chicago: 938,097—————–1. Chicago: 895,294———–1. Chicago: 797,253 2. Detroit: 683,999——————–2. Detroit: 587,707————-2. Detroit: 529,593 3. Milwaukee: 222,040————–3. Charlotte: 251,274———-3. Charlotte: 292,104 4. Cleveland: 221,797—————4. Milwaukee: 230,473——–4. Columbus: 248,476 5. Charlotte: 205,216—————-5. Indianapolis: 226,314——-5. Indianapolis: 236,606 6. Indianapolis: 193,948————6. Columbus: 216,486———6. Milwaukee: 228,720 7. Columbus: 179,197—————7. Cleveland: 208,528———7. Cleveland: 186,073 8. St. Louis: 168,768—————-8. Nashville: 171,104———–8. Nashville: 180,830 9. Nashville: 148,051—————-9. St. Louis: 157,382———–9. St. Louis: 143,761 10. Kansas City: 131,694———-10. Kansas City: 138,461—–10. Kansas City: 138,346 11. Cincinnati: 131,010————-11. Cincinnati: 131,909——–11. Cincinnati: 127,589 12. Pittsburgh: 81,758————–12. Virginia Beach: 79,583—-12. San Antonio: 97,925 13. Virginia Beach: 80,004——–13. San Antonio: 79,307——13. Virginia Beach: 82,181 14. Orlando: 73,736—————–14. Toledo: 75,033————-14. Minneapolis: 75,006 15. Toledo: 72,190——————-15. Pittsburgh: 71,539——–15. Toledo: 74,906 16. Sacramento: 71,452————16. Orlando: 70,988————16. Orlando: 72,796 17. San Antonio: 70,723————17. Minneapolis: 63,749——17. Austin: 69,860 18. Dayton: 60,196——————-18. Sacramento: 61,976——18. Sacramento: 67,305 19. Akron: 59,810——————–19. Austin: 61,833————–19. Las Vegas: 65,663 20. Las Vegas: 59,780————–20. Dayton: 61,402————-20. Pittsburgh: 65,268 21. Austin: 59,583——————-21. Akron: 60,653—————-21. Akron: 61,461 22. Minneapolis: 57,499————22. Las Vegas: 60,187———22. Dayton: 57,043 23. Omaha: 50,333——————23. Omaha: 55,086————-23. Omaha: 56,098 24. Grand Rapids: 40,408———24. Wichita: 42,662————-24. St. Paul: 51,737 25. Wichita: 39,165—————–25. Grand Rapids: 41,848—–25. Wichita: 40,756 26. Fort Wayne: 35,221———–26. St. Paul: 41,923————-26. Grand Rapids: 38,130 27. St. Paul: 34,903—————-27. Fort Wayne: 39,016——–27. Fort Wayne: 37,941 28. Portland: 30,828—————28. Portland: 37,355————28. Portland: 34,624 29. San Jose: 27,446————–29. San Jose: 29,831———-29. San Jose: 28,126 30. Providence: 18,794———–30. Des Moines: 19,962——-30. Providence: 27,274 31. Des Moines: 16,709———-31. Providence: 19,265——–31. Des Moines: 22,170 32. Madison: 12,660————–32. Madison: 17,560————32. Madison: 14,185 33. Lincoln: 7,082——————33. Lincoln: 9,023—————33. Lincoln: 11,487
Columbus moved up from 7th to 4th in total Black, non-Hispanic during the period. Surprisingly, quite a few cities have actually been losing this demographic since 2010 at least.
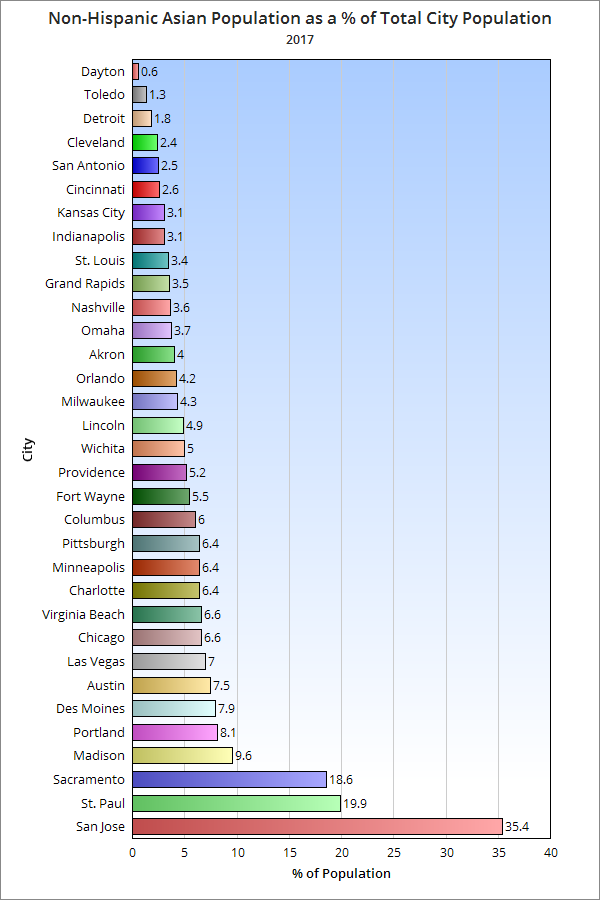
Rank by City of Total Asian, non-Hispanic Population by Year 2005————————————-2010——————————————2017 1. San Jose: 269,186————–1. San Jose: 303,227—————–1. San Jose: 366,134 2. Chicago: 127,686—————-2. Chicago: 148,280——————2. Chicago: 179,176 3. Sacramento: 80,307————3. Sacramento: 84,556————-3. Sacramento: 93,476 4. Portland: 36,278—————–4. Austin: 46,575———————-4. Austin: 71,539 5. Austin: 35,239——————–5. Portland: 43,185——————-5. St. Paul: 61,082 6. St. Paul: 35,184——————6. St. Paul: 41,989——————-6. Charlotte: 55,142 7. Columbus: 27,125—————7. Las Vegas: 37,406—————7. Columbus: 53,027 8. Las Vegas: 25,077————–8. Charlotte: 37,181—————–8. Portland: 52,219 9. Charlotte: 23,356—————-9. Columbus: 35,468—————-9. Las Vegas: 44,735 10. Virginia Beach: 22,501——10. San Antonio: 29,200———–10. San Antonio: 38,119 11. San Antonio: 20,492———11. Virginia Beach: 27,303—–11. Virginia Beach: 29,735 12. Minneapolis: 20,189———12. Milwaukee: 22,670————–12. Minneapolis: 26,833 13. Milwaukee: 19,596———–13. Minneapolis: 21,426————13. Indianapolis: 26,548 14. Nashville: 16,943————-14. Wichita: 19,420——————14. Milwaukee: 25,624 15. Wichita: 15,417—————15. Indianapolis: 17,137————15. Madison: 24,455 16. Madison: 12,708————–16. Nashville: 17,045—————16. Nashville: 24,034 17. Indianapolis: 12,312———17. Madison: 16,671—————-17. Wichita: 19,548 18. Providence: 10,751———-18. Pittsburgh: 12,036————–18. Pittsburgh: 19,357 19. Pittsburgh: 10,727————19. Providence: 11,497————19. Omaha: 17,412 20. Kansas City: 10,674———20. Lincoln: 10,452——————20. Des Moines: 17,143 21. Detroit: 9,577——————21. Kansas City: 10,263———–21. Kansas City: 15,213 22. Des Moines: 8,796———–22. Des Moines: 8,867————-22. Fort Wayne: 14,039 23. Lincoln: 7,513—————–23. St. Louis: 8,717—————–23. Lincoln: 13,992 24. St. Louis: 7,046—————24. Omaha: 8,397——————-24. Orlando: 11,852 25. Omaha: 6,971—————–25. Orlando: 7,870——————25. Detroit: 11,790 26. Cincinnati: 6,874————-26. Fort Wayne: 6,945————–26. St. Louis: 10,404 27. Cleveland: 6,289————27. Detroit: 6,549———————27. Providence: 9,361 28. Orlando: 5,528—————28. Cincinnati: 5,938—————-28. Cleveland: 9,217 29. Fort Wayne: 4,241———-29. Cleveland: 5,392—————-29. Akron: 8,007 30. Toledo: 4,150—————-30. Akron: 4,567———————30. Cincinnati: 7,906 31. Akron: 3,497—————–31. Grand Rapids: 3,695———–31. Grand Rapids: 7,056 32. Grand Rapids: 2,847——32. Toledo: 3,125——————–32. Toledo: 3,679 33. Dayton: 1,827—————33. Dayton: 1,231——————–33. Dayton: 848
Columbus maintained its rank since 2005.
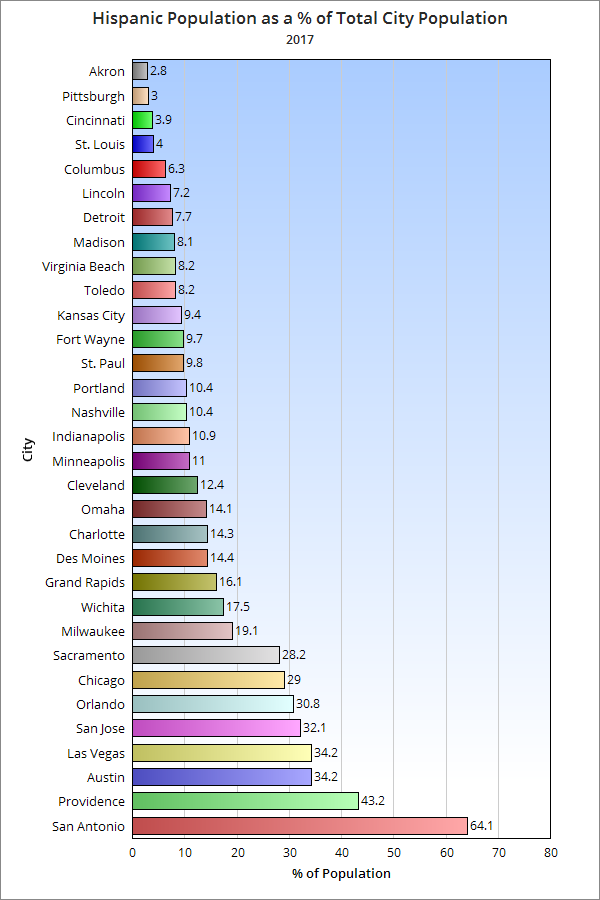
Rank by City of Total Hispanic Population by Year 2005——————————————–2010————————————2017 1. Chicago: 778,234—————1. San Antonio: 853,654———-1. San Antonio: 969,065 2. San Antonio: 735,458———–2. Chicago: 763,968—————2. Chicago: 787,978 3. San Jose: 279,420————–3. San Jose: 318,389————–3. San Jose: 332,603 4. Austin: 223,361——————4. Austin: 288,130——————4. Austin: 324,973 5. Las Vegas: 153,813————5. Las Vegas: 181,923————-5. Las Vegas: 219,220 6. Sacramento: 111,559———6. Sacramento: 124,461———–6. Sacramento: 141,752 7. Milwaukee: 80,945————-7. Milwaukee: 104,619————-7. Milwaukee: 133,812 8. Providence: 60,008————-8. Charlotte: 96,246—————-8. Charlotte: 122,904 9. Charlotte: 58,466—————9. Indianapolis: 78,467————-9. Indianapolis: 93,042 10. Wichita: 49,928—————10. Providence: 76,645————10. Orlando: 86,305 11. Indianapolis: 47,764———11. Nashville: 61,212—————11. Providence: 77,893 12. Detroit: 46,993—————-12. Wichita: 59,823——————12. Nashville: 69,574 13. Orlando: 43,978————–13. Portland: 58,986—————–13. Wichita: 68,389 14. Portland: 43,324————–14. Orlando: 56,061—————–14. Portland: 67,551 15. Omaha: 39,674—————15. Omaha: 53,661——————15. Omaha: 66,056 16. Nashville: 37,463————-16. Kansas City: 49,800————16. Columbus: 55,782 17. Minneapolis: 37,017———17. Detroit: 45,580——————-17. Detroit: 48,328 18. Kansas City: 35,995———18. Columbus: 43,276————–18. Cleveland: 47,962 19. Grand Rapids: 32,368——19. Cleveland: 36,067————–19. Minneapolis: 46,375 20. Cleveland: 32,085———–20. Minneapolis: 34,504———–20. Kansas City: 45,975 21. Columbus: 24,607———–21. Grand Rapids: 30,659——21. Virginia Beach: 36,723 22. St. Paul: 22,402————–22. Virginia Beach: 29,206—–22. Grand Rapids: 32,016 23. Virginia Beach: 20,803—–23. St. Paul: 28,725————–23. Des Moines: 31,333 24. Des Moines: 18,952——–24. Des Moines: 23,832———-24. St. Paul: 30,007 25. Toledo: 18,404————–25. Toledo: 21,346——————25. Fort Wayne: 24,724 26. Fort Wayne: 16,438——-26. Fort Wayne: 19,576————26. Toledo: 22,796 27. Madison: 11,997———–27. Lincoln: 16,007——————27. Lincoln: 21,921 28. Lincoln: 9,672—————28. Madison: 14,062—————28. Madison: 20,741 29. St. Louis: 8,268————-29. St. Louis: 11,207————–29. St. Louis: 12,447 30. Pittsburgh: 5,018———-30. Cincinnati: 8,710—————30. Cincinnati: 11,787 31. Cincinnati: 3,855———–31. Pittsburgh: 7,282————–31. Pittsburgh: 9,212 32. Akron: 3,485—————-32. Akron: 3,990——————–32. Dayton: 5,765 33. Dayton: 1,693————–33. Dayton: 3,180——————-33. Akron: 5,536
Columbus moved up from 21st to 16th in the total Hispanic population.
Rank by City of Total Other, non-Hispanic Population by Year 2005——————————————-2010—————————————–2017 1. Chicago: 38,694—————1. Chicago: 37,379——————–1. Chicago: 58,721 2. San Jose: 29,456————2. San Jose: 32,439——————–2. Portland: 41,595 3. Sacramento: 21,370———-3. Sacramento: 30,900—————3. San Jose: 41,175 4. Portland: 21,164————–4. Portland: 28,027———————4. Sacramento: 40,066 5. Indianapolis: 20,242———-5. Las Vegas: 24,521—————–5. Columbus: 34,467 6. Columbus: 20,096————-6. Columbus: 23,738—————–6. Indianapolis: 32,525 7. San Antonio: 19,130———-7. San Antonio: 20,778————–7. Las Vegas: 31,889 8. Minneapolis: 18,580———-8. Minneapolis: 20,753————–8. San Antonio: 31,341 9. Detroit: 18,324—————–9. Virginia Beach: 20,268———-9. Austin: 30,541 10. Las Vegas: 18,304———-10. Indianapolis: 20,086———-10. Charlotte: 28,632 11. Virginia Beach: 16,685—-11. Charlotte: 18,360————–11. Virginia Beach: 24,458 12. Milwaukee: 14,476———-12. Detroit: 16,776—————–12. Nashville: 23,334 13. Kansas City: 13,399——–13. Milwaukee: 16,311———–13. Minneapolis: 21,808 14. Austin: 13,261—————-14. Wichita: 16,091—————14. Milwaukee: 20,166 15. Charlotte: 11,771————-15. Omaha: 15,519————–15. Wichita: 18,763 16. Wichita: 11,545—————16. Austin: 14,915—————-16. Kansas City: 16,743 17. Omaha: 8,552—————–17. Kansas City: 14,668——–17. Omaha: 15,988 18. St. Paul: 7,741—————-18. Nashville: 14,227————18. Cleveland: 15,586 19. Toledo: 7,447—————–19. St. Paul: 13,098————–19. Orlando: 13,429 20. Cincinnati: 7,315————-20. Pittsburgh: 11,280———–20. Detroit: 12,461 21. Cleveland: 7,004————-21. Toledo: 10,134—————21. Pittsburgh: 11,890 22. Providence: 6,488———–22. Akron: 9,020——————22. St. Paul: 11,220 23. Pittsburgh: 6,138————23. Fort Wayne: 8,513———–23. Fort Wayne: 11,180 24. St. Louis: 6,058————–24. Cleveland: 8,276————-24. Lincoln: 11,037 25. Fort Wayne: 5,774———-25. St. Louis: 7,704————–25. Toledo: 11,009 26. Orlando: 5,731—————26. Lincoln: 7,483—————-26. Cincinnati: 10,995 27. Nashville: 5,687————-27. Grand Rapids: 7,376——–27. Des Moines: 9,627 28. Madison: 4,708————–28. Orlando: 7,251—————28. Akron: 8,894 29. Lincoln: 4,508—————-29. Cincinnati: 7,230————29. Madison: 8,292 30. Akron: 4,431—————–30. Madison: 7,177————–30. St. Louis: 7,543 31. Grand Rapids: 4,154——31. Providence: 6,471———–31. Grand Rapids: 7,260 32. Des Moines: 2,674———32. Des Moines: 5,598———-32. Providence: 6,539 33. Dayton: 1,382—————33. Dayton: 3,025—————-33. Dayton: 5,629
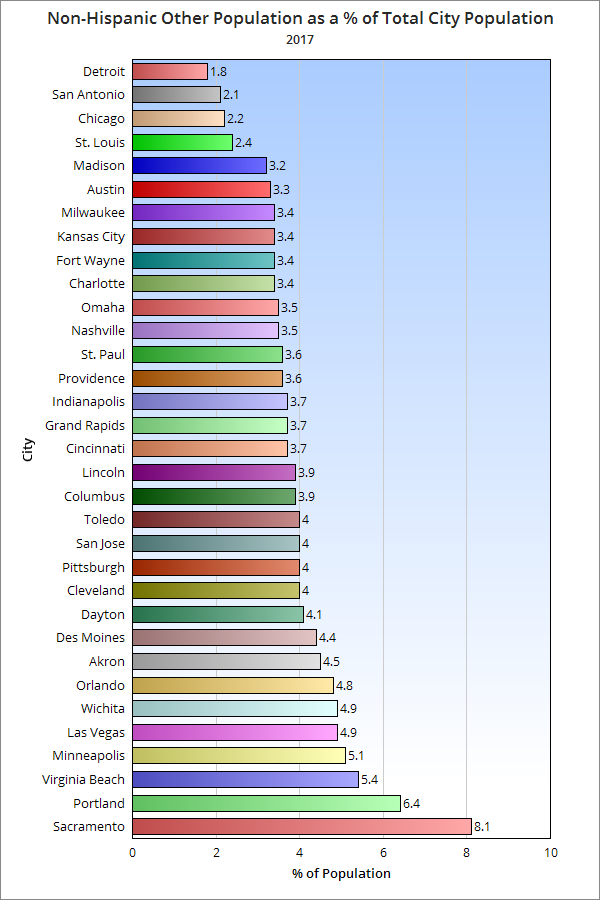
Finally, Columbus moved up from 6th to 5th in the total of Other, non-Hispanic population. Overall, Columbus ranks fairly well in totals vs. its peers, as one might expect given that it is one of the largest cities in the grouping. However, to truly find out how it compares with these other cities, you have to look at percentages, which tells how much of the city’s population is made up of each group. Columbus ranks in the middle of the pack for its % of Non-Hispanic White population. Like in most cities, even while this demographic is growing in total numbers in Columbus, the % of total population continues to fall. Columbus ranked in the top 3rd of peer cities for its % of Non-Hispanic Black population. Columbus also ranked in the top 3rd for its Non-Hispanic Asian population. Columbus ranks poorly with Hispanics in the group, ranking near the bottom. Finally, Columbus ranks in the middle for its Non-Hispanic Other population.
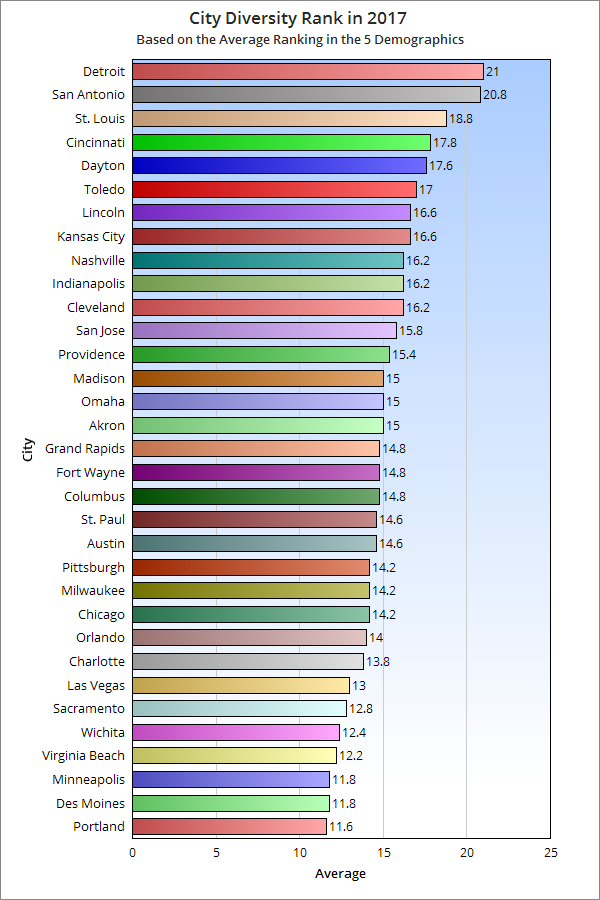
So what’s the final ranking for where Columbus is with diversity compared to its peers in 2017? To find out, I assigned points based on ranked position in each 5 racial categories and took the average of the positions in each 5. The result is that the higher the average number, the lower the overall diversity. So based on this, Columbus ranks in the top half of national and Midwest peers for diversity.
*Note: Normally, Youngstown would be included, but the data was not available.
Now that we have the full set of 2017 population estimates, I wanted to examine a popular claim a little more closely. The claim is that suburban growth far exceeds that of core cities/counties, and it’s often repeated in media throughout the country. One of the things that always bothered me about this was the constant use of basing this claim largely on % change. This has a major flaw, one that I will go into more below.
For this little study on suburban vs urban growth, I will look at the top 50 largest metro areas.
First, let’s look at the total change in the whole metro area, the core county and the core city between the 2010 Census and July 1, 2017. They will be ranked here by total metro change. 1. Dallas, TX: +973,431 2. Houston, TX: +971,941 3. New York, NY: +754,396 4. Atlanta, GA: +597,993 5. Miami, FL: +592,525 6. Washington, DC: +580,228 7. Phoenix, AZ: +544,141 8. Los Angeles, CA: +524,946 9. Seattle, WA: +427,240 10. Austin, TX: +399,507 11. San Francisco, Ca: +391,784 12. Orlando, FL: +375,432 13. Riverside, CA: +355,705 14. Denver, CO: +344,635 15. San Antonio, TX: +331,458 16. Charlotte, NC: +308,313 17. Tampa, FL: +307,930 18. Boston, MA: +283,935 19. Las Vegas, NV: +252,810 20. Minneapolis, MN: +251,760 21. San Diego, CA: +242,343 22. Nashville, TN: +232,162 23. Portland, OR: +227,167 24. Raleigh, NC: +204,590 25. Columbus: +176,724 26. Sacramento, CA: +175,740 27. San Jose, CA: +161,523 28. Jacksonville, FL: +159,382 29. Indianapolis, IN: +140,524 30. Oklahoma City, OK: +130,746 31. Philadelphia, PA: +130,427 32. Kansas City, MO: +119,574 33. Salt Lake City, UT: +115,297 34. Baltimore, MD: +97,572 35. Richmond, VA: +86,117 36. New Orleans, LA: +85,903 37. Chicago: +71,499 38. Cincinnati: +64,396 39. Louisville, KY: +58,247 40. Virginia Beach, VA: +48,429 41. Memphis, TN: +23,433 42. Birmingham, AL: +21,751 43. Milwaukee, WI: +20,282 44. Providence, RI: +19,912 45. St. Louis, MO: +19,575 46. Detroit: +16,685 47. Buffalo, NY: +1,239 48. Hartford, CT: -2,139 49. Cleveland: -18,427 50. Pittsburgh, PA: -22,924
Now that we have the total growth, let’s break it down a bit more.
How much of the total metro change occurred in the core county of each metro? This will be ranked by the highest to lowest % occurring in the core county.
*New York includes all 5 main boroughs, so it is different than core county, but still represents the urban center of the metro area. **Core County and City are consolidated, or city exists as separate entity.
Going down even further, let’s compare the core city to the total metro, again ranked by %.
*Again, I used the 5 boroughs of New York here, so the numbers don’t change. **See above.
Finally, because core counties and cities can be absolutely huge, like in Phoenix, I wanted to take see the ratio of people moving vs. the area size. To do this, I divided the growth by the land area of each core county and city.
So basically, how many people moved there per each square mile.
So what’s all this mean? Columbus performs particularly well here. Franklin County attracts a high percentage of the total metro population, and Columbus itself is one of only 5 cities with more than 50% of the metro growth entering the city limits. Even accounting for area size, Columbus does fairly well. This suggests that urban growth there is stronger than in most cities.
Today, I am going to examine 2017 metro population estimates from the US Census, not only for Ohio, but also Columbus’ peer group that includes Midwest and national metro areas. Midwest peers (outside Ohio) used would be any metro with a population greater than 500,000. National peers would be metros that either started or ended the period 2010-2017 with a population between 1.5-2.5 Million.
As with counties, I am going to start this look with a comparison of overall population.
Total Metro Area Population Census 2010, July 1, 2016 and July 1, 2017 Census 2010——————————-July 1, 2016————————July 1, 2017 1. Chicago, IL: 9,461,104————-1. Chicago: 9,546,326———–1. Chicago: 9,533,040 2. Detroit, MI: 4,296,250—————2. Detroit: 4,305,869————-2. Detroit: 9,313,002 3. Minneapolis, MN: 3,348,8459—3. Minneapolis: 3,557,276–3. Minneapolis: 3,600,618 4. St. Louis, MO: 2,787,701———4. St. Louis: 2,806,782———4. St. Louis: 2,807,338 5. Pittsburgh, PA: 2,356,285——–5. Charlotte: 2,475,519———5. Charlotte: 2,525,305 6. Portland, OR: 2,226,009———-6. Orlando: 2,453,333———-6. Orlando: 2,509,831 7. Charlotte: 2,217,012———–7. San Antonio: 2,426,211—–7. San Antonio: 2,473,974 8. Sacramento, CA: 2,149,127—–8. Portland: 2,423,102——–8. Portland: 2,453,168 9. San Antonio, TX: 2,142,516—–9. Pittsburgh: 2,341,536——9. Pittsburgh: 2,333,367 10. Orlando, FL: 2,134,411—–10. Sacramento: 2,295,233—10. Sacramento: 2,324,884 11. Cincinnati: 2,114,580———-11. Cincinnati: 2,166,029—–11. Las Vegas: 2,204,079 12. Cleveland: 2,077,240————12. Las Vegas: 2,156,724—-12. Cincinnati: 2,179,082 13. Kansas City, MO: 2,009,342-13. Kansas City: 2,106,382-13. Kansas City: 2,128,912 14. Las Vegas, NV: 1,951,269——–14. Austin: 2,060,558——–14. Austin: 2,115,827 15. Columbus: 1,901,974———-15. Cleveland: 2,060,065——15. Columbus: 2,078,725 16. Indianapolis, IN: 1,887,877——16. Columbus: 2,046,977—16. Cleveland: 2,058,844 17. San Jose, CA: 1,836,911—17. Indianapolis: 2,005,612—17. Indianapolis: 2,028,614 18. Austin, TX: 1,716,289————18. San Jose: 1,990,910—-18. San Jose: 1,998,463 19. Virginia Beach, VA: 1,676,822—19. Nashville: 1,868,855—-19. Nashville: 1,903,045 20. Nashville: 1,670,890—20. Virginia Beach: 1,722,766–20. Virginia Beach: 1,725,246 21. Providence, RI: 1,600,852—-21. Providence: 1,615,878—21. Providence: 1,621,122 22. Milwaukee, WI: 1,555,908—–22. Milwaukee: 1,576,143—22. Milwaukee: 1,576,236 23. Jacksonville, FL: 1,345,596-23. Jacksonville: 1,476,503–23. Jacksonville: 1,504,980 24. Grand Rapids: 988,938–24. Grand Rapids: 1,048,826-24. Grand Rapids: 1,059,113 25. Omaha, NE: 865,350————–25. Omaha: 924,003—-25. Omaha: 933,316 26. Dayton: 799,232——————–26. Dayton: 800,886—–26. Dayton: 803,416 27. Akron: 703,200———————27. Akron: 702,556——–27. Akron: 703,505 28. Wichita, KS: 630,919————-28. Madison: 647,432—28. Madison: 654,230 29. Toledo: 610,001——————29. Wichita: 644,680——29. Des Moines: 645,911 30. Madison, WI: 605,435———–30. Des Moines: 634,740—-30. Wichita: 645,628 31. Des Moines, IA: 569,633——-31. Toledo: 604,591——31. Toledo: 603,668 32. Youngstown: 565,773——32. Youngstown: 544,543—32. Youngstown: 541,926 33. Canton: 404,422——————33. Canton: 401,165—-33. Canton: 399,927
Columbus passed up Cleveland to become Ohio’s 2nd largest metro.
Metro Area Total Growth Census 2010-July 1, 2017 and July 1, 2016-July 1, 2017 Census 2010-July 1, 2017—————————–July 1, 2016-July 1, 2017 1. Austin, TX: +399,507———————————–1. Orlando: +56,498 2. Orlando, FL: +375,432———————————2. Austin: +55,269 3. San Antonio, TX: +331,458—————————3. Charlotte: +49,786 4. Charlotte, NC: +308,313——————————-4. San Antonio: +47,763 5. Las Vegas, NV: +252,810—————————–5. Las Vegas: +47,355 6. Minneapolis, MN: +251,760————————–6. Minneapolis: +43,342 7. Nashville, TN: +232,162——————————-7. Nashville: +34,190 8. Portland, OR: +227,167——————————-8. Columbus: +31,748 9. Columbus: +176,724———————————–9. Portland: +30,066 10. Sacramento, CA: +175,740————————10. Sacramento: +29,651 11. San Jose, CA: +161,523—————————-11. Jacksonville: +28,477 12. Jacksonville, FL: +159,382————————-12. Indianapolis: +23,002 13. Indianapolis, IN: +140,524————————-13. Kansas City: +22,530 14. Kansas City, MO: +119,574————————14. Cincinnati: +13,053 15. Des Moines, IA: +76,278—————————15. Des Moines: +11,171 16. Chicago, IL: +71,499——————————–16. Grand Rapids: +10,287 17. Grand Rapids, MI: +70,173————————17. Omaha: +9,313 18. Omaha, NE: +67,960——————————–18. San Jose: +7,533 19. Cincinnati: +64,396———————————–19. Detroit: +7,133 20. Madison, WI: +48,802——————————-20. Madison: +6,798 21. Virginia Beach, VA: +48,429———————-21. Providence: +5,244 22. Milwaukee, WI: +20,282—————————22. Dayton: +2,530 23. Providence, RI: +19,912————————–23. Virginia Beach: +2,480 24. St. Louis, MO: +19,575—————————24. Akron: +949 25. Detroit, MI: +16,685——————————-25. Wichita: +948 26. Wichita, KS: +14,704——————————26. St. Louis: +556 27. Dayton: +4,165————————————-27. Milwaukee: +93 28. Akron: +302—————————————–28. Toledo: -923 29. Canton: -4,501————————————-29. Cleveland: -1,221 30. Toledo: -6,334————————————-30. Canton: -1,238 31. Cleveland: -18,427——————————-31. Youngstown: -2,617 32. Pittsburgh, PA: -22,924————————-32. Pittsburgh: -8,169 33. Youngstown: -23,873—————————-33. Chicago: -13,286
Now, as done with counties, let’s look at the components of population change for metro areas.
Total Births By Metro Census 2010-July 1, 2017 and July 1, 2016-July 1, 2017 Census 2010-July 1, 2017———————————July 1, 2016-July 1, 2017 1. Chicago: +869,178—————————————-1. Chicago: +115,915 2. Detroit: +364,121———————————————-2. Detroit: +49,940 3. Minneapolis: +331,430————————————–3. Minneapolis: +45,810 4. St. Louis: +246,280——————————————4. San Antonio: +34,318 5. San Antonio: +236,348————————————–5. St. Louis: +33,143 6. Charlotte: +217,525——————————————6. Charlotte: +31,315 7. Portland: +201,872——————————————-7. Orlando: +29,173 8. Orlando: +200,843——————————————-8. Portland: +28,220 9. Kansas City: +200,535————————————–9. Columbus: +27,663 10. Sacramento: +198,466————————————10. Kansas City: +27,565 11. Columbus: +197,185—————————————11. Las Vegas: +27,449 12. Cincinnati: +196,146—————————————12. Austin: +27,400 13. Las Vegas: +194,083————————————–13. Sacramento: +27,148 14. Indianapolis: +193,599————————————14. Cincinnati: +26,855 15. Austin: +188,961——————————————–15. Indianapolis: +26,769 16. San Jose: +176,224—————————————-16. Nashville: +24,690 17. Pittsburgh: +173,472—————————————17. San Jose: +23,826 18. Nashville: +170,824—————————————–18. Pittsburgh: +23,614 19. Cleveland: +168,361—————————————19. Cleveland: +22,873 20. Virginia Beach: +163,787———————————20. Milwaukee: +19,474 21. Milwaukee: +144,429————————————–21. Jacksonville: +18,748 22. Jacksonville: +130,339————————————22. Providence: +16,542 23. Providence: +120,526————————————-23. Grand Rapids: +13,548 24. Grand Rapids: +98,214———————————–24. Omaha: +13,421 25. Omaha: +96,558——————————————-25. Dayton: +9,615 26. Dayton: +69,855——————————————-26. Des Moines: +9,172 27. Wichita: +65,873——————————————27. Wichita: +8,694 28. Des Moines: +63,958————————————28. Madison: +7,400 29. Akron: +54,644——————————————–29. Toledo: +7,345 30. Toledo: +54,309——————————————-30. Akron: +7,342 31. Madison: +53,718—————————————-31. Virginia Beach: +5,935 32. Youngstown: +40,696———————————–32. Youngstown: +5,551 33. Canton: +32,199——————————————33. Canton: +4,434
Total Deaths By Metro Census 2010-July 1, 2017 and July 1, 2016-July 1, 2017 Census 2010-July 1, 2017———————————July 1, 2016-July 1, 2017 1. Chicago: -501,469—————————————1. Chicago: -72,491 2. Detroit: -293,091—————————————–2. Detroit: -41,075 3. Pittsburgh: -197,572————————————3. Pittsburgh: -27,439 4. St. Louis: -186,111————————————–4. St. Louis: -26,755 5. Minneapolis: -161,913———————————5. Minneapolis: -23,527 6. Cleveland: -153,138———————————–6. Cleveland: -21,068 7. Cincinnati: -135,975———————————–7. Cincinnati: -19,515 8. Charlotte: -127,523————————————-8. Charlotte: -19,009 9. Portland: -120,590————————————–9. Orlando: -18,268 10. Sacramento: -120,429——————————10. Sacramento: -18,081 11. Kansas City: -119,748——————————11. Portland: -17,875 12. Orlando: -117,771———————————–12. San Antonio: -17,679 13. San Antonio: -117,289——————————13. Kansas City: -17,106 14. Indianapolis: -113,742——————————14. Las Vegas: -16,867 15. Columbus: -108,704——————————–15. Indianapolis: -16,081 16. Las Vegas: -108,003——————————–16. Columbus: -15,833 17. Providence: -107,920——————————-17. Providence: -15,031 18. Nashville: -99,415———————————–18. Nashville: -14,723 19. Virginia Beach: -97,935—————————-19. Milwaukee: -13,399 20. Milwaukee: -95,601———————————20. Jacksonville: -13,288 21. Jacksonville: -86,920——————————-21. San Jose: -11,360 22. San Jose: -73,507———————————–22. Austin: -10,609 23. Austin: -67,704—————————————23. Dayton: -8,359 24. Dayton: -59,736————————————-24. Grand Rapids: -7,674 25. Grand Rapids: -53,725—————————-25. Akron: -7,138 26. Akron: -50,948—————————————26. Youngstown: -6,821 27. Youngstown: -50,302——————————27. Omaha: -6,667 28. Omaha: -47,763————————————-28. Toledo: -5,968 29. Toledo: -42,313————————————-29. Wichita: -5,686 30. Wichita: -40,647————————————30. Des Moines: -4,631 31. Canton: -31,722————————————31. Canton: -4,366 32. Des Moines: -31,563——————————32. Madison: -4,252 33. Madison: -30,385———————————-33. Virginia Beach: -3,280
Total Net Natural Change (Births vs. Deaths) By Metro Census 2010-July 1, 2017 and July 1, 2016-July 1, 2017 Census 2010-July 1, 2017———————————July 1, 2016-July 1, 2017 1. Chicago: +367,709—————————————1. Chicago: +43,424 2. Minneapolis: +169,517———————————–2. Minneapolis: +22,283 3. Austin: +121,257——————————————3. Austin: +16,791 4. San Antonio: +119,059———————————-4. San Antonio: +16,639 5. San Jose: +102,717————————————–5. San Jose: +12,466 6. Charlotte: +90,002—————————————-6. Charlotte: +12,306 7. Columbus: +88,481————————————–7. Columbus: +11,830 8. Las Vegas: +86,080————————————-8. Orlando: +10,905 9. Orlando: +83,072—————————————-9. Indianapolis: +10,688 10. Portland: +81,282————————————-10. Las Vegas: +10,582 11. Kansas City: +80,787———————————11. Kansas City: +10,459 12. Indianapolis: +79,857——————————–12. Portland: +10,345 13. Sacramento: +78,037——————————–13. Nashville: +9,967 14. Nashville: +71,409————————————14. Sacramento: +9,067 15. Detroit: +71,030—————————————15. Detroit: +8,865 16. Virginia Beach: +65,852—————————–16. Virginia Beach: +7,762 17. Cincinnati: +60,171———————————–17. Cincinnati: +7,340 18. St. Louis: +60,169————————————-18. Omaha: +6,754 19. Milwaukee: +48,828———————————-19. St. Louis: +6,388 20. Omaha: +48,795————————————–20. Grand Rapids: +5,874 21. Grand Rapids: +44,489—————————–21. Jacksonville: +5,460 22. Jacksonville: +43,419——————————-22. Des Moines: +4,541 23. Des Moines: +32,395——————————-23. Madison: +3,148 24. Wichita: +25,226————————————-24. Milwaukee: +6,075 25. Madison: +23,333———————————–25. Wichita: +3,008 26. Cleveland: +15,223——————————–26. Cleveland: +1,805 27. Providence: +12,606——————————27. Providence: +1,511 28. Toledo: +11,996———————————–28. Toledo: +1,377 29. Dayton: +10,119———————————-29. Dayton: +1,256 30. Akron: +3,696————————————–30. Akron: +204 31. Canton: +477—————————————31. Canton: +68 32. Youngstown: -9,606——————————-32. Youngstown: -1,270 33. Pittsburgh: -24,100——————————–33. Pittsburgh: -3,825
Total Domestic Migration By Metro Census 2010-July 1, 2017 and July 1, 2016-July 1, 2017 Census 2010-July 1, 2017———————————July 1, 2016-July 1, 2017 1. Austin: +224,351—————————————–1. Charlotte: +31,102 2. Charlotte: +177,484————————————-2. Austin: +30,120 3. San Antonio: +169,684——————————–3. Las Vegas: +29,414 4. Orlando: +155,498————————————–4. San Antonio: +24,891 5. Nashville: +126,142————————————-5. Orlando: +23,321 6. Las Vegas: +119,742———————————-6. Jacksonville: +18,921 7. Portland: +106,839————————————-7. Nashville: +18,708 8. Jacksonville: +87,040———————————8. Portland: +13,384 9. Sacramento: +49,262———————————9. Sacramento: +12,888 10. Columbus: +42,932———————————10. Columbus: +12,562 11. Des Moines: +32,042——————————-11. Kansas City: +8,531 12. Indianapolis: +30,772——————————-12. Minneapolis: +8,095 13. Kansas City: +16,802——————————-13. Indianapolis: +7,763 14. Madison: +13,224————————————14. Des Moines: +4,812 15. Grand Rapids: +12,355—————————-15. Grand Rapids: +2,217 16. Omaha: +5,265—————————————16. Madison: +1,706 17. Minneapolis: +432———————————–17. Cincinnati: +1,541 18. Canton: -5,797—————————————-18. Omaha: +383 19. Akron: -13,427—————————————-19. Dayton: -346 20. Youngstown: -16,228——————————-20. Akron: -877 21. Dayton: -16,864————————————–21. Canton: -1,469 22. Wichita: -18,452————————————–22. Youngstown: -1,711 23. Cincinnati: -21,259———————————-23. Providence: -2,588 24. Toledo: -23,102————————————–24. Toledo: -3,070 25. Pittsburgh: -24,397———————————25. Wichita: -3,235 26. Providence: -33,335——————————-26. Virginia Beach: -4,706 27. Milwaukee: -50,575——————————–27. Cleveland: -8,008 28. Virginia Beach: -51,916—————————28. Pittsburgh: -8,633 29. Cleveland: -64,353——————————–29. Milwaukee: -9,635 30. St. Louis: -67,560———————————30. St. Louis: -8,828 31. San Jose: -73,026——————————–31. Detroit: -14,863 32. Detroit: -141,006———————————-32. San Jose: -25,729 33. Chicago: -479,482——————————–33. Chicago: -85,177
Total International Migration By Metro Census 2010-July 1, 2017 and July 1, 2016-July 1, 2017 Census 2010-July 1, 2017———————————July 1, 2016-July 1, 2017 1. Chicago: +183,162—————————————1. Chicago: +28,302 2. Orlando: +135,860—————————————2. Orlando: +22,207 3. San Jose: +132,938————————————-3. San Jose: +20,747 4. Detroit: +86,366——————————————4. Detroit: +13,214 5. Minneapolis: +83,552———————————-5. Minneapolis: +13,107 6. Sacramento: +49,560———————————-6. Austin: +8,185 7. Austin: +49,311——————————————7. Sacramento: +7,722 8. Las Vegas: +46,411————————————8. Columbus: +7,350 9. Columbus: +45,744————————————9. Las Vegas: +7,221 10. Providence: +41,325——————————–10. Providence: +6,381 11. San Antonio: +40,953——————————-11. Portland: +6,335 12. Charlotte: +39,380———————————–12. Charlotte: +6,279 13. Portland: +38,542————————————13. San Antonio: +6,173 14. Virginia Beach: +34,619—————————-14. Nashville: +5,510 15. Nashville: +33,169———————————–15. Cleveland: +5,045 16. Cleveland: +31,236———————————-16. Indianapolis: +4,603 17. Indianapolis: +30,329——————————-17. Pittsburgh: +4,359 18. Jacksonville: +28,593——————————-18. Cincinnati: +4,285 19. St. Louis: +27,666————————————19. Jacksonville: +4,043 20. Pittsburgh: +27,300———————————20. St. Louis: +4,032 21. Cincinnati: +26,502———————————21. Milwaukee: +3,689 22. Kansas City: +23,098——————————22. Kansas City: +3,572 23. Milwaukee: +22,616——————————–23. Grand Rapids: +2,233 24. Omaha: +14,383————————————24. Omaha: +2,213 25. Grand Rapids: +13,800—————————25. Madison: +1,949 26. Madison: +12,367———————————-26. Des Moines: +1,807 27. Des Moines: +11,592—————————–27. Dayton: +1,654 28. Dayton: +11,230———————————–28. Akron: +1,647 29. Akron: +10,413————————————-29. Wichita: +1,187 30. Wichita: +8,117————————————-30. Virginia Beach: +1,077 31. Toledo: +4,627————————————-31. Toledo: +769 32. Youngstown: +2,171——————————32. Youngstown: +381 33. Canton: +1,118————————————33. Canton: +174
Total Net Migration By Metro Census 2010-July 1, 2017 and July 1, 2016-July 1, 2017 Census 2010-July 1, 2017———————————July 1, 2016-July 1, 2017 1. Orlando: +291,358————————————–1. Orlando: +45,528 2. Austin: +273,662—————————————-2. Austin: +38,305 3. Charlotte: +216,864————————————3. Charlotte: +37,381 4. San Antonio: +210,637——————————–4. Las Vegas: +36,635 5. Las Vegas: +166,153———————————-5. San Antonio: +31,064 6. Nashville: +159,311————————————6. Nashville: +24,218 7. Portland: +145,381————————————7. Jacksonville: +22,964 8. Jacksonville: +115,633——————————-8. Minneapolis: +21,202 9. Sacramento: +98,822——————————–9. Sacramento: +20,610 10. Columbus: +88,676——————————–10. Columbus: +19,912 11. Minneapolis: +83,984——————————11. Portland: +19,719 12. Indianapolis: +61,101——————————12. Indianapolis: +12,366 13. San Jose: +59,912———————————-13. Kansas City: +12,103 14. Des Moines: +43,634——————————14. Des Moines: +6,619 15. Kansas City: +39,900——————————15. Cincinnati: +5,826 16. Grand Rapids: +26,155—————————16. Grand Rapids: +4,450 17. Madison: +25,591———————————-17. Providence: +3,793 18. Omaha: +19,648————————————18. Madison: +3,655 19. Providence: +7,990———————————19. Omaha: +2,596 20. Cincinnati: +5,243———————————-20. Dayton: +1,308 21. Pittsburgh: +2,903———————————-21. Akron: +770 22. Akron: -3,014—————————————-22. Canton: -1,295 23. Canton: -4,679————————————–23. Youngstown: -1,330 24. Dayton: -5,634————————————–24. Detroit: -1,649 25. Wichita: -10,335————————————25. Wichita: -2,048 26. Youngstown: -14,057—————————–26. Toledo: -2,301 27. Virginia Beach: -17,297————————–27. Cleveland: -2,963 28. Toledo: -18,475————————————28. Virginia Beach: -3,629 29. Milwaukee: -27,959——————————29. Pittsburgh: -4,274 30. Cleveland: -33,117——————————-30. San Jose: -4,982 31. St. Louis: -39,894———————————31. St. Louis: -5,796 32. Detroit: -54,640————————————32. Milwaukee: -5,946 33. Chicago: -296,320——————————-33. Chicago: -56,875
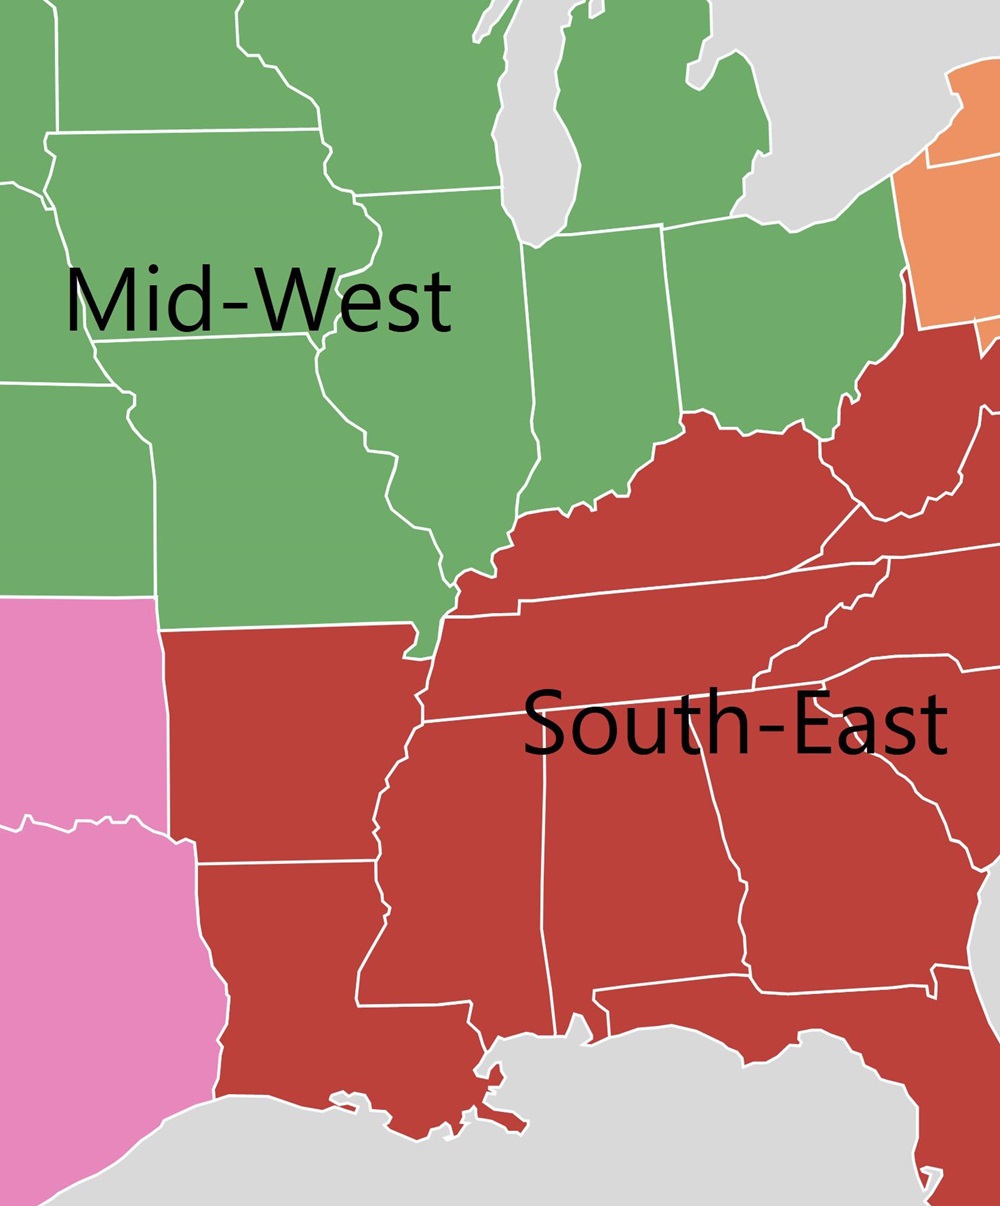
For years, if not decades, we’ve been hearing a familiar tale- that anyone and everyone is moving from the Midwest and Northeast to the South and West. This trend began during and after the collapse of Northern manufacturing, and as higher cost of living began to make the lower-cost South more attractive in particular. However, a lot of the South’s growth over the years- indeed a majority- never had anything to do with region-to-region migration. Instead, it was due largely to natural growth (births vs. deaths) and international migration, particularly from Central America. What received all the attention, though, was the belief that people were packing up and moving to the South from places like Ohio and other struggling Northern states. While that may have been true for a while, that is increasingly looking like it is no longer the case.
The Midwest, especially, has been derided as the region no one wants to live in. Despite its growing population approaching 66 million people, the common refrain was that its colder winters, flailing economies and questionable demographic future meant that it was simply a region being left behind by the booming Southern states.
Recently, the US Census released estimates for 2015-2016 geographic mobility, and they tell a very different story altogether. Regional domestic migration in 2016 may have actually bucked the trends.
First, let’s look at the total domestic migration moving to the Midwest from other regions. South to Midwest: +309,000 West to Midwest: +72,000 Northeast to Midwest: +61,000 Total to Midwest: +442,000
And then compare that to the total that the Midwest sends to other regions. Midwest to South: -254,000 Midwest to West: -224,000 Midwest to Northeast: -34,000 Total from Midwest: -512,000
Net difference by region. Midwest vs. South: +55,000 Midwest vs. West: -152,000 Midwest vs. Northeast: +27,000 Total Net: -70,000
So while the Midwest is seeing an overall net domestic migration loss, it is entirely to the Western states.
This could just be an off year, as almost all recent years showed losses to the South, but then again, maybe not. The South has been in a boom for several decades now, and in that time, the region still lags the other 3 in almost every quality of life metric used. All booms end eventually, and the South’s 2 biggest perceived advantages, low cost of living and business-friendly climate, have been gradually eroding over time. As Census surveys show, people don’t actually move for a change in weather, so it’s the economic factors that are going to make the biggest impacts long-term. The Midwest now has many cities and several states that are doing well economically, including Columbus, and perhaps they are becoming more attractive than they have in many years. Time will tell, but last year, the narrative of an unattractive Midwest vs. South was at least temporarily shelved.