In today’s edition of the series, we have a Cool Link for the 1950 Census. 1950 census data was already available on different websites, but it was general population and demographic data only. The National Archives and Record Administration, or NARA, has now released complete records. Many of these records were unavailable to the general public prior to this release because the data fell under what’s called the “72 Year Rule”, in which the US government will not release any personally identifiable information until 72 years has passed after the date of data collection. With the 1950 Census, that time has come.
You can search the records by place, record type or even by a person’s name. This is great not only for historic population and demographic data, but also for genealogical research into family histories.
The Columbus economy in February 2022 continued its slow recovery from the Covid pandemic crash of 2020. Let’s break it down.
Overall Metro Area February 2022 and Change from February 2021 Labor Force: 1,126,967 +9,435 Employed: 1,085,393 +27,948 Unemployed: 41,574 -18,513 Unemployment Rate: 3.7% -1.7 Total Non-Farm Jobs: 1,102,000 +25,400
Overall Metro Area February 2022 and Change from February 2020 (Pre-Pandemic) Labor Force: 1,126,967 +10,719 Employed: 1,085,393 +13,820 Unemployed: 41,574 -3,101 Unemployment Rate: 3.7% -0.3 Total Non-Farm Jobs: 1,102,000 -9,400 In most categories, the metro area overall has fully recovered to levels just before the pandemic crash- and has improved upon most metrics. Non-farm jobs is the only area that has not yet fully recovered.
Now let’s view the results by industry.
Mining/Logging/Construction 2/2020———–2/2021———-2/2022 42,500————41,000———44,400 The construction industry (Columbus doesn’t have a significant mining or logging industry) has surpassed pre-Covid levels.
Manufacturing 2/2020———–2/2021———-2/2022 73,000———–71,700———-72,600 Manufacturing hasn’t fully recovered, but appears likely to within the next few months.
Trade/Transportation/Utilities 2/2020———–2/2021———-2/2022 215,600———-222,800———234,900 This industry has gone well past pre-pandemic levels is one of the strongest performing in the metro area.
Information 2/2020———–2/2021———-2/2022 16,500———–15,200———-16,500 Information has fully recovered to pre-pandemic levels, but only just. It remains to be seen how much further it will improve as the industry had been losing jobs steadily since the end of 2018.
Financial Activities 2/2020———–2/2021———-2/2022 85,900———–85,000———-84,600 Unlike other industries, financial activities did not drop significantly during the crash. It did fully recover all lost jobs by November of 2021, but has slid some since.
Professional and Business Services 2/2020———–2/2021———-2/2022 178,800———-176,500———175,400 As with the Financial Activities sector, this industry did fully recover by the fall of 2021, but is now lagging a bit.
Education and Health Services 2/2020———–2/2021———-2/2022 165,100———-158,500———159,700 Although recovering slowly and ahead of last year, this industry has yet to return to pre-pandemic levels. Part of the reason for this may have been the mass resignations within the health industry due to burnout from stress.
Leisure and Hospitality 2/2020———–2/2021———-2/2022 106,800———-87,200———-96,500 This industry was arguably hit the hardest of any during the pandemic crash (jobs fell by nearly 50%), and in many cases has struggled to fill existing jobs as the economy has improved. Still, trends suggest that the industry will be fully recovered by this summer.
Other Services 2/2020———–2/2021———-2/2022 41,900———–38,800———-40,400 Another industry that will likely be fully recovered by summer or early fall.
Government 2/2020———–2/2021———-2/2022 185,300———-179,900———177,000 As the state capital, Columbus has always been heavy in this industry. However, for whatever reason, government jobs just haven’t been coming back as much and may not recover fully until sometime next year.
While the overall metro has largely recovered, several industries have not. However, most are trending towards passing pre-pandemic levels by this summer- barring any other economic problems from Covid or global events.
The Bureau of Labor Statistics, the source of this data, is useful for local employment data for any metro area in the United States.
I largely avoid politics here because it’s a much more subjective topic that is far less data-focused in nature than what I try to provide here, so the most political I’ve gotten was to provide past election results and county voting trends with no political commentary. This post will attempt to maintain that line between data and opinion, but I understand that the topic of politics and Covid-19 is already a very controversial mix, and simply sticking to the data won’t necessarily be perceived as unbiased by all who read this. With that in mind, I can only say that this post is based on existing, straightforward data, and I have made no attempts to add any personal biases to the results one way or another. With all that said, I was curious whether there was any correlation between voting patterns and Covid cases/deaths locally, specifically with Ohio’s 88 counties. There has been some suggestion in the media that Red- or Republican-voting places- have generally had worse outcomes than Blue- or Democratic-voting counties. So we will look at the following factors to see if that holds true locally: 1. Total Cases 2. Total Cases Per Capita 3. Total Deaths 4. Total Deaths Per Capita
But we first must establish what the Red vs. Blue counties are. Ohio doesn’t register voters by party affiliation, so instead, I used county voting results for the past 6 presidential elections, or since 2000. Based on the % of voters voting for either Republican or Democrat, I created 5 different levels of political bias. Deep Blue: Counties where Democratic voters beat Republican voters by 25 points or more. Light Blue: Counties where Democratic voters beat Republican voters by 5-24 points. Neutral: Counties where Democratic/Republican voter advantage falls under 5 points. Light Red: Counties where Republican voters beat Democratic voters by 5-24 points. Deep Red: Counties where Republican voters beat Democratic voters by 25 points or more. The point system is taken from the average of the past 6 elections, so keep in mind that some counties may be more Red or Blue currently than the average suggests.
So based on that criteria, which Ohio counties are Red vs. Blue vs. Neutral? Well, Ohio’s overwhelming rural counties are mostly in the Deep Red category (39 of 88), followed by Light Red (34 of 88), Neutral (7 of 88), Light Blue (7 of 88) and just 1 Deep Blue county in the state. The map below breaks the counties down and gives the average voting bias across the last 6 elections.
Now we need to take those established voting biases and compare them to how the counties performed during Covid-19. Case Numbers Through 3/31/2022 Total All Red Counties: 1,230,285 Total All Neutral Counties: 498,375 Total All Blue Counties: 944,141 Average Total Cases by County Group Deep Red Counties: 15,138.8 Light Red Counties: 18,819.8 Neutral Counties: 71,196.4 Light Blue Counties: 96,563.6 Deep Blue County: 268,196 On first glance, it would seem that Red counties did much better on average despite having more cases overall, but the problem is that those counties have much lower populations and literally cannot have the same average totals of more populated ones. That’s why we instead have to look at per-capita cases. Total Cases Per 100K People All Red Counties: 23.9 All Neutral Counties: 22.8 All Blue Counties: 21.9 Deep Red Only: 23.7 Light Red Only: 24.0 Neutral Only: 22.8 Light Blue Only: 22.0 Deep Blue Only: 21.7 With per-capita, the story is exactly the opposite, with Red counties having more cases by population. If you’re wondering why the Deep Red counties had a slightly lower per-capita rate than Light Red, the answer is Holmes County. Perhaps due to its heavy Amish population that tends to avoid modern medicine and technology- and largely keep to themselves in the process- reported per-capita cases there were the lowest in the state by far, and single-handedly lowered the entire Deep Red county grouping below Light Red counties. Regardless, the outcome was still the same- Red did worse. Top 10 Highest Per-Capita Case Rate 1. Marion: 30.5 2. Lawrence, Scioto: 30.0 3. Pickaway: 29.9 4. Muskingum: 29.3 5. Jackson: 27.4 6. Fayette: 27.3 7. Guernsey: 26.9 8. Allen, Defiance, Pike: 26.8 9. Union: 26.4 10. Clark, Erie: 26.1 Top 10 Lowest Per-Capita Case Rate 1. Holmes: 11.6 2. Geauga: 17.1 3. Carroll: 19.5 4. Wayne: 20.0 5. Meigs: 20.1 6. Ashtabula: 20.3 7. Washington: 20.6 8. Summit: 20.7 9. Ottawa: 20.9 10. Trumbull: 21 Of course, one of the caveats with this data is that many, many cases went unreported, and those cases were more likely to be in rural areas with lower access to testing and medical facilities. There’s also the issue that Covid doesn’t always present with symptoms. So, it’s possible that the per-capita discrepancy was even larger. Deaths, however, are more concrete. Not all of them have been counted either, obviously, but it’s a lot harder to hide a death than it is a symptomless case. Total Deaths Through 3/31/2022 All Red Counties: 18,295 All Neutral Counties: 7,219 All Blue Counties: 12,523 Average Total Deaths by County Group Deep Red: 227.6 Light Red: 277.0 Neutral: 1,031.3 Light Blue: 1,253.3 Deep Blue: 3,750.0 Again, on the surface, the average looks bad for Blue counties despite having the lower overall total, but the truth again rests with the per-capita figures. Total Deaths Per Capita by County Group Deep Red: 394.4 Light Red: 390.4 Neutral: 345.4 Light Blue: 328.6 Deep Blue: 304.0 On a per-capita basis, Blue counties lost 76 fewer people per 100K than did Red counties. That’s a lot of lives.
So what can be concluded from all this? The first is that the results in Ohio were not isolated. Across almost all states, Blue-leaning states had better outcomes per-capita than Red. Speculation as to why that is runs the gamut, from better overall local policies to differing views on science to even education levels and access to harmful media sources that disseminate misinformation. Whatever the case may be, the United States has lost more people than any other nation in the world, at now over 1 million. It is by far the worst pandemic and the worst natural disaster in American history. With so much bad news these days, we can only hope that something valuable has been learned in all this terrible mess.
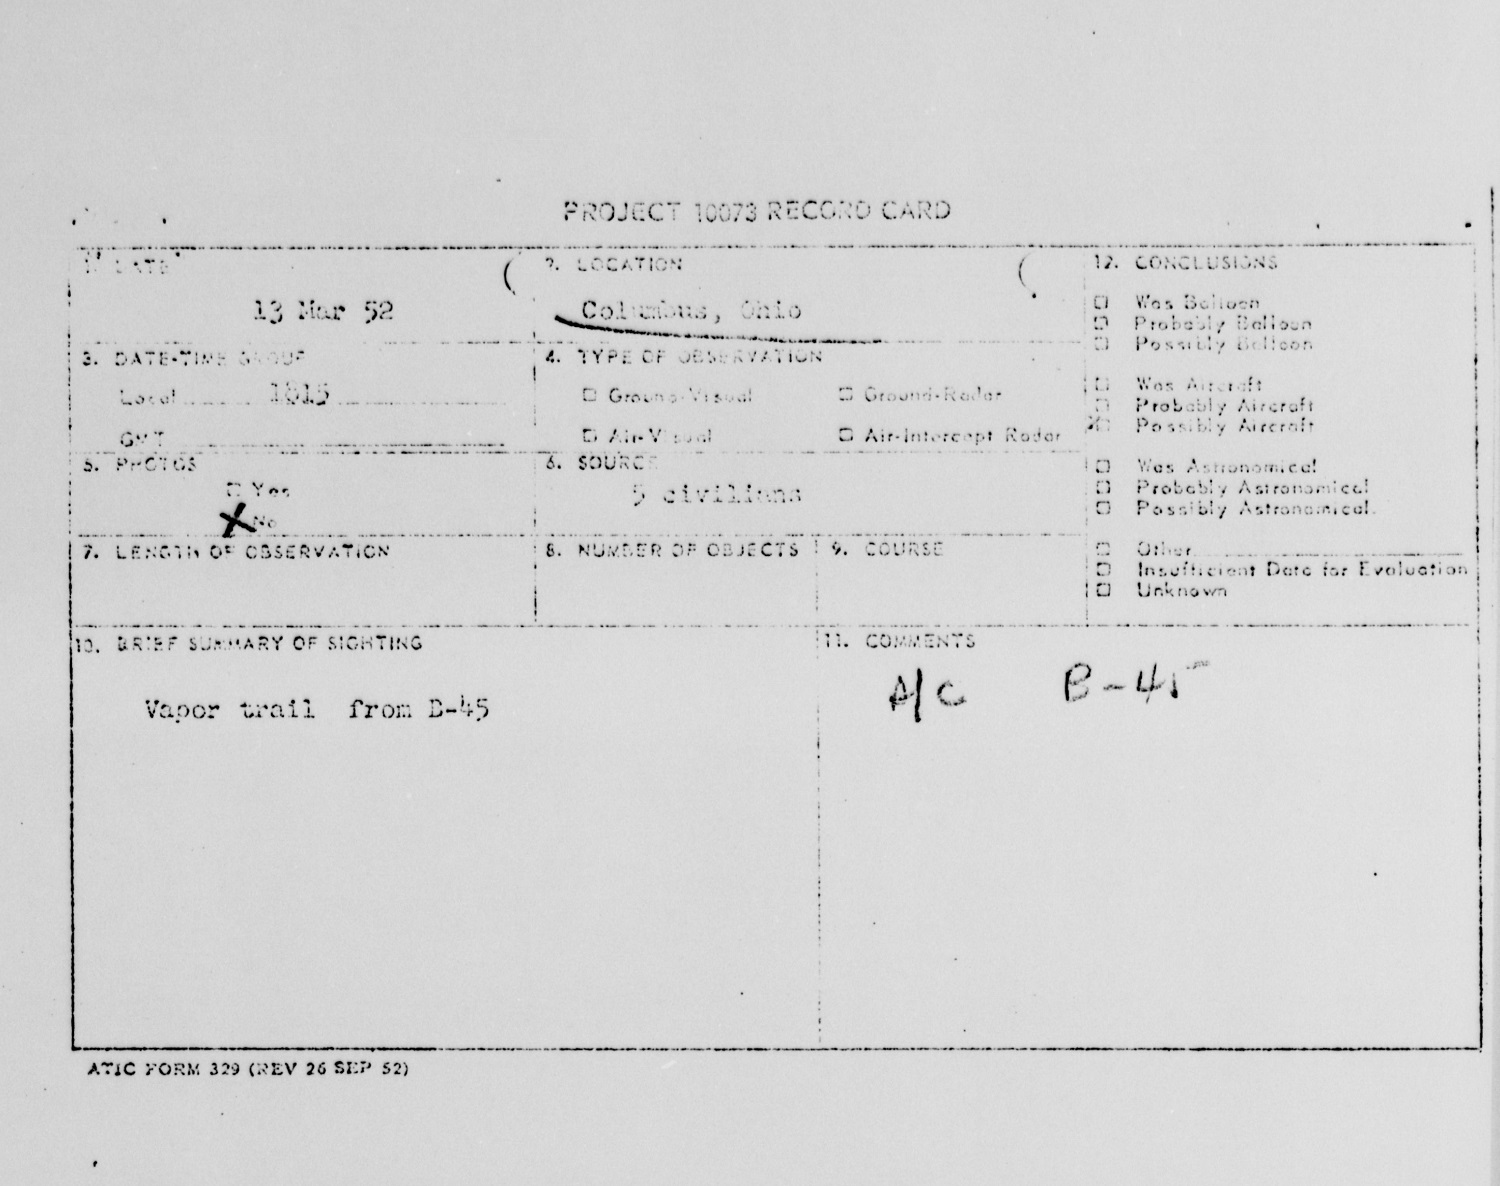
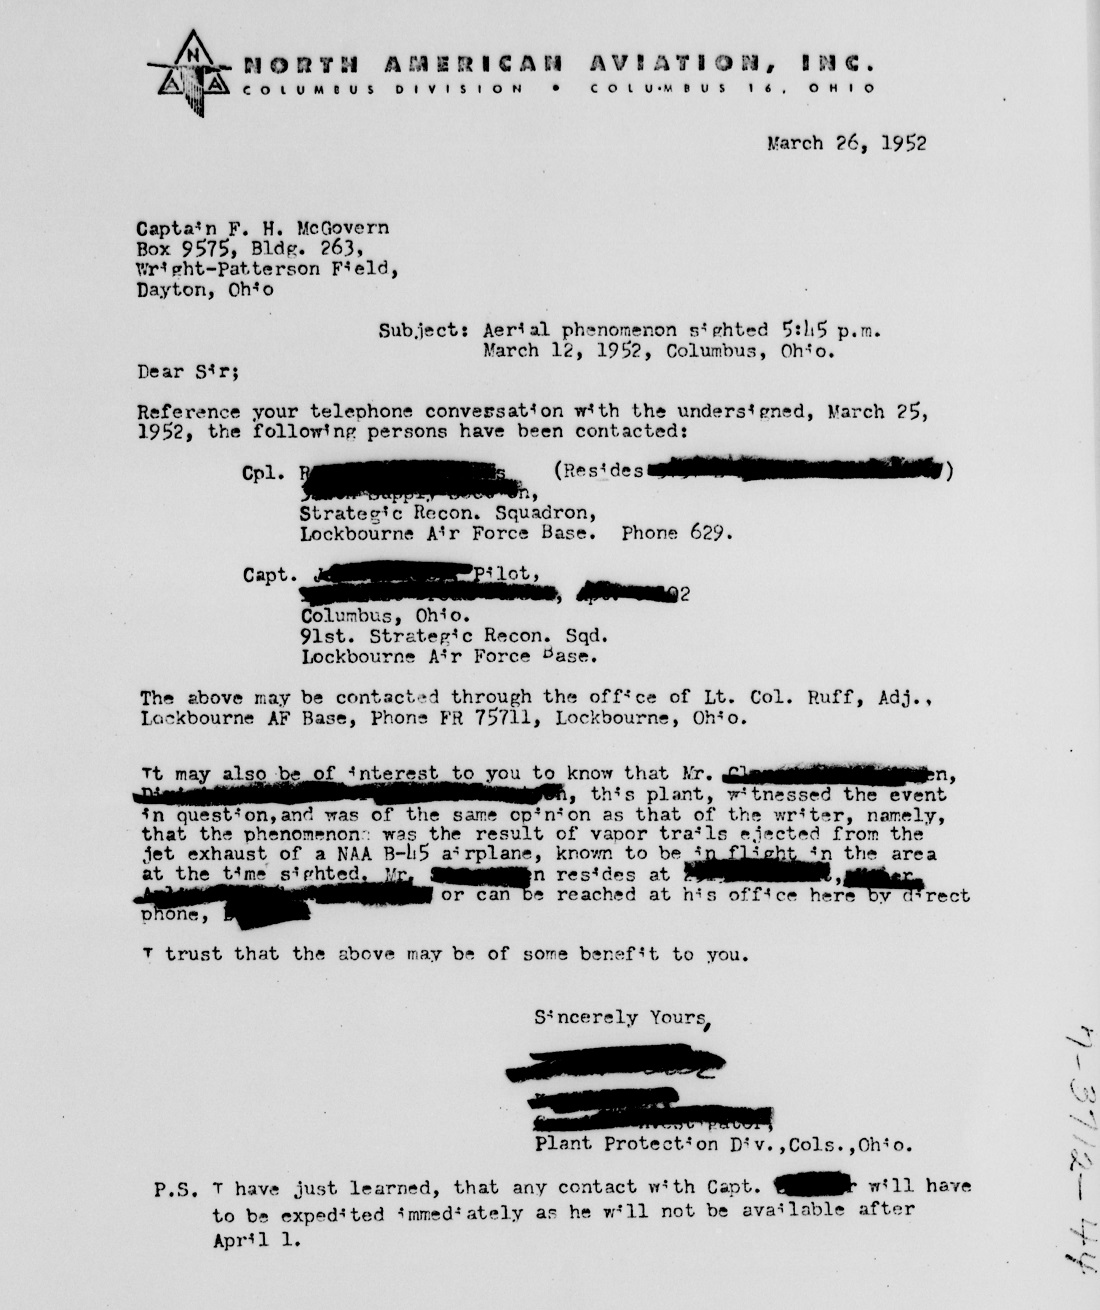
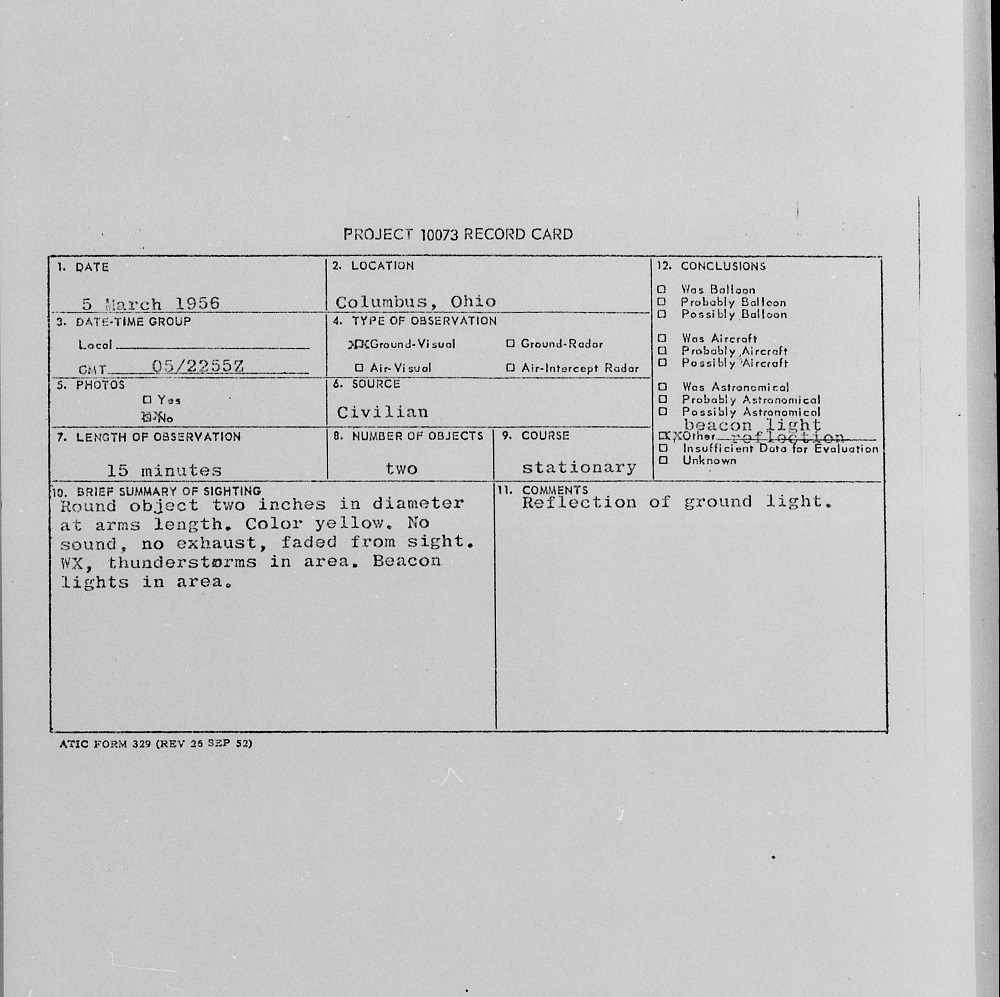
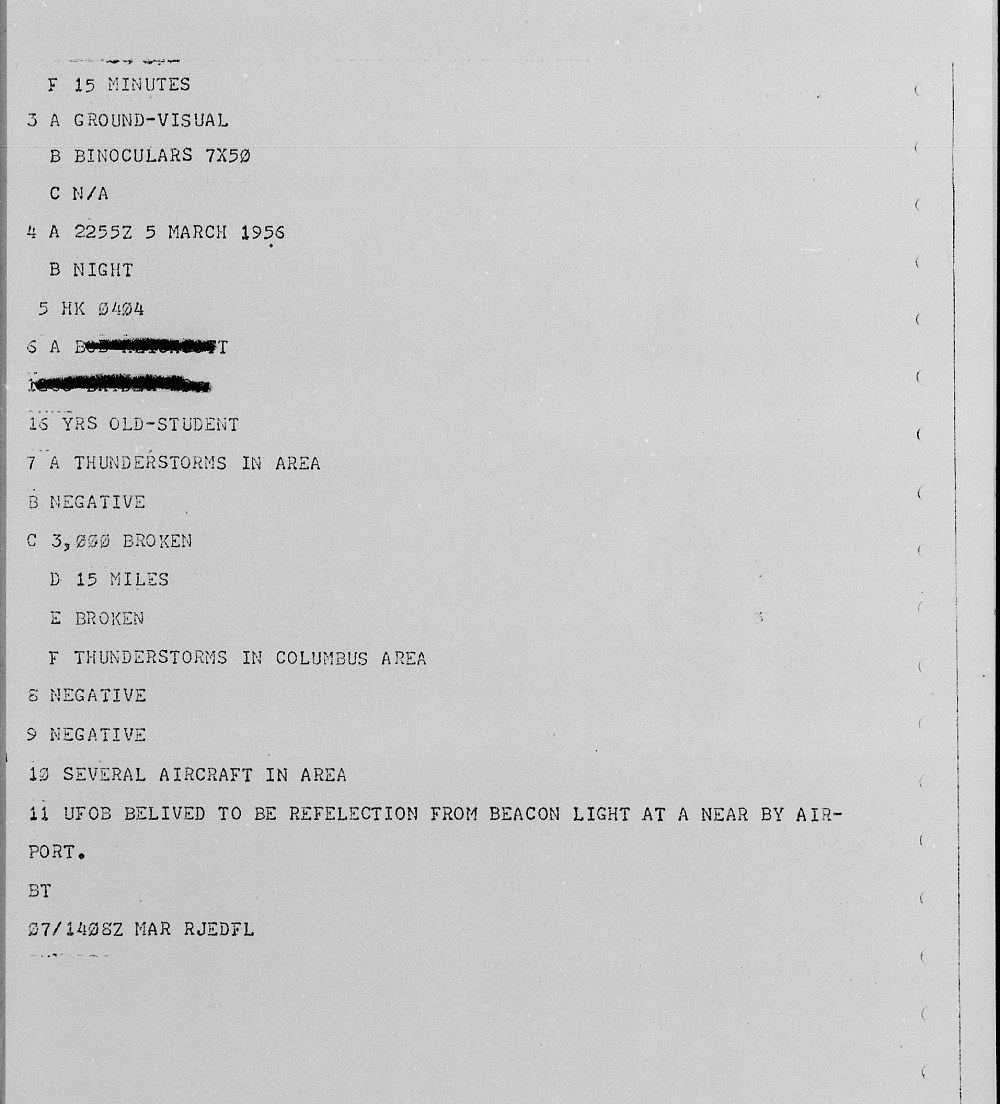
From the files of Project Blue Book, this UFO incident was thought to be a beacon light reflection from a nearby airport. The actual dates of this incident is in question as two different ones are given. On one hand, it suggests the report was submitted in August, 1954, but all other dates suggest it occurred in March, 1956.
To see more incidents from around the world, check out the following link. UFO Database