The US Census 2017 demographic estimates came out today for cities and counties, and they show that Columbus is continuing to change quickly.
Highlights for the City of Columbus -The non-Hispanic Asian population continues to skyrocket, up over 67% since 2010. -Beyond that, all other racial groups saw population growth within the city since 2010. -The foreign-born population has climbed above 105,000, and now represents 12% of the total population, the highest % level since 1890. -Every age group has increased since 2010, but the older working-age population increased the most, as seen below: 19 and Under: +17,962 20-34: +22,627 35-64: +32,045 65+: +22,234
Check out all of the City, County and Metro Area demographic and population data on the Demographics and Population page.
Columbus, as recent estimates show, is clearly becoming a real player on the national stage in terms of its rapid growth and increasing name recognition. There’s a lot to be proud of for a city located in what many people think is just the Rust Belt. But as with every city, Columbus doesn’t get it all right all the time. A while back, I wrote how Columbus could sometimes be a city of missed opportunities when it came to development, and that remains true. For every great project in the Short North, there’s an equally terrible development going up somewhere else. In what I want to be a semi-regular series, I’m going to highlight some projects that simply miss the boat in terms of good urban development. Some are merely not reaching their potential, and then some, like June’s missed opportunity of the month, is an out of left field example that seems to be trying so hard, only to fail equally so.
That project is the redevelopment of the University City strip mall off of Olentangy River Road.
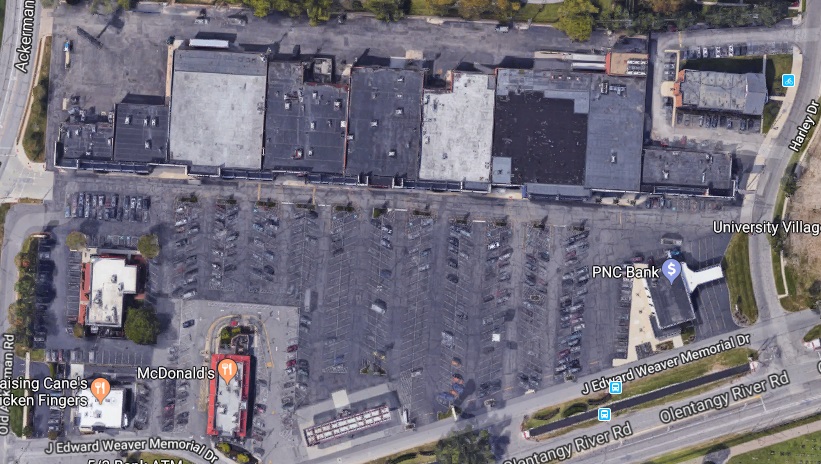
Aerial photo.
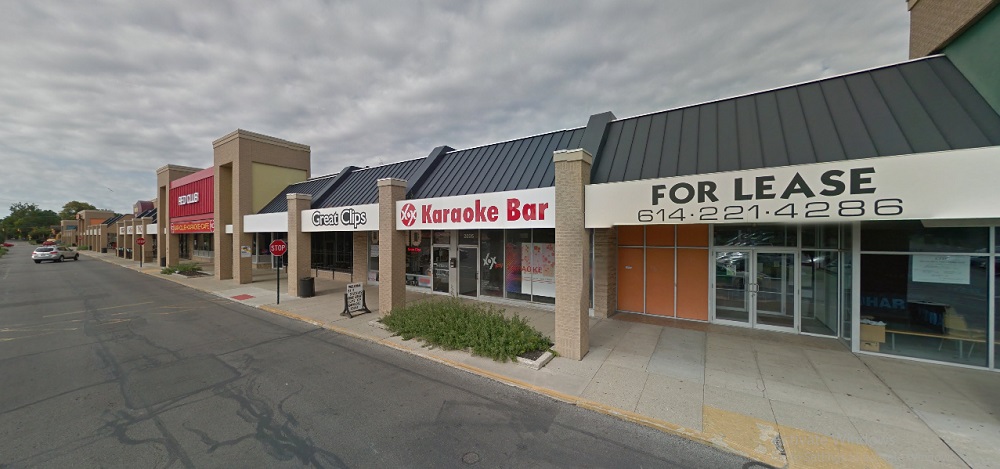
As you can see from the aerial, the site is your typical strip mall. Built in 1961 when such developments were seen as community shopping destinations rather than the dying suburban sprawl they have become, University City is completely nondescript and looks no different than hundreds of others dotting the landscape. Anchored by a Kroger, the strip mall held other stereotypical establishments- a salon, bars, a Chinese restaurant, etc. A handful of out lots contain a McDonald’s, gas station and a bank.
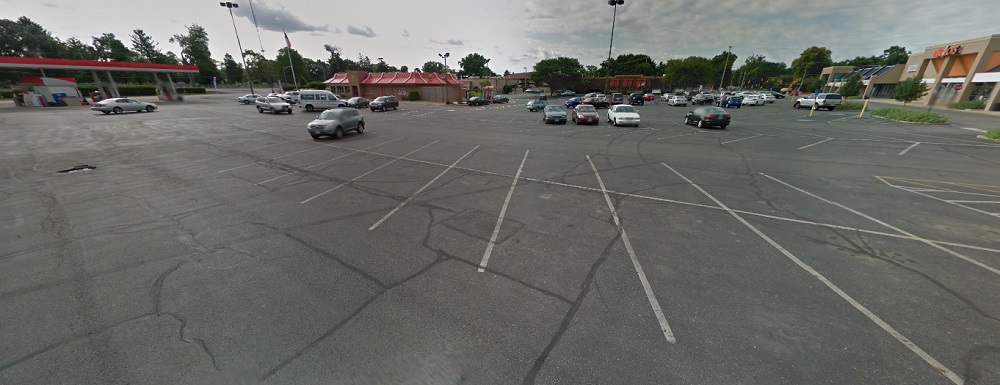
Most of the site, of course, is taken up by enormous amounts of surface parking, most of which sits empty more often than not.
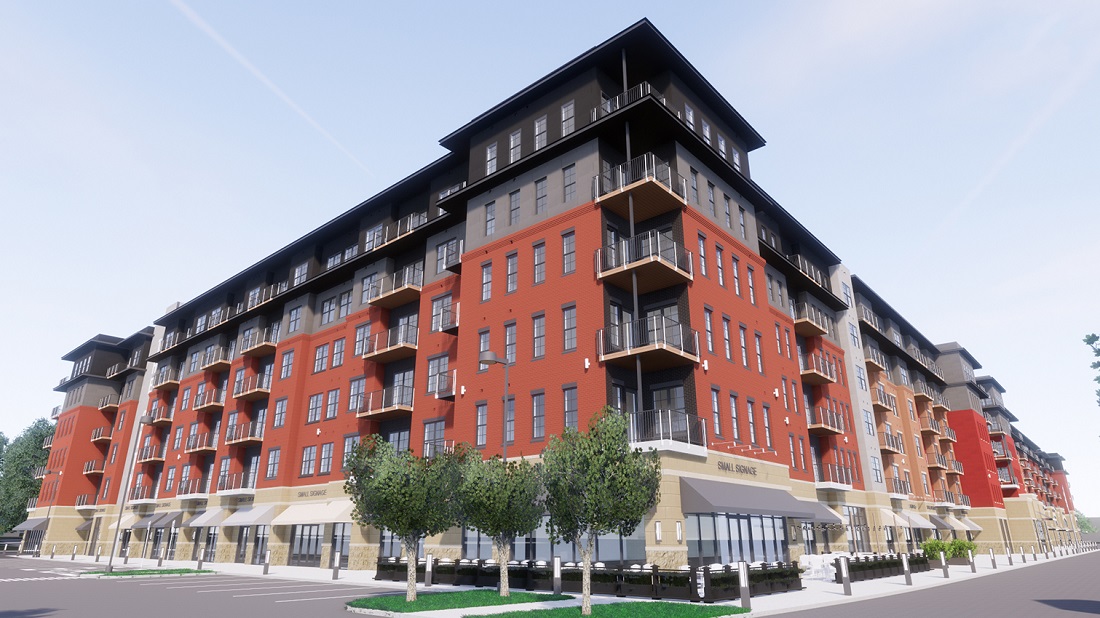
Olentangy River Road is not exactly an urban street. Most of it is lined with hotels, restaurants and offices, all set well back from the road and in a generally unfavorable configuration to encourage walkability. So when it was announced in June of last year that the strip mall would be redeveloped, hope for something substantially different seemed possible. The initial renderings showed a 6-story mixed-use building on the site instead of the strip mall.
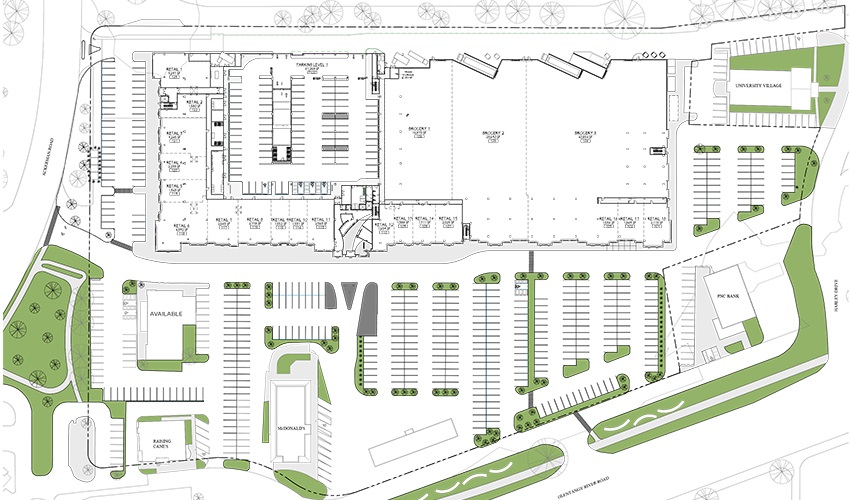
MUCH better, right? Of course, saying it’s much better is a low bar compared to the current situation, but a 6-story, mixed-use project is truly urban, and one of the first of its kind on Olentangy River Road. So why, one might ask, is this a missed opportunity? To answer that, we have to look at the proposed layout of the entire site.
Comparing the proposed layout to the current one is a little confusing, because they look extremely similar. It seems that the 6-story project will only replace the current strip center, but most of the parking and all of the out lots will remain intact. It’s a Frankenstein’s monster of suburban and urban elements that just looks really weird. There is no interaction with any of the nearby roads, and not even a resident pathway from the main building to the multi-use path that was built a few years ago along Olentangy. It’s all still catering to cars. In the most recent rendering of the main building, seen below, there appears to be only 1 patio space for what is clearly a very large project. The view for customers from there, of course, is still just the parking lot, with its noise, pollution and lack of any shade. In fact that’s basically the view out of every window in the building- parking lots.
I suppose that some surface lots and outbuildings could eventually be redeveloped at some point, but as it stands now, there’s a lot to be desired. The main building is decent, but the overall layout and connections are terrible and it makes the whole project just look like a much larger version of the strip mall that’s already there. Maybe that’s a harsh assessment, but I don’t think it’s an unfair one. Casto, the developer, basically invented the strip mall, so they’re clearly playing to their strengths here. They’ve done some really good projects at times, like the renovation of the Julian building on South Front Street in Downtown, and I applaud the effort to go more urban in this location, but I think so much could’ve been done better in this case. No doubt that this development will have no trouble finding tenants to rent the apartments, just due to the lack of housing anywhere in the core, but I question just what this development offers that better ones don’t.
In the end, it is a good example of how Columbus needs more true urban developers that are comfortable and willing to push the envelope on this style of development. Trying to have it both ways, where suburbia reigns in an urban location, gets us nowhere.
So once again, 2017 Ohio city population estimates came out today from the Census. As has been the case for a long time now, Columbus is rocketing upward at record pace. The 2016 comparison numbers have been adjusted by the Census for the 2017 update.
Some milestones include Grove City and Lancaster passing 40,000 for the first time and Johnstown passing the 5,000 mark. 11 places lost population, 8 stayed the same and 83 gained population. The growing portions of the Columbus metro continue to encompass the vast majority of incorporated places.
Nationally, here were the top 20 fastest-growing cities by numerical change between July 1, 2016 and July 1, 2017 1. San Antonio, Texas: +24,208 2. Phoenix, Arizona: 24,036 3. Dallas, Texas: +18,935 4. Fort Worth, Texas: +18,664 5. Los Angeles: 18,643 6. Seattle, Washington: +17,490 7. Charlotte, North Carolina: +15,551 8. Columbus: +15,429 9. Frisco, Texas: +13,470 10. Atlanta, Georgia: +13,323 11. San Diego, California: +12,834 12. Austin, Texas: +12,515 13. Jacksonville, Florida: +11,169 14. Irvine, California: +11,068 15. Henderson, Nevada: +10,534 16. Las Vegas, Nevada: 9,966 17. Denver, Colorado: 9,844 18. Washington, DC: 9,636 19. Tampa, Florida: 9,383 20. Mesa, Arizona: 9,025
Now that we have the full set of 2017 population estimates, I wanted to examine a popular claim a little more closely. The claim is that suburban growth far exceeds that of core cities/counties, and it’s often repeated in media throughout the country. One of the things that always bothered me about this was the constant use of basing this claim largely on % change. This has a major flaw, one that I will go into more below.
For this little study on suburban vs urban growth, I will look at the top 50 largest metro areas.
First, let’s look at the total change in the whole metro area, the core county and the core city between the 2010 Census and July 1, 2017. They will be ranked here by total metro change. 1. Dallas, TX: +973,431 2. Houston, TX: +971,941 3. New York, NY: +754,396 4. Atlanta, GA: +597,993 5. Miami, FL: +592,525 6. Washington, DC: +580,228 7. Phoenix, AZ: +544,141 8. Los Angeles, CA: +524,946 9. Seattle, WA: +427,240 10. Austin, TX: +399,507 11. San Francisco, Ca: +391,784 12. Orlando, FL: +375,432 13. Riverside, CA: +355,705 14. Denver, CO: +344,635 15. San Antonio, TX: +331,458 16. Charlotte, NC: +308,313 17. Tampa, FL: +307,930 18. Boston, MA: +283,935 19. Las Vegas, NV: +252,810 20. Minneapolis, MN: +251,760 21. San Diego, CA: +242,343 22. Nashville, TN: +232,162 23. Portland, OR: +227,167 24. Raleigh, NC: +204,590 25. Columbus: +176,724 26. Sacramento, CA: +175,740 27. San Jose, CA: +161,523 28. Jacksonville, FL: +159,382 29. Indianapolis, IN: +140,524 30. Oklahoma City, OK: +130,746 31. Philadelphia, PA: +130,427 32. Kansas City, MO: +119,574 33. Salt Lake City, UT: +115,297 34. Baltimore, MD: +97,572 35. Richmond, VA: +86,117 36. New Orleans, LA: +85,903 37. Chicago: +71,499 38. Cincinnati: +64,396 39. Louisville, KY: +58,247 40. Virginia Beach, VA: +48,429 41. Memphis, TN: +23,433 42. Birmingham, AL: +21,751 43. Milwaukee, WI: +20,282 44. Providence, RI: +19,912 45. St. Louis, MO: +19,575 46. Detroit: +16,685 47. Buffalo, NY: +1,239 48. Hartford, CT: -2,139 49. Cleveland: -18,427 50. Pittsburgh, PA: -22,924
Now that we have the total growth, let’s break it down a bit more.
How much of the total metro change occurred in the core county of each metro? This will be ranked by the highest to lowest % occurring in the core county.
*New York includes all 5 main boroughs, so it is different than core county, but still represents the urban center of the metro area. **Core County and City are consolidated, or city exists as separate entity.
Going down even further, let’s compare the core city to the total metro, again ranked by %.
*Again, I used the 5 boroughs of New York here, so the numbers don’t change. **See above.
Finally, because core counties and cities can be absolutely huge, like in Phoenix, I wanted to take see the ratio of people moving vs. the area size. To do this, I divided the growth by the land area of each core county and city.
So basically, how many people moved there per each square mile.
So what’s all this mean? Columbus performs particularly well here. Franklin County attracts a high percentage of the total metro population, and Columbus itself is one of only 5 cities with more than 50% of the metro growth entering the city limits. Even accounting for area size, Columbus does fairly well. This suggests that urban growth there is stronger than in most cities.
Today, I am going to examine 2017 metro population estimates from the US Census, not only for Ohio, but also Columbus’ peer group that includes Midwest and national metro areas. Midwest peers (outside Ohio) used would be any metro with a population greater than 500,000. National peers would be metros that either started or ended the period 2010-2017 with a population between 1.5-2.5 Million.
As with counties, I am going to start this look with a comparison of overall population.
Total Metro Area Population Census 2010, July 1, 2016 and July 1, 2017 Census 2010——————————-July 1, 2016————————July 1, 2017 1. Chicago, IL: 9,461,104————-1. Chicago: 9,546,326———–1. Chicago: 9,533,040 2. Detroit, MI: 4,296,250—————2. Detroit: 4,305,869————-2. Detroit: 9,313,002 3. Minneapolis, MN: 3,348,8459—3. Minneapolis: 3,557,276–3. Minneapolis: 3,600,618 4. St. Louis, MO: 2,787,701———4. St. Louis: 2,806,782———4. St. Louis: 2,807,338 5. Pittsburgh, PA: 2,356,285——–5. Charlotte: 2,475,519———5. Charlotte: 2,525,305 6. Portland, OR: 2,226,009———-6. Orlando: 2,453,333———-6. Orlando: 2,509,831 7. Charlotte: 2,217,012———–7. San Antonio: 2,426,211—–7. San Antonio: 2,473,974 8. Sacramento, CA: 2,149,127—–8. Portland: 2,423,102——–8. Portland: 2,453,168 9. San Antonio, TX: 2,142,516—–9. Pittsburgh: 2,341,536——9. Pittsburgh: 2,333,367 10. Orlando, FL: 2,134,411—–10. Sacramento: 2,295,233—10. Sacramento: 2,324,884 11. Cincinnati: 2,114,580———-11. Cincinnati: 2,166,029—–11. Las Vegas: 2,204,079 12. Cleveland: 2,077,240————12. Las Vegas: 2,156,724—-12. Cincinnati: 2,179,082 13. Kansas City, MO: 2,009,342-13. Kansas City: 2,106,382-13. Kansas City: 2,128,912 14. Las Vegas, NV: 1,951,269——–14. Austin: 2,060,558——–14. Austin: 2,115,827 15. Columbus: 1,901,974———-15. Cleveland: 2,060,065——15. Columbus: 2,078,725 16. Indianapolis, IN: 1,887,877——16. Columbus: 2,046,977—16. Cleveland: 2,058,844 17. San Jose, CA: 1,836,911—17. Indianapolis: 2,005,612—17. Indianapolis: 2,028,614 18. Austin, TX: 1,716,289————18. San Jose: 1,990,910—-18. San Jose: 1,998,463 19. Virginia Beach, VA: 1,676,822—19. Nashville: 1,868,855—-19. Nashville: 1,903,045 20. Nashville: 1,670,890—20. Virginia Beach: 1,722,766–20. Virginia Beach: 1,725,246 21. Providence, RI: 1,600,852—-21. Providence: 1,615,878—21. Providence: 1,621,122 22. Milwaukee, WI: 1,555,908—–22. Milwaukee: 1,576,143—22. Milwaukee: 1,576,236 23. Jacksonville, FL: 1,345,596-23. Jacksonville: 1,476,503–23. Jacksonville: 1,504,980 24. Grand Rapids: 988,938–24. Grand Rapids: 1,048,826-24. Grand Rapids: 1,059,113 25. Omaha, NE: 865,350————–25. Omaha: 924,003—-25. Omaha: 933,316 26. Dayton: 799,232——————–26. Dayton: 800,886—–26. Dayton: 803,416 27. Akron: 703,200———————27. Akron: 702,556——–27. Akron: 703,505 28. Wichita, KS: 630,919————-28. Madison: 647,432—28. Madison: 654,230 29. Toledo: 610,001——————29. Wichita: 644,680——29. Des Moines: 645,911 30. Madison, WI: 605,435———–30. Des Moines: 634,740—-30. Wichita: 645,628 31. Des Moines, IA: 569,633——-31. Toledo: 604,591——31. Toledo: 603,668 32. Youngstown: 565,773——32. Youngstown: 544,543—32. Youngstown: 541,926 33. Canton: 404,422——————33. Canton: 401,165—-33. Canton: 399,927
Columbus passed up Cleveland to become Ohio’s 2nd largest metro.
Metro Area Total Growth Census 2010-July 1, 2017 and July 1, 2016-July 1, 2017 Census 2010-July 1, 2017—————————–July 1, 2016-July 1, 2017 1. Austin, TX: +399,507———————————–1. Orlando: +56,498 2. Orlando, FL: +375,432———————————2. Austin: +55,269 3. San Antonio, TX: +331,458—————————3. Charlotte: +49,786 4. Charlotte, NC: +308,313——————————-4. San Antonio: +47,763 5. Las Vegas, NV: +252,810—————————–5. Las Vegas: +47,355 6. Minneapolis, MN: +251,760————————–6. Minneapolis: +43,342 7. Nashville, TN: +232,162——————————-7. Nashville: +34,190 8. Portland, OR: +227,167——————————-8. Columbus: +31,748 9. Columbus: +176,724———————————–9. Portland: +30,066 10. Sacramento, CA: +175,740————————10. Sacramento: +29,651 11. San Jose, CA: +161,523—————————-11. Jacksonville: +28,477 12. Jacksonville, FL: +159,382————————-12. Indianapolis: +23,002 13. Indianapolis, IN: +140,524————————-13. Kansas City: +22,530 14. Kansas City, MO: +119,574————————14. Cincinnati: +13,053 15. Des Moines, IA: +76,278—————————15. Des Moines: +11,171 16. Chicago, IL: +71,499——————————–16. Grand Rapids: +10,287 17. Grand Rapids, MI: +70,173————————17. Omaha: +9,313 18. Omaha, NE: +67,960——————————–18. San Jose: +7,533 19. Cincinnati: +64,396———————————–19. Detroit: +7,133 20. Madison, WI: +48,802——————————-20. Madison: +6,798 21. Virginia Beach, VA: +48,429———————-21. Providence: +5,244 22. Milwaukee, WI: +20,282—————————22. Dayton: +2,530 23. Providence, RI: +19,912————————–23. Virginia Beach: +2,480 24. St. Louis, MO: +19,575—————————24. Akron: +949 25. Detroit, MI: +16,685——————————-25. Wichita: +948 26. Wichita, KS: +14,704——————————26. St. Louis: +556 27. Dayton: +4,165————————————-27. Milwaukee: +93 28. Akron: +302—————————————–28. Toledo: -923 29. Canton: -4,501————————————-29. Cleveland: -1,221 30. Toledo: -6,334————————————-30. Canton: -1,238 31. Cleveland: -18,427——————————-31. Youngstown: -2,617 32. Pittsburgh, PA: -22,924————————-32. Pittsburgh: -8,169 33. Youngstown: -23,873—————————-33. Chicago: -13,286
Now, as done with counties, let’s look at the components of population change for metro areas.
Total Births By Metro Census 2010-July 1, 2017 and July 1, 2016-July 1, 2017 Census 2010-July 1, 2017———————————July 1, 2016-July 1, 2017 1. Chicago: +869,178—————————————-1. Chicago: +115,915 2. Detroit: +364,121———————————————-2. Detroit: +49,940 3. Minneapolis: +331,430————————————–3. Minneapolis: +45,810 4. St. Louis: +246,280——————————————4. San Antonio: +34,318 5. San Antonio: +236,348————————————–5. St. Louis: +33,143 6. Charlotte: +217,525——————————————6. Charlotte: +31,315 7. Portland: +201,872——————————————-7. Orlando: +29,173 8. Orlando: +200,843——————————————-8. Portland: +28,220 9. Kansas City: +200,535————————————–9. Columbus: +27,663 10. Sacramento: +198,466————————————10. Kansas City: +27,565 11. Columbus: +197,185—————————————11. Las Vegas: +27,449 12. Cincinnati: +196,146—————————————12. Austin: +27,400 13. Las Vegas: +194,083————————————–13. Sacramento: +27,148 14. Indianapolis: +193,599————————————14. Cincinnati: +26,855 15. Austin: +188,961——————————————–15. Indianapolis: +26,769 16. San Jose: +176,224—————————————-16. Nashville: +24,690 17. Pittsburgh: +173,472—————————————17. San Jose: +23,826 18. Nashville: +170,824—————————————–18. Pittsburgh: +23,614 19. Cleveland: +168,361—————————————19. Cleveland: +22,873 20. Virginia Beach: +163,787———————————20. Milwaukee: +19,474 21. Milwaukee: +144,429————————————–21. Jacksonville: +18,748 22. Jacksonville: +130,339————————————22. Providence: +16,542 23. Providence: +120,526————————————-23. Grand Rapids: +13,548 24. Grand Rapids: +98,214———————————–24. Omaha: +13,421 25. Omaha: +96,558——————————————-25. Dayton: +9,615 26. Dayton: +69,855——————————————-26. Des Moines: +9,172 27. Wichita: +65,873——————————————27. Wichita: +8,694 28. Des Moines: +63,958————————————28. Madison: +7,400 29. Akron: +54,644——————————————–29. Toledo: +7,345 30. Toledo: +54,309——————————————-30. Akron: +7,342 31. Madison: +53,718—————————————-31. Virginia Beach: +5,935 32. Youngstown: +40,696———————————–32. Youngstown: +5,551 33. Canton: +32,199——————————————33. Canton: +4,434
Total Deaths By Metro Census 2010-July 1, 2017 and July 1, 2016-July 1, 2017 Census 2010-July 1, 2017———————————July 1, 2016-July 1, 2017 1. Chicago: -501,469—————————————1. Chicago: -72,491 2. Detroit: -293,091—————————————–2. Detroit: -41,075 3. Pittsburgh: -197,572————————————3. Pittsburgh: -27,439 4. St. Louis: -186,111————————————–4. St. Louis: -26,755 5. Minneapolis: -161,913———————————5. Minneapolis: -23,527 6. Cleveland: -153,138———————————–6. Cleveland: -21,068 7. Cincinnati: -135,975———————————–7. Cincinnati: -19,515 8. Charlotte: -127,523————————————-8. Charlotte: -19,009 9. Portland: -120,590————————————–9. Orlando: -18,268 10. Sacramento: -120,429——————————10. Sacramento: -18,081 11. Kansas City: -119,748——————————11. Portland: -17,875 12. Orlando: -117,771———————————–12. San Antonio: -17,679 13. San Antonio: -117,289——————————13. Kansas City: -17,106 14. Indianapolis: -113,742——————————14. Las Vegas: -16,867 15. Columbus: -108,704——————————–15. Indianapolis: -16,081 16. Las Vegas: -108,003——————————–16. Columbus: -15,833 17. Providence: -107,920——————————-17. Providence: -15,031 18. Nashville: -99,415———————————–18. Nashville: -14,723 19. Virginia Beach: -97,935—————————-19. Milwaukee: -13,399 20. Milwaukee: -95,601———————————20. Jacksonville: -13,288 21. Jacksonville: -86,920——————————-21. San Jose: -11,360 22. San Jose: -73,507———————————–22. Austin: -10,609 23. Austin: -67,704—————————————23. Dayton: -8,359 24. Dayton: -59,736————————————-24. Grand Rapids: -7,674 25. Grand Rapids: -53,725—————————-25. Akron: -7,138 26. Akron: -50,948—————————————26. Youngstown: -6,821 27. Youngstown: -50,302——————————27. Omaha: -6,667 28. Omaha: -47,763————————————-28. Toledo: -5,968 29. Toledo: -42,313————————————-29. Wichita: -5,686 30. Wichita: -40,647————————————30. Des Moines: -4,631 31. Canton: -31,722————————————31. Canton: -4,366 32. Des Moines: -31,563——————————32. Madison: -4,252 33. Madison: -30,385———————————-33. Virginia Beach: -3,280
Total Net Natural Change (Births vs. Deaths) By Metro Census 2010-July 1, 2017 and July 1, 2016-July 1, 2017 Census 2010-July 1, 2017———————————July 1, 2016-July 1, 2017 1. Chicago: +367,709—————————————1. Chicago: +43,424 2. Minneapolis: +169,517———————————–2. Minneapolis: +22,283 3. Austin: +121,257——————————————3. Austin: +16,791 4. San Antonio: +119,059———————————-4. San Antonio: +16,639 5. San Jose: +102,717————————————–5. San Jose: +12,466 6. Charlotte: +90,002—————————————-6. Charlotte: +12,306 7. Columbus: +88,481————————————–7. Columbus: +11,830 8. Las Vegas: +86,080————————————-8. Orlando: +10,905 9. Orlando: +83,072—————————————-9. Indianapolis: +10,688 10. Portland: +81,282————————————-10. Las Vegas: +10,582 11. Kansas City: +80,787———————————11. Kansas City: +10,459 12. Indianapolis: +79,857——————————–12. Portland: +10,345 13. Sacramento: +78,037——————————–13. Nashville: +9,967 14. Nashville: +71,409————————————14. Sacramento: +9,067 15. Detroit: +71,030—————————————15. Detroit: +8,865 16. Virginia Beach: +65,852—————————–16. Virginia Beach: +7,762 17. Cincinnati: +60,171———————————–17. Cincinnati: +7,340 18. St. Louis: +60,169————————————-18. Omaha: +6,754 19. Milwaukee: +48,828———————————-19. St. Louis: +6,388 20. Omaha: +48,795————————————–20. Grand Rapids: +5,874 21. Grand Rapids: +44,489—————————–21. Jacksonville: +5,460 22. Jacksonville: +43,419——————————-22. Des Moines: +4,541 23. Des Moines: +32,395——————————-23. Madison: +3,148 24. Wichita: +25,226————————————-24. Milwaukee: +6,075 25. Madison: +23,333———————————–25. Wichita: +3,008 26. Cleveland: +15,223——————————–26. Cleveland: +1,805 27. Providence: +12,606——————————27. Providence: +1,511 28. Toledo: +11,996———————————–28. Toledo: +1,377 29. Dayton: +10,119———————————-29. Dayton: +1,256 30. Akron: +3,696————————————–30. Akron: +204 31. Canton: +477—————————————31. Canton: +68 32. Youngstown: -9,606——————————-32. Youngstown: -1,270 33. Pittsburgh: -24,100——————————–33. Pittsburgh: -3,825
Total Domestic Migration By Metro Census 2010-July 1, 2017 and July 1, 2016-July 1, 2017 Census 2010-July 1, 2017———————————July 1, 2016-July 1, 2017 1. Austin: +224,351—————————————–1. Charlotte: +31,102 2. Charlotte: +177,484————————————-2. Austin: +30,120 3. San Antonio: +169,684——————————–3. Las Vegas: +29,414 4. Orlando: +155,498————————————–4. San Antonio: +24,891 5. Nashville: +126,142————————————-5. Orlando: +23,321 6. Las Vegas: +119,742———————————-6. Jacksonville: +18,921 7. Portland: +106,839————————————-7. Nashville: +18,708 8. Jacksonville: +87,040———————————8. Portland: +13,384 9. Sacramento: +49,262———————————9. Sacramento: +12,888 10. Columbus: +42,932———————————10. Columbus: +12,562 11. Des Moines: +32,042——————————-11. Kansas City: +8,531 12. Indianapolis: +30,772——————————-12. Minneapolis: +8,095 13. Kansas City: +16,802——————————-13. Indianapolis: +7,763 14. Madison: +13,224————————————14. Des Moines: +4,812 15. Grand Rapids: +12,355—————————-15. Grand Rapids: +2,217 16. Omaha: +5,265—————————————16. Madison: +1,706 17. Minneapolis: +432———————————–17. Cincinnati: +1,541 18. Canton: -5,797—————————————-18. Omaha: +383 19. Akron: -13,427—————————————-19. Dayton: -346 20. Youngstown: -16,228——————————-20. Akron: -877 21. Dayton: -16,864————————————–21. Canton: -1,469 22. Wichita: -18,452————————————–22. Youngstown: -1,711 23. Cincinnati: -21,259———————————-23. Providence: -2,588 24. Toledo: -23,102————————————–24. Toledo: -3,070 25. Pittsburgh: -24,397———————————25. Wichita: -3,235 26. Providence: -33,335——————————-26. Virginia Beach: -4,706 27. Milwaukee: -50,575——————————–27. Cleveland: -8,008 28. Virginia Beach: -51,916—————————28. Pittsburgh: -8,633 29. Cleveland: -64,353——————————–29. Milwaukee: -9,635 30. St. Louis: -67,560———————————30. St. Louis: -8,828 31. San Jose: -73,026——————————–31. Detroit: -14,863 32. Detroit: -141,006———————————-32. San Jose: -25,729 33. Chicago: -479,482——————————–33. Chicago: -85,177
Total International Migration By Metro Census 2010-July 1, 2017 and July 1, 2016-July 1, 2017 Census 2010-July 1, 2017———————————July 1, 2016-July 1, 2017 1. Chicago: +183,162—————————————1. Chicago: +28,302 2. Orlando: +135,860—————————————2. Orlando: +22,207 3. San Jose: +132,938————————————-3. San Jose: +20,747 4. Detroit: +86,366——————————————4. Detroit: +13,214 5. Minneapolis: +83,552———————————-5. Minneapolis: +13,107 6. Sacramento: +49,560———————————-6. Austin: +8,185 7. Austin: +49,311——————————————7. Sacramento: +7,722 8. Las Vegas: +46,411————————————8. Columbus: +7,350 9. Columbus: +45,744————————————9. Las Vegas: +7,221 10. Providence: +41,325——————————–10. Providence: +6,381 11. San Antonio: +40,953——————————-11. Portland: +6,335 12. Charlotte: +39,380———————————–12. Charlotte: +6,279 13. Portland: +38,542————————————13. San Antonio: +6,173 14. Virginia Beach: +34,619—————————-14. Nashville: +5,510 15. Nashville: +33,169———————————–15. Cleveland: +5,045 16. Cleveland: +31,236———————————-16. Indianapolis: +4,603 17. Indianapolis: +30,329——————————-17. Pittsburgh: +4,359 18. Jacksonville: +28,593——————————-18. Cincinnati: +4,285 19. St. Louis: +27,666————————————19. Jacksonville: +4,043 20. Pittsburgh: +27,300———————————20. St. Louis: +4,032 21. Cincinnati: +26,502———————————21. Milwaukee: +3,689 22. Kansas City: +23,098——————————22. Kansas City: +3,572 23. Milwaukee: +22,616——————————–23. Grand Rapids: +2,233 24. Omaha: +14,383————————————24. Omaha: +2,213 25. Grand Rapids: +13,800—————————25. Madison: +1,949 26. Madison: +12,367———————————-26. Des Moines: +1,807 27. Des Moines: +11,592—————————–27. Dayton: +1,654 28. Dayton: +11,230———————————–28. Akron: +1,647 29. Akron: +10,413————————————-29. Wichita: +1,187 30. Wichita: +8,117————————————-30. Virginia Beach: +1,077 31. Toledo: +4,627————————————-31. Toledo: +769 32. Youngstown: +2,171——————————32. Youngstown: +381 33. Canton: +1,118————————————33. Canton: +174
Total Net Migration By Metro Census 2010-July 1, 2017 and July 1, 2016-July 1, 2017 Census 2010-July 1, 2017———————————July 1, 2016-July 1, 2017 1. Orlando: +291,358————————————–1. Orlando: +45,528 2. Austin: +273,662—————————————-2. Austin: +38,305 3. Charlotte: +216,864————————————3. Charlotte: +37,381 4. San Antonio: +210,637——————————–4. Las Vegas: +36,635 5. Las Vegas: +166,153———————————-5. San Antonio: +31,064 6. Nashville: +159,311————————————6. Nashville: +24,218 7. Portland: +145,381————————————7. Jacksonville: +22,964 8. Jacksonville: +115,633——————————-8. Minneapolis: +21,202 9. Sacramento: +98,822——————————–9. Sacramento: +20,610 10. Columbus: +88,676——————————–10. Columbus: +19,912 11. Minneapolis: +83,984——————————11. Portland: +19,719 12. Indianapolis: +61,101——————————12. Indianapolis: +12,366 13. San Jose: +59,912———————————-13. Kansas City: +12,103 14. Des Moines: +43,634——————————14. Des Moines: +6,619 15. Kansas City: +39,900——————————15. Cincinnati: +5,826 16. Grand Rapids: +26,155—————————16. Grand Rapids: +4,450 17. Madison: +25,591———————————-17. Providence: +3,793 18. Omaha: +19,648————————————18. Madison: +3,655 19. Providence: +7,990———————————19. Omaha: +2,596 20. Cincinnati: +5,243———————————-20. Dayton: +1,308 21. Pittsburgh: +2,903———————————-21. Akron: +770 22. Akron: -3,014—————————————-22. Canton: -1,295 23. Canton: -4,679————————————–23. Youngstown: -1,330 24. Dayton: -5,634————————————–24. Detroit: -1,649 25. Wichita: -10,335————————————25. Wichita: -2,048 26. Youngstown: -14,057—————————–26. Toledo: -2,301 27. Virginia Beach: -17,297————————–27. Cleveland: -2,963 28. Toledo: -18,475————————————28. Virginia Beach: -3,629 29. Milwaukee: -27,959——————————29. Pittsburgh: -4,274 30. Cleveland: -33,117——————————-30. San Jose: -4,982 31. St. Louis: -39,894———————————31. St. Louis: -5,796 32. Detroit: -54,640————————————32. Milwaukee: -5,946 33. Chicago: -296,320——————————-33. Chicago: -56,875