Columbus City Diversity and Peer Comparison


In the 2nd post related to the recently-released Census demographic data, I’ll look at Columbus city diversity and peer comparison for how it’s been changing since 2005.

Rank by City of Total White, non-Hispanic Population by Year
2005————————————–2010————————————-2017
1. Chicago, IL: 819,215————1. Chicago: 853,910————1. Chicago: 879,334
2. Indianapolis, IN: 491,044—2. Indianapolis: 482,195—–2. Columbus: 490,149
3. Columbus: 442,958———-3. Columbus: 470,971—-3. Indianapolis: 468,665
4. Portland, OR: 382,033———-4. Portland: 417,876————4. Austin: 453,801
5. San Antonio, TX: 356,420—–5. Austin: 384,065————5. Portland: 452,132
6. Austin, TX: 347,013——-6. San Antonio: 351,420—6. San Antonio: 375,463
7. Nashville, TN: 314,518——–7. Nashville: 339,030——–7. Nashville: 368,195
8. Charlotte, NC: 302,789——-8. Charlotte: 331,357——8. Charlotte: 360,270
9. Virginia Beach, VA: 290,891–9. Virginia Beach: 282,812——9. Omaha: 311,349
10. San Jose, CA: 281,822—–10. Las Vegas: 280,604———–10. Las Vegas: 280,201
11. Las Vegas, NV: 281,679—-11. Omaha: 277,606———–11. Virginia Beach: 277,338
12. Omaha, NE: 267,685——–12. San Jose: 265,311————12. Kansas City: 272,548
13. Kansas City, MO: 249,123—13. Kansas City: 247,473——13. San Jose: 267,315
14. Wichita, KS: 245,527———-14. Wichita: 245,146————14. Minneapolis: 252,304
15. Milwaukee, WI: 219,891——15. Minneapolis: 242,848——15. Wichita: 243,143
16. Minneapolis, MN: 216,975—16. Milwaukee: 221,514——–16. Lincoln: 226,297
17. Lincoln, NE: 197,287———-17. Lincoln: 216,076————-17. Milwaukee: 207,043
18. Toledo: 183,746—————-18. Pittsburgh: 203,622———18. Pittsburgh: 196,687
19. Pittsburgh, PA: 180,725——19. Fort Wayne: 179,646——-19. Madison: 187,566
20. Madison, WI: 161,631——–20. Madison: 178,307————20. Fort Wayne: 166,912
21. St. Paul, MN: 161,329——–21. Toledo: 177,341————–21. Toledo: 164,104
22. Sacramento, CA: 160,599—22. Sacramento: 165,610——22. Sacramento: 159,291
23. Fort Wayne, IN: 157,672—–23. St. Paul: 159,704———–23. St. Paul: 152,558
24. Des Moines, IA: 149,786—–24. Des Moines: 145,937——24. Cincinnati: 143,028
25. Cleveland: 147,359———–25. Cincinnati: 143,120———25. Des Moines: 137,235
26. St. Louis, MO: 143,590——26. Cleveland: 137,977———26. St. Louis: 134,471
27. Cincinnati: 138,486———–27. St. Louis: 134,146———–27. Cleveland: 126,714
28. Akron: 128,976—————-28. Akron: 120,800————–28. Grand Rapids: 114,349
29. Grand Rapids, MI: 113,791—29. Grand Rapids: 104,636—29. Akron: 113,951
30. Orlando, FL: 92,326———–30. Orlando: 96,867————-30. Orlando: 95,876
31. Detroit, MI: 77,163————-31. Dayton: 72,663————–31. Dayton: 71,094
32. Dayton: 67,581—————–32. Providence: 64,284——–32. Detroit: 70,931
33. Providence, RI: 64,223——-33. Detroit: 55,298————–33. Providence: 59,321

Columbus moved from 3rd to 2nd over the period.

Rank by City of Total Black, non-Hispanic Population by Year
2005—————————————–2010———————————2017

1. Chicago: 938,097—————–1. Chicago: 895,294———–1. Chicago: 797,253
2. Detroit: 683,999——————–2. Detroit: 587,707————-2. Detroit: 529,593
3. Milwaukee: 222,040————–3. Charlotte: 251,274———-3. Charlotte: 292,104
4. Cleveland: 221,797—————4. Milwaukee: 230,473——–4. Columbus: 248,476
5. Charlotte: 205,216—————-5. Indianapolis: 226,314——-5. Indianapolis: 236,606
6. Indianapolis: 193,948————6. Columbus: 216,486———6. Milwaukee: 228,720
7. Columbus: 179,197—————7. Cleveland: 208,528———7. Cleveland: 186,073
8. St. Louis: 168,768—————-8. Nashville: 171,104———–8. Nashville: 180,830
9. Nashville: 148,051—————-9. St. Louis: 157,382———–9. St. Louis: 143,761
10. Kansas City: 131,694———-10. Kansas City: 138,461—–10. Kansas City: 138,346
11. Cincinnati: 131,010————-11. Cincinnati: 131,909——–11. Cincinnati: 127,589
12. Pittsburgh: 81,758————–12. Virginia Beach: 79,583—-12. San Antonio: 97,925
13. Virginia Beach: 80,004——–13. San Antonio: 79,307——13. Virginia Beach: 82,181
14. Orlando: 73,736—————–14. Toledo: 75,033————-14. Minneapolis: 75,006
15. Toledo: 72,190——————-15. Pittsburgh: 71,539——–15. Toledo: 74,906
16. Sacramento: 71,452————16. Orlando: 70,988————16. Orlando: 72,796
17. San Antonio: 70,723————17. Minneapolis: 63,749——17. Austin: 69,860
18. Dayton: 60,196——————-18. Sacramento: 61,976——18. Sacramento: 67,305
19. Akron: 59,810——————–19. Austin: 61,833————–19. Las Vegas: 65,663
20. Las Vegas: 59,780————–20. Dayton: 61,402————-20. Pittsburgh: 65,268
21. Austin: 59,583——————-21. Akron: 60,653—————-21. Akron: 61,461
22. Minneapolis: 57,499————22. Las Vegas: 60,187———22. Dayton: 57,043
23. Omaha: 50,333——————23. Omaha: 55,086————-23. Omaha: 56,098
24. Grand Rapids: 40,408———24. Wichita: 42,662————-24. St. Paul: 51,737
25. Wichita: 39,165—————–25. Grand Rapids: 41,848—–25. Wichita: 40,756
26. Fort Wayne: 35,221———–26. St. Paul: 41,923————-26. Grand Rapids: 38,130
27. St. Paul: 34,903—————-27. Fort Wayne: 39,016——–27. Fort Wayne: 37,941
28. Portland: 30,828—————28. Portland: 37,355————28. Portland: 34,624
29. San Jose: 27,446————–29. San Jose: 29,831———-29. San Jose: 28,126
30. Providence: 18,794———–30. Des Moines: 19,962——-30. Providence: 27,274
31. Des Moines: 16,709———-31. Providence: 19,265——–31. Des Moines: 22,170
32. Madison: 12,660————–32. Madison: 17,560————32. Madison: 14,185
33. Lincoln: 7,082——————33. Lincoln: 9,023—————33. Lincoln: 11,487

Columbus moved up from 7th to 4th in total Black, non-Hispanic during the period. Surprisingly, quite a few cities have actually been losing this demographic since 2010 at least.

Rank by City of Total Asian, non-Hispanic Population by Year
2005————————————-2010——————————————2017

1. San Jose: 269,186————–1. San Jose: 303,227—————–1. San Jose: 366,134
2. Chicago: 127,686—————-2. Chicago: 148,280——————2. Chicago: 179,176
3. Sacramento: 80,307————3. Sacramento: 84,556————-3. Sacramento: 93,476
4. Portland: 36,278—————–4. Austin: 46,575———————-4. Austin: 71,539
5. Austin: 35,239——————–5. Portland: 43,185——————-5. St. Paul: 61,082
6. St. Paul: 35,184——————6. St. Paul: 41,989——————-6. Charlotte: 55,142
7. Columbus: 27,125—————7. Las Vegas: 37,406—————7. Columbus: 53,027
8. Las Vegas: 25,077————–8. Charlotte: 37,181—————–8. Portland: 52,219
9. Charlotte: 23,356—————-9. Columbus: 35,468—————-9. Las Vegas: 44,735
10. Virginia Beach: 22,501——10. San Antonio: 29,200———–10. San Antonio: 38,119
11. San Antonio: 20,492———11. Virginia Beach: 27,303—–11. Virginia Beach: 29,735
12. Minneapolis: 20,189———12. Milwaukee: 22,670————–12. Minneapolis: 26,833
13. Milwaukee: 19,596———–13. Minneapolis: 21,426————13. Indianapolis: 26,548
14. Nashville: 16,943————-14. Wichita: 19,420——————14. Milwaukee: 25,624
15. Wichita: 15,417—————15. Indianapolis: 17,137————15. Madison: 24,455
16. Madison: 12,708————–16. Nashville: 17,045—————16. Nashville: 24,034
17. Indianapolis: 12,312———17. Madison: 16,671—————-17. Wichita: 19,548
18. Providence: 10,751———-18. Pittsburgh: 12,036————–18. Pittsburgh: 19,357
19. Pittsburgh: 10,727————19. Providence: 11,497————19. Omaha: 17,412
20. Kansas City: 10,674———20. Lincoln: 10,452——————20. Des Moines: 17,143
21. Detroit: 9,577——————21. Kansas City: 10,263———–21. Kansas City: 15,213
22. Des Moines: 8,796———–22. Des Moines: 8,867————-22. Fort Wayne: 14,039
23. Lincoln: 7,513—————–23. St. Louis: 8,717—————–23. Lincoln: 13,992
24. St. Louis: 7,046—————24. Omaha: 8,397——————-24. Orlando: 11,852
25. Omaha: 6,971—————–25. Orlando: 7,870——————25. Detroit: 11,790
26. Cincinnati: 6,874————-26. Fort Wayne: 6,945————–26. St. Louis: 10,404
27. Cleveland: 6,289————27. Detroit: 6,549———————27. Providence: 9,361
28. Orlando: 5,528—————28. Cincinnati: 5,938—————-28. Cleveland: 9,217
29. Fort Wayne: 4,241———-29. Cleveland: 5,392—————-29. Akron: 8,007
30. Toledo: 4,150—————-30. Akron: 4,567———————30. Cincinnati: 7,906
31. Akron: 3,497—————–31. Grand Rapids: 3,695———–31. Grand Rapids: 7,056
32. Grand Rapids: 2,847——32. Toledo: 3,125——————–32. Toledo: 3,679
33. Dayton: 1,827—————33. Dayton: 1,231——————–33. Dayton: 848

Columbus maintained its rank since 2005.

Rank by City of Total Hispanic Population by Year
2005——————————————–2010————————————2017

1. Chicago: 778,234—————1. San Antonio: 853,654———-1. San Antonio: 969,065
2. San Antonio: 735,458———–2. Chicago: 763,968—————2. Chicago: 787,978
3. San Jose: 279,420————–3. San Jose: 318,389————–3. San Jose: 332,603
4. Austin: 223,361——————4. Austin: 288,130——————4. Austin: 324,973
5. Las Vegas: 153,813————5. Las Vegas: 181,923————-5. Las Vegas: 219,220
6. Sacramento: 111,559———6. Sacramento: 124,461———–6. Sacramento: 141,752
7. Milwaukee: 80,945————-7. Milwaukee: 104,619————-7. Milwaukee: 133,812
8. Providence: 60,008————-8. Charlotte: 96,246—————-8. Charlotte: 122,904
9. Charlotte: 58,466—————9. Indianapolis: 78,467————-9. Indianapolis: 93,042
10. Wichita: 49,928—————10. Providence: 76,645————10. Orlando: 86,305
11. Indianapolis: 47,764———11. Nashville: 61,212—————11. Providence: 77,893
12. Detroit: 46,993—————-12. Wichita: 59,823——————12. Nashville: 69,574
13. Orlando: 43,978————–13. Portland: 58,986—————–13. Wichita: 68,389
14. Portland: 43,324————–14. Orlando: 56,061—————–14. Portland: 67,551
15. Omaha: 39,674—————15. Omaha: 53,661——————15. Omaha: 66,056
16. Nashville: 37,463————-16. Kansas City: 49,800————16. Columbus: 55,782
17. Minneapolis: 37,017———17. Detroit: 45,580——————-17. Detroit: 48,328
18. Kansas City: 35,995———18. Columbus: 43,276————–18. Cleveland: 47,962
19. Grand Rapids: 32,368——19. Cleveland: 36,067————–19. Minneapolis: 46,375
20. Cleveland: 32,085———–20. Minneapolis: 34,504———–20. Kansas City: 45,975
21. Columbus: 24,607———–21. Grand Rapids: 30,659——21. Virginia Beach: 36,723
22. St. Paul: 22,402————–22. Virginia Beach: 29,206—–22. Grand Rapids: 32,016
23. Virginia Beach: 20,803—–23. St. Paul: 28,725————–23. Des Moines: 31,333
24. Des Moines: 18,952——–24. Des Moines: 23,832———-24. St. Paul: 30,007
25. Toledo: 18,404————–25. Toledo: 21,346——————25. Fort Wayne: 24,724
26. Fort Wayne: 16,438——-26. Fort Wayne: 19,576————26. Toledo: 22,796
27. Madison: 11,997———–27. Lincoln: 16,007——————27. Lincoln: 21,921
28. Lincoln: 9,672—————28. Madison: 14,062—————28. Madison: 20,741
29. St. Louis: 8,268————-29. St. Louis: 11,207————–29. St. Louis: 12,447
30. Pittsburgh: 5,018———-30. Cincinnati: 8,710—————30. Cincinnati: 11,787
31. Cincinnati: 3,855———–31. Pittsburgh: 7,282————–31. Pittsburgh: 9,212
32. Akron: 3,485—————-32. Akron: 3,990——————–32. Dayton: 5,765
33. Dayton: 1,693————–33. Dayton: 3,180——————-33. Akron: 5,536

Columbus moved up from 21st to 16th in the total Hispanic population.

Rank by City of Total Other, non-Hispanic Population by Year
2005——————————————-2010—————————————–2017

1. Chicago: 38,694—————1. Chicago: 37,379——————–1. Chicago: 58,721
2. San Jose: 29,456————2. San Jose: 32,439——————–2. Portland: 41,595
3. Sacramento: 21,370———-3. Sacramento: 30,900—————3. San Jose: 41,175
4. Portland: 21,164————–4. Portland: 28,027———————4. Sacramento: 40,066
5. Indianapolis: 20,242———-5. Las Vegas: 24,521—————–5. Columbus: 34,467
6. Columbus: 20,096————-6. Columbus: 23,738—————–6. Indianapolis: 32,525
7. San Antonio: 19,130———-7. San Antonio: 20,778————–7. Las Vegas: 31,889
8. Minneapolis: 18,580———-8. Minneapolis: 20,753————–8. San Antonio: 31,341
9. Detroit: 18,324—————–9. Virginia Beach: 20,268———-9. Austin: 30,541
10. Las Vegas: 18,304———-10. Indianapolis: 20,086———-10. Charlotte: 28,632
11. Virginia Beach: 16,685—-11. Charlotte: 18,360————–11. Virginia Beach: 24,458
12. Milwaukee: 14,476———-12. Detroit: 16,776—————–12. Nashville: 23,334
13. Kansas City: 13,399——–13. Milwaukee: 16,311———–13. Minneapolis: 21,808
14. Austin: 13,261—————-14. Wichita: 16,091—————14. Milwaukee: 20,166
15. Charlotte: 11,771————-15. Omaha: 15,519————–15. Wichita: 18,763
16. Wichita: 11,545—————16. Austin: 14,915—————-16. Kansas City: 16,743
17. Omaha: 8,552—————–17. Kansas City: 14,668——–17. Omaha: 15,988
18. St. Paul: 7,741—————-18. Nashville: 14,227————18. Cleveland: 15,586
19. Toledo: 7,447—————–19. St. Paul: 13,098————–19. Orlando: 13,429
20. Cincinnati: 7,315————-20. Pittsburgh: 11,280———–20. Detroit: 12,461
21. Cleveland: 7,004————-21. Toledo: 10,134—————21. Pittsburgh: 11,890
22. Providence: 6,488———–22. Akron: 9,020——————22. St. Paul: 11,220
23. Pittsburgh: 6,138————23. Fort Wayne: 8,513———–23. Fort Wayne: 11,180
24. St. Louis: 6,058————–24. Cleveland: 8,276————-24. Lincoln: 11,037
25. Fort Wayne: 5,774———-25. St. Louis: 7,704————–25. Toledo: 11,009
26. Orlando: 5,731—————26. Lincoln: 7,483—————-26. Cincinnati: 10,995
27. Nashville: 5,687————-27. Grand Rapids: 7,376——–27. Des Moines: 9,627
28. Madison: 4,708————–28. Orlando: 7,251—————28. Akron: 8,894
29. Lincoln: 4,508—————-29. Cincinnati: 7,230————29. Madison: 8,292
30. Akron: 4,431—————–30. Madison: 7,177————–30. St. Louis: 7,543
31. Grand Rapids: 4,154——31. Providence: 6,471———–31. Grand Rapids: 7,260
32. Des Moines: 2,674———32. Des Moines: 5,598———-32. Providence: 6,539
33. Dayton: 1,382—————33. Dayton: 3,025—————-33. Dayton: 5,629

Finally, Columbus moved up from 6th to 5th in the total of Other, non-Hispanic population. Overall, Columbus ranks fairly well in totals vs. its peers, as one might expect given that it is one of the largest cities in the grouping. However, to truly find out how it compares with these other cities, you have to look at percentages, which tells how much of the city’s population is made up of each group.

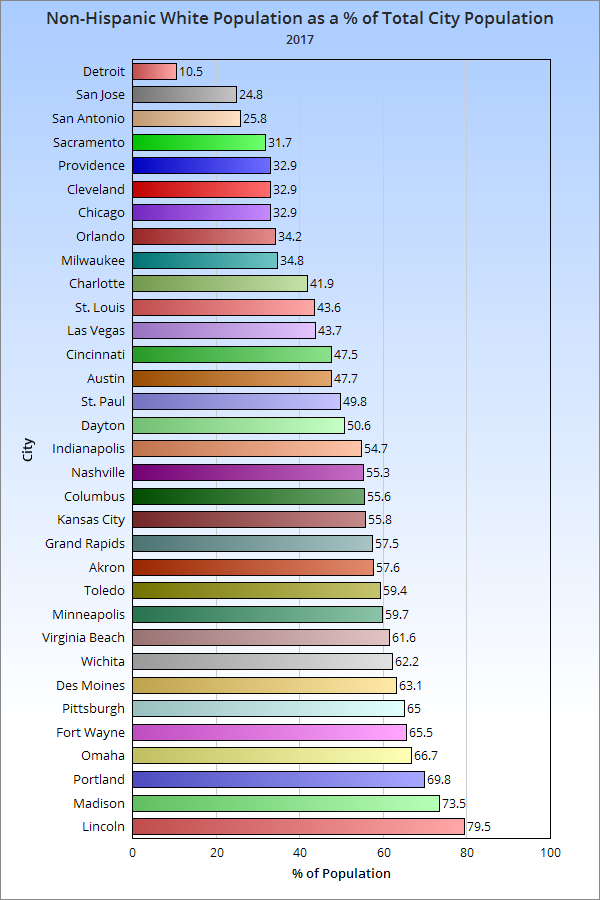
Columbus ranks in the middle of the pack for its % of Non-Hispanic White population. Like in most cities, even while this demographic is growing in total numbers in Columbus, the % of total population continues to fall.

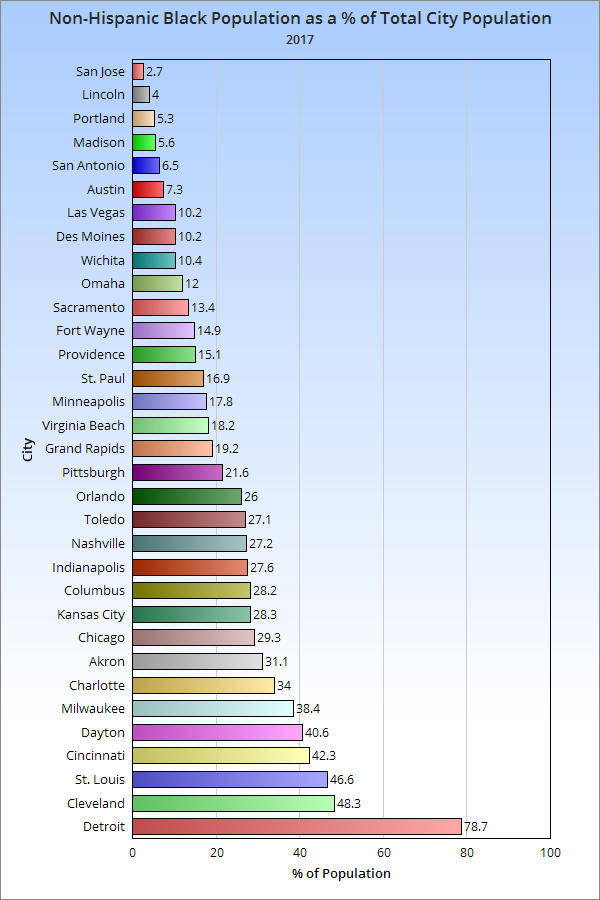
Columbus ranked in the top 3rd of peer cities for its % of Non-Hispanic Black population.

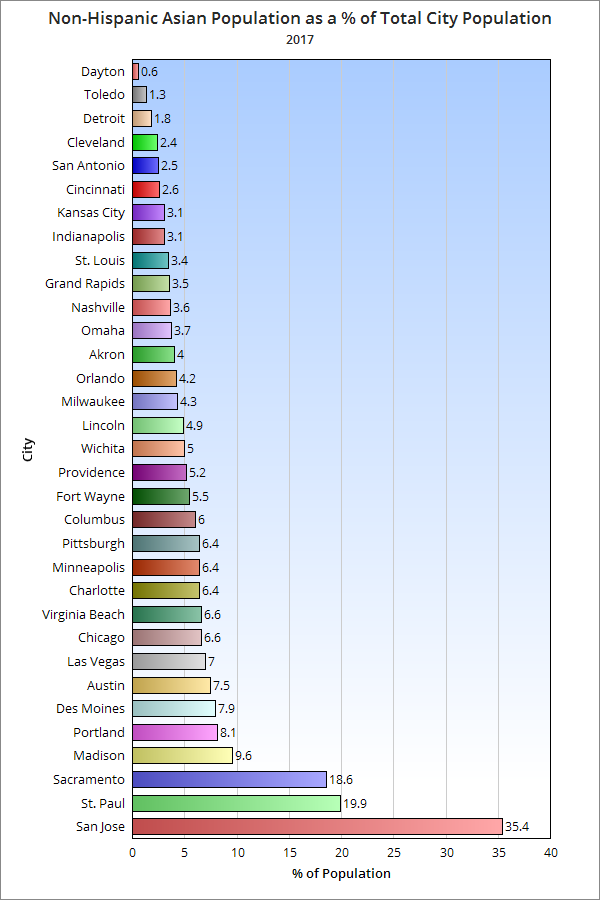
Columbus also ranked in the top 3rd for its Non-Hispanic Asian population.

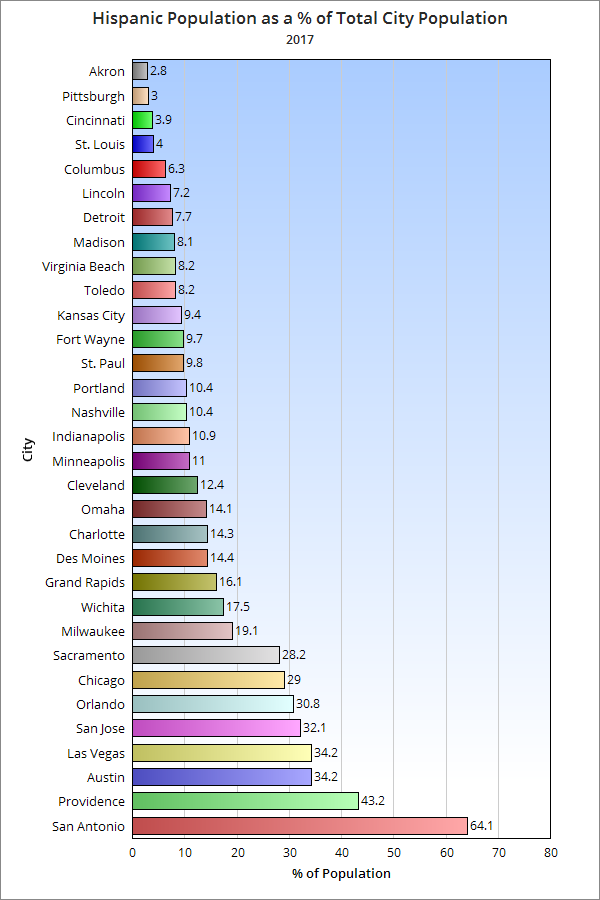
Columbus ranks poorly with Hispanics in the group, ranking near the bottom.

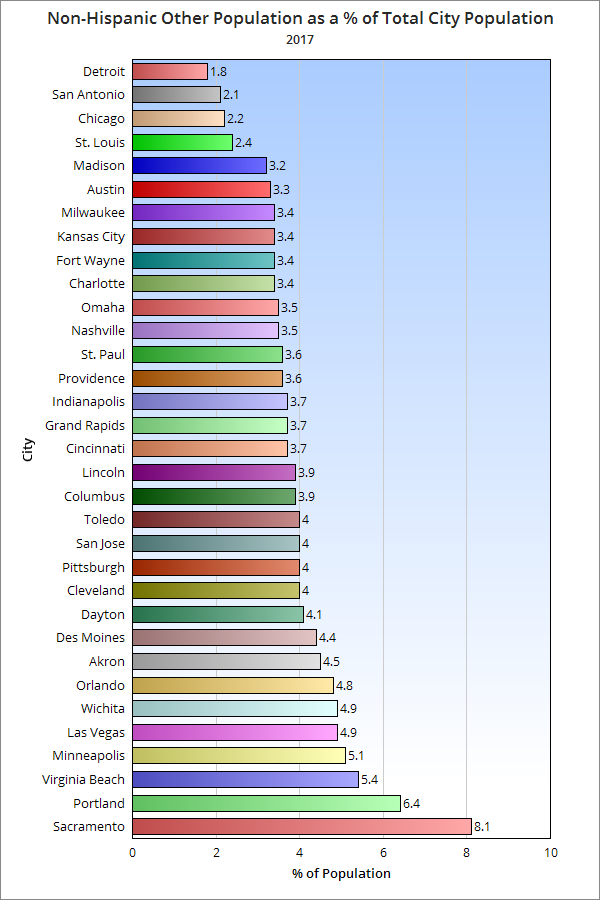
Finally, Columbus ranks in the middle for its Non-Hispanic Other population.

So what’s the final ranking for where Columbus is with diversity compared to its peers in 2017? To find out, I assigned points based on ranked position in each 5 racial categories and took the average of the positions in each 5. The result is that the higher the average number, the lower the overall diversity.

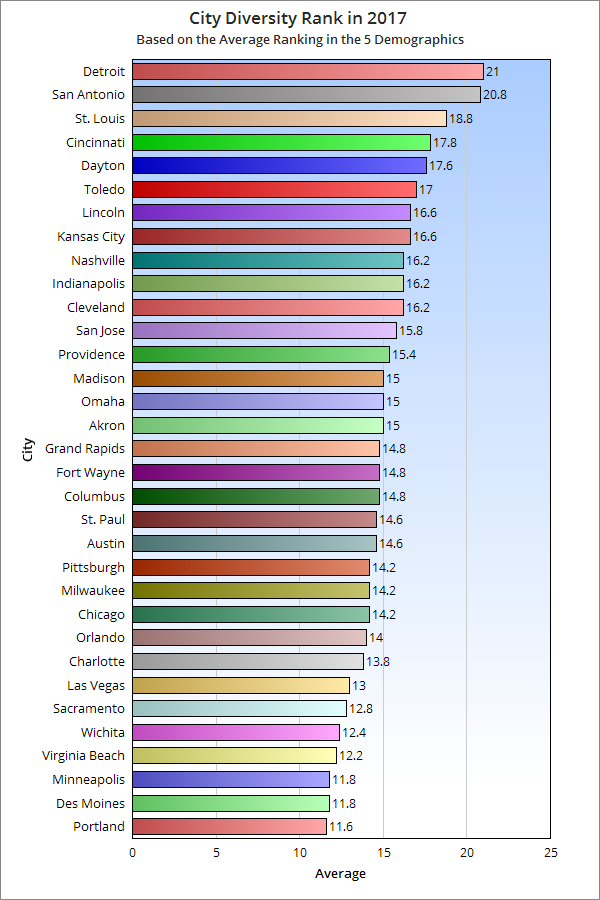
So based on this, Columbus ranks in the top half of national and Midwest peers for diversity.

*Note: Normally, Youngstown would be included, but the data was not available.


Suburban vs. Urban Growth in US Metros


suburban vs urban growth

Now that we have the full set of 2017 population estimates, I wanted to examine a popular claim a little more closely. The claim is that suburban growth far exceeds that of core cities/counties, and it’s often repeated in media throughout the country. One of the things that always bothered me about this was the constant use of basing this claim largely on % change. This has a major flaw, one that I will go into more below.

For this little study on suburban vs urban growth, I will look at the top 50 largest metro areas.

First, let’s look at the total change in the whole metro area, the core county and the core city between the 2010 Census and July 1, 2017. They will be ranked here by total metro change.
1. Dallas, TX: +973,431
2. Houston, TX: +971,941
3. New York, NY: +754,396
4. Atlanta, GA: +597,993
5. Miami, FL: +592,525
6. Washington, DC: +580,228
7. Phoenix, AZ: +544,141
8. Los Angeles, CA: +524,946
9. Seattle, WA: +427,240
10. Austin, TX: +399,507
11. San Francisco, Ca: +391,784
12. Orlando, FL: +375,432
13. Riverside, CA: +355,705
14. Denver, CO: +344,635
15. San Antonio, TX: +331,458
16. Charlotte, NC: +308,313
17. Tampa, FL: +307,930
18. Boston, MA: +283,935
19. Las Vegas, NV: +252,810
20. Minneapolis, MN: +251,760
21. San Diego, CA: +242,343
22. Nashville, TN: +232,162
23. Portland, OR: +227,167
24. Raleigh, NC: +204,590
25. Columbus: +176,724
26. Sacramento, CA: +175,740
27. San Jose, CA: +161,523
28. Jacksonville, FL: +159,382
29. Indianapolis, IN: +140,524
30. Oklahoma City, OK: +130,746
31. Philadelphia, PA: +130,427
32. Kansas City, MO: +119,574
33. Salt Lake City, UT: +115,297
34. Baltimore, MD: +97,572
35. Richmond, VA: +86,117
36. New Orleans, LA: +85,903
37. Chicago: +71,499
38. Cincinnati: +64,396
39. Louisville, KY: +58,247
40. Virginia Beach, VA: +48,429
41. Memphis, TN: +23,433
42. Birmingham, AL: +21,751
43. Milwaukee, WI: +20,282
44. Providence, RI: +19,912
45. St. Louis, MO: +19,575
46. Detroit: +16,685
47. Buffalo, NY: +1,239
48. Hartford, CT: -2,139
49. Cleveland: -18,427
50. Pittsburgh, PA: -22,924

Now that we have the total growth, let’s break it down a bit more.

How much of the total metro change occurred in the core county of each metro? This will be ranked by the highest to lowest % occurring in the core county.

Core County Change—————-Core County % of Total Metro
1. Las Vegas: +252,810———————-100.00%
2. San Diego: +242,343———————-100.00%
3. San Jose: +161,523**———————100.00%
4. Buffalo: +6,488——————————100.00%
5. Salt Lake City: +105,994——————91.93%
6. Phoenix: +489,916————————–90.03%
7. Raleigh: +171,210————————–83.68%
8. San Antonio: +243,805——————–73.56%
9. Columbus: +128,567———————–72.75%
10. Los Angeles: +344,902——————65.70%
11. Sacramento: +111,827——————63.63%
12. Seattle: +257,400————————-60.25%
13. New York: +447,565*——————–59.33%
14. Tampa: +179,340————————-58.24%
15. Houston: +560,521———————–57.67%
16. New Orleans: +49,463——————-57.58%
17. Jacksonville: +88,902——————–55.78%
18. Riverside: +198,100———————-55.69%
19. Providence: +10,870———————54.59%
20. Orlando: +203,019————————54.08%
21. Oklahoma City: +69,325—————-53.02%
22. Louisville: +30,052———————–51.59%
23. Charlotte: +157,209———————50.99%
24. Austin: +202,432————————-50.67%
25. Miami: +255,361————————-43.10%
26. Memphis: +9,317————————39.76%
27. Minneapolis: +99,599——————-39.56%
28. Indianapolis: +46,689——————33.22%
29. Philadelphia: +41,866——————32.10%
30. Portland: +72,221———————–31.79%
31. Denver: +104,463**———————30.31%
32. Nashville: +64,663———————-27.85%
33. Boston: +75,916————————-26.74%
34. Richmond: +22,818**——————26.50%
35. Virginia Beach: +12,441**————25.69%
36. Dallas: +250,009————————25.68%
37. Chicago: +16,588———————–23.20%
38. Milwaukee: +4,350———————21.45%
39. Kansas City: +24,737—————–20.69%
40. Atlanta: +120,843———————-20.21%
41. San Francisco: +79,128**————20.20%
42. Cincinnati: +11,448——————–17.78%
43. Washington, DC: +92,249**———15.90%
44. Birmingham: +731———————-3.36%
45. Hartford: +1,374————————-0.0%
46. Baltimore: -9,313**———————-0.0%
47. St. Louis: -10,668**———————0.0%
48. Detroit: -66,968————————–0.0%
49. Pittsburgh: -300———————– -1.31%
50. Cleveland: -31,608——————- -100.00%

*New York includes all 5 main boroughs, so it is different than core county, but still represents the urban center of the metro area.
**Core County and City are consolidated, or city exists as separate entity.

Going down even further, let’s compare the core city to the total metro, again ranked by %.

Core City Change————————Core City % of Total Metro
1. New York: +447,565————————-59.33%
2. New Orleans: +49,463———————–57.58%
3. San Antonio: +184,539———————-55.67%
4. San Jose: +89,375—————————55.33%
5. Columbus: +92,137————————–52.14%
6. Oklahoma City: +63,649——————–48.68%
7. San Diego: +112,114————————46.26%
8. Jacksonville: +70,278———————–44.09%
9. Philadelphia: +54,857———————–42.06%
10. Charlotte: +127,611————————41.39%
11. Louisville: +24,012————————-41.22%
12. Austin: +160,325—————————40.13%
13. Los Angeles: +207,138——————-39.46%
14. Las Vegas: +64,468———————–36.68%
15. Phoenix: +180,446————————-33.16%
16. Raleigh: +65,098—————————31.82%
17. Denver: +104,463————————–30.31%
18. Indianapolis: +42,557———————30.28%
19. Chicago: +20,852————————–29.16%
20. Portland: +64,029————————–28.19%
21. Nashville: +64,562————————-27.81%
22. Seattle: +116,085————————–27.17%
23. Richmond: +22,818**———————26.50%
24. Virginia Beach: +12,441**—————25.69%
25. Kansas City: +29,156———————24.38%
26. Boston: +67,500—————————23.77%
27. Memphis: +5,347————————–22.82%
28. Houston: +212,454————————21.86%
29. San Francisco**: +79,128—————20.20%
30. Sacramento: +35,413———————20.15%
31. Minneapolis: +41,412———————16.45%
32. Tampa: +49,721—————————-16.15%
33. Washington, DC: +92,249**————-15.90%
34. Dallas: +143,259—————————14.72%
35. Salt Lake City: +14,104——————-12.23%
36. Providence: +2,351————————11.81%
37. Orlando: +41,957—————————11.18%
38. Atlanta: +66,287—————————-11.08%
39. Miami: +54,122——————————9.13%
40. Cincinnati: +4,356————————–6.76%
41. Riverside: +23,857————————-6.71%
42. Milwaukee: +518—————————2.55%
43. Birmingham: -1,527———————–0.0%
44. Buffalo: -5,218——————————0.0%
45. Baltimore: -9,313**————————0.0%
46. St. Louis: -10,668**———————–0.0%
47. Detroit: -40,673—————————-0.0%
48. Pittsburgh: -3,297———————– -14.38%
49. Cleveland: -10,889——————— -59.09%
50. Hartford: -1,375————————- -64.28%

*Again, I used the 5 boroughs of New York here, so the numbers don’t change.
**See above.

Finally, because core counties and cities can be absolutely huge, like in Phoenix, I wanted to take see the ratio of people moving vs. the area size. To do this, I divided the growth by the land area of each core county and city.

So basically, how many people moved there per each square mile.

Core County Ratio——————————-Core City Ratio
1. San Francisco: 1,687.52————————-1,687.52
2. Washington, DC: 1,511.04———————-1,511.04
3. New York: 1,475.51——————————-1,475.51
4. Boston: 1,308.90———————————–1,394.05
5. Denver: 681.30————————————–681.30
6. Richmond: 379.67———————————-379.67
7. Houston: 329.14————————————354.33
8. Philadelphia: 312.43——————————-408.83
9. Charlotte: 300.02———————————–428.66
10. New Orleans: 291.95—————————-291.95
11. Dallas: 286.38————————————-420.73
12. Columbus: 241.67——————————-424.26
13. Atlanta: 229.30———————————–497.65
14. Orlando: 224.83———————————-398.75
15. Raleigh: 205.04———————————-455.87
16. Austin: 204.48————————————538.18
17. San Antonio: 196.62—————————-400.36
18. Minneapolis: 179.78—————————–754.32
19. Tampa: 175.82————————————438.38
20. Portland: 167.57———————————-481.42
21. Salt Lake City: 142.85—————————129.28
22. Miami: 134.54————————————-1,503.81
23. Nashville: 128.30———————————128.01
24. San Jose: 125.21———————————503.49
25. Seattle: 121.64————————————1,384.11
26. Indianapolis: 117.81——————————117.72
27. Jacksonville: 116.67——————————94.02
28. Sacramento: 115.88——————————361.65
29. Oklahoma City: 97.78—————————-105.89
30. Los Angeles: 84.99——————————-441.90
31. Louisville: 79.08———————————–63.11
32. San Diego: 57.84———————————344.76
33. Phoenix: 53.25————————————348.59
34. Virginia Beach: 49.96—————————-49.96
35. Kansas City: 40.96——————————-92.57
36. Las Vegas: 32.04———————————474.73
37. Cincinnati: 28.20———————————-55.89
38. Riverside: 27.49———————————–293.70
39. Providence: 26.51——————————–127.08
40. Milwaukee: 18.05———————————5.39
41. Chicago: 17.5————————————–91.72
42. Memphis: 12.21———————————–16.97
43. Buffalo: 6.22————————————– -128.52
44. Harford: 1.87————————————- -79.02
45. Birmingham: 0.66——————————- -10.46
46. Pittsburgh: -0.41——————————— -59.53
47. Cleveland: -69.16——————————- -140.14
48. Detroit: -109.42———————————- -293.14
49. Baltimore: -115.12—————————— -115.12
50. St. Louis: -172.34——————————- -172.34

So what’s all this mean? Columbus performs particularly well here. Franklin County attracts a high percentage of the total metro population, and Columbus itself is one of only 5 cities with more than 50% of the metro growth entering the city limits. Even accounting for area size, Columbus does fairly well. This suggests that urban growth there is stronger than in most cities.


2017 Metro Population Estimates


2017 metro population estimates

Today, I am going to examine 2017 metro population estimates from the US Census, not only for Ohio, but also Columbus’ peer group that includes Midwest and national metro areas. Midwest peers (outside Ohio) used would be any metro with a population greater than 500,000. National peers would be metros that either started or ended the period 2010-2017 with a population between 1.5-2.5 Million.

As with counties, I am going to start this look with a comparison of overall population.

Total Metro Area Population Census 2010, July 1, 2016 and July 1, 2017
Census 2010——————————-July 1, 2016————————July 1, 2017

1. Chicago, IL: 9,461,104————-1. Chicago: 9,546,326———–1. Chicago: 9,533,040
2. Detroit, MI: 4,296,250—————2. Detroit: 4,305,869————-2. Detroit: 9,313,002
3. Minneapolis, MN: 3,348,8459—3. Minneapolis: 3,557,276–3. Minneapolis: 3,600,618
4. St. Louis, MO: 2,787,701———4. St. Louis: 2,806,782———4. St. Louis: 2,807,338
5. Pittsburgh, PA: 2,356,285——–5. Charlotte: 2,475,519———5. Charlotte: 2,525,305
6. Portland, OR: 2,226,009———-6. Orlando: 2,453,333———-6. Orlando: 2,509,831
7. Charlotte: 2,217,012———–7. San Antonio: 2,426,211—–7. San Antonio: 2,473,974
8. Sacramento, CA: 2,149,127—–8. Portland: 2,423,102——–8. Portland: 2,453,168
9. San Antonio, TX: 2,142,516—–9. Pittsburgh: 2,341,536——9. Pittsburgh: 2,333,367
10. Orlando, FL: 2,134,411—–10. Sacramento: 2,295,233—10. Sacramento: 2,324,884
11. Cincinnati: 2,114,580———-11. Cincinnati: 2,166,029—–11. Las Vegas: 2,204,079
12. Cleveland: 2,077,240————12. Las Vegas: 2,156,724—-12. Cincinnati: 2,179,082
13. Kansas City, MO: 2,009,342-13. Kansas City: 2,106,382-13. Kansas City: 2,128,912
14. Las Vegas, NV: 1,951,269——–14. Austin: 2,060,558——–14. Austin: 2,115,827
15. Columbus: 1,901,974———-15. Cleveland: 2,060,065——15. Columbus: 2,078,725
16. Indianapolis, IN: 1,887,877——16. Columbus: 2,046,977—16. Cleveland: 2,058,844
17. San Jose, CA: 1,836,911—17. Indianapolis: 2,005,612—17. Indianapolis: 2,028,614
18. Austin, TX: 1,716,289————18. San Jose: 1,990,910—-18. San Jose: 1,998,463
19. Virginia Beach, VA: 1,676,822—19. Nashville: 1,868,855—-19. Nashville: 1,903,045
20. Nashville: 1,670,890—20. Virginia Beach: 1,722,766–20. Virginia Beach: 1,725,246
21. Providence, RI: 1,600,852—-21. Providence: 1,615,878—21. Providence: 1,621,122
22. Milwaukee, WI: 1,555,908—–22. Milwaukee: 1,576,143—22. Milwaukee: 1,576,236
23. Jacksonville, FL: 1,345,596-23. Jacksonville: 1,476,503–23. Jacksonville: 1,504,980
24. Grand Rapids: 988,938–24. Grand Rapids: 1,048,826-24. Grand Rapids: 1,059,113
25. Omaha, NE: 865,350————–25. Omaha: 924,003—-25. Omaha: 933,316
26. Dayton: 799,232——————–26. Dayton: 800,886—–26. Dayton: 803,416
27. Akron: 703,200———————27. Akron: 702,556——–27. Akron: 703,505
28. Wichita, KS: 630,919————-28. Madison: 647,432—28. Madison: 654,230
29. Toledo: 610,001——————29. Wichita: 644,680——29. Des Moines: 645,911
30. Madison, WI: 605,435———–30. Des Moines: 634,740—-30. Wichita: 645,628
31. Des Moines, IA: 569,633——-31. Toledo: 604,591——31. Toledo: 603,668
32. Youngstown: 565,773——32. Youngstown: 544,543—32. Youngstown: 541,926
33. Canton: 404,422——————33. Canton: 401,165—-33. Canton: 399,927

Columbus passed up Cleveland to become Ohio’s 2nd largest metro.

Metro Area Total Growth Census 2010-July 1, 2017 and July 1, 2016-July 1, 2017
Census 2010-July 1, 2017—————————–July 1, 2016-July 1, 2017

1. Austin, TX: +399,507———————————–1. Orlando: +56,498
2. Orlando, FL: +375,432———————————2. Austin: +55,269
3. San Antonio, TX: +331,458—————————3. Charlotte: +49,786
4. Charlotte, NC: +308,313——————————-4. San Antonio: +47,763
5. Las Vegas, NV: +252,810—————————–5. Las Vegas: +47,355
6. Minneapolis, MN: +251,760————————–6. Minneapolis: +43,342
7. Nashville, TN: +232,162——————————-7. Nashville: +34,190
8. Portland, OR: +227,167——————————-8. Columbus: +31,748
9. Columbus: +176,724———————————–9. Portland: +30,066
10. Sacramento, CA: +175,740————————10. Sacramento: +29,651
11. San Jose, CA: +161,523—————————-11. Jacksonville: +28,477
12. Jacksonville, FL: +159,382————————-12. Indianapolis: +23,002
13. Indianapolis, IN: +140,524————————-13. Kansas City: +22,530
14. Kansas City, MO: +119,574————————14. Cincinnati: +13,053
15. Des Moines, IA: +76,278—————————15. Des Moines: +11,171
16. Chicago, IL: +71,499——————————–16. Grand Rapids: +10,287
17. Grand Rapids, MI: +70,173————————17. Omaha: +9,313
18. Omaha, NE: +67,960——————————–18. San Jose: +7,533
19. Cincinnati: +64,396———————————–19. Detroit: +7,133
20. Madison, WI: +48,802——————————-20. Madison: +6,798
21. Virginia Beach, VA: +48,429———————-21. Providence: +5,244
22. Milwaukee, WI: +20,282—————————22. Dayton: +2,530
23. Providence, RI: +19,912————————–23. Virginia Beach: +2,480
24. St. Louis, MO: +19,575—————————24. Akron: +949
25. Detroit, MI: +16,685——————————-25. Wichita: +948
26. Wichita, KS: +14,704——————————26. St. Louis: +556
27. Dayton: +4,165————————————-27. Milwaukee: +93
28. Akron: +302—————————————–28. Toledo: -923
29. Canton: -4,501————————————-29. Cleveland: -1,221
30. Toledo: -6,334————————————-30. Canton: -1,238
31. Cleveland: -18,427——————————-31. Youngstown: -2,617
32. Pittsburgh, PA: -22,924————————-32. Pittsburgh: -8,169
33. Youngstown: -23,873—————————-33. Chicago: -13,286

Now, as done with counties, let’s look at the components of population change for metro areas.

Total Births By Metro Census 2010-July 1, 2017 and July 1, 2016-July 1, 2017
Census 2010-July 1, 2017———————————July 1, 2016-July 1, 2017

1. Chicago: +869,178—————————————-1. Chicago: +115,915
2. Detroit: +364,121———————————————-2. Detroit: +49,940
3. Minneapolis: +331,430————————————–3. Minneapolis: +45,810
4. St. Louis: +246,280——————————————4. San Antonio: +34,318
5. San Antonio: +236,348————————————–5. St. Louis: +33,143
6. Charlotte: +217,525——————————————6. Charlotte: +31,315
7. Portland: +201,872——————————————-7. Orlando: +29,173
8. Orlando: +200,843——————————————-8. Portland: +28,220
9. Kansas City: +200,535————————————–9. Columbus: +27,663
10. Sacramento: +198,466————————————10. Kansas City: +27,565
11. Columbus: +197,185—————————————11. Las Vegas: +27,449
12. Cincinnati: +196,146—————————————12. Austin: +27,400
13. Las Vegas: +194,083————————————–13. Sacramento: +27,148
14. Indianapolis: +193,599————————————14. Cincinnati: +26,855
15. Austin: +188,961——————————————–15. Indianapolis: +26,769
16. San Jose: +176,224—————————————-16. Nashville: +24,690
17. Pittsburgh: +173,472—————————————17. San Jose: +23,826
18. Nashville: +170,824—————————————–18. Pittsburgh: +23,614
19. Cleveland: +168,361—————————————19. Cleveland: +22,873
20. Virginia Beach: +163,787———————————20. Milwaukee: +19,474
21. Milwaukee: +144,429————————————–21. Jacksonville: +18,748
22. Jacksonville: +130,339————————————22. Providence: +16,542
23. Providence: +120,526————————————-23. Grand Rapids: +13,548
24. Grand Rapids: +98,214———————————–24. Omaha: +13,421
25. Omaha: +96,558——————————————-25. Dayton: +9,615
26. Dayton: +69,855——————————————-26. Des Moines: +9,172
27. Wichita: +65,873——————————————27. Wichita: +8,694
28. Des Moines: +63,958————————————28. Madison: +7,400
29. Akron: +54,644——————————————–29. Toledo: +7,345
30. Toledo: +54,309——————————————-30. Akron: +7,342
31. Madison: +53,718—————————————-31. Virginia Beach: +5,935
32. Youngstown: +40,696———————————–32. Youngstown: +5,551
33. Canton: +32,199——————————————33. Canton: +4,434

Total Deaths By Metro Census 2010-July 1, 2017 and July 1, 2016-July 1, 2017
Census 2010-July 1, 2017———————————July 1, 2016-July 1, 2017

1. Chicago: -501,469—————————————1. Chicago: -72,491
2. Detroit: -293,091—————————————–2. Detroit: -41,075
3. Pittsburgh: -197,572————————————3. Pittsburgh: -27,439
4. St. Louis: -186,111————————————–4. St. Louis: -26,755
5. Minneapolis: -161,913———————————5. Minneapolis: -23,527
6. Cleveland: -153,138———————————–6. Cleveland: -21,068
7. Cincinnati: -135,975———————————–7. Cincinnati: -19,515
8. Charlotte: -127,523————————————-8. Charlotte: -19,009
9. Portland: -120,590————————————–9. Orlando: -18,268
10. Sacramento: -120,429——————————10. Sacramento: -18,081
11. Kansas City: -119,748——————————11. Portland: -17,875
12. Orlando: -117,771———————————–12. San Antonio: -17,679
13. San Antonio: -117,289——————————13. Kansas City: -17,106
14. Indianapolis: -113,742——————————14. Las Vegas: -16,867
15. Columbus: -108,704——————————–15. Indianapolis: -16,081
16. Las Vegas: -108,003——————————–16. Columbus: -15,833
17. Providence: -107,920——————————-17. Providence: -15,031
18. Nashville: -99,415———————————–18. Nashville: -14,723
19. Virginia Beach: -97,935—————————-19. Milwaukee: -13,399
20. Milwaukee: -95,601———————————20. Jacksonville: -13,288
21. Jacksonville: -86,920——————————-21. San Jose: -11,360
22. San Jose: -73,507———————————–22. Austin: -10,609
23. Austin: -67,704—————————————23. Dayton: -8,359
24. Dayton: -59,736————————————-24. Grand Rapids: -7,674
25. Grand Rapids: -53,725—————————-25. Akron: -7,138
26. Akron: -50,948—————————————26. Youngstown: -6,821
27. Youngstown: -50,302——————————27. Omaha: -6,667
28. Omaha: -47,763————————————-28. Toledo: -5,968
29. Toledo: -42,313————————————-29. Wichita: -5,686
30. Wichita: -40,647————————————30. Des Moines: -4,631
31. Canton: -31,722————————————31. Canton: -4,366
32. Des Moines: -31,563——————————32. Madison: -4,252
33. Madison: -30,385———————————-33. Virginia Beach: -3,280

Total Net Natural Change (Births vs. Deaths) By Metro Census 2010-July 1, 2017 and July 1, 2016-July 1, 2017
Census 2010-July 1, 2017———————————July 1, 2016-July 1, 2017

1. Chicago: +367,709—————————————1. Chicago: +43,424
2. Minneapolis: +169,517———————————–2. Minneapolis: +22,283
3. Austin: +121,257——————————————3. Austin: +16,791
4. San Antonio: +119,059———————————-4. San Antonio: +16,639
5. San Jose: +102,717————————————–5. San Jose: +12,466
6. Charlotte: +90,002—————————————-6. Charlotte: +12,306
7. Columbus: +88,481————————————–7. Columbus: +11,830
8. Las Vegas: +86,080————————————-8. Orlando: +10,905
9. Orlando: +83,072—————————————-9. Indianapolis: +10,688
10. Portland: +81,282————————————-10. Las Vegas: +10,582
11. Kansas City: +80,787———————————11. Kansas City: +10,459
12. Indianapolis: +79,857——————————–12. Portland: +10,345
13. Sacramento: +78,037——————————–13. Nashville: +9,967
14. Nashville: +71,409————————————14. Sacramento: +9,067
15. Detroit: +71,030—————————————15. Detroit: +8,865
16. Virginia Beach: +65,852—————————–16. Virginia Beach: +7,762
17. Cincinnati: +60,171———————————–17. Cincinnati: +7,340
18. St. Louis: +60,169————————————-18. Omaha: +6,754
19. Milwaukee: +48,828———————————-19. St. Louis: +6,388
20. Omaha: +48,795————————————–20. Grand Rapids: +5,874
21. Grand Rapids: +44,489—————————–21. Jacksonville: +5,460
22. Jacksonville: +43,419——————————-22. Des Moines: +4,541
23. Des Moines: +32,395——————————-23. Madison: +3,148
24. Wichita: +25,226————————————-24. Milwaukee: +6,075
25. Madison: +23,333———————————–25. Wichita: +3,008
26. Cleveland: +15,223——————————–26. Cleveland: +1,805
27. Providence: +12,606——————————27. Providence: +1,511
28. Toledo: +11,996———————————–28. Toledo: +1,377
29. Dayton: +10,119———————————-29. Dayton: +1,256
30. Akron: +3,696————————————–30. Akron: +204
31. Canton: +477—————————————31. Canton: +68
32. Youngstown: -9,606——————————-32. Youngstown: -1,270
33. Pittsburgh: -24,100——————————–33. Pittsburgh: -3,825

Total Domestic Migration By Metro Census 2010-July 1, 2017 and July 1, 2016-July 1, 2017
Census 2010-July 1, 2017———————————July 1, 2016-July 1, 2017

1. Austin: +224,351—————————————–1. Charlotte: +31,102
2. Charlotte: +177,484————————————-2. Austin: +30,120
3. San Antonio: +169,684——————————–3. Las Vegas: +29,414
4. Orlando: +155,498————————————–4. San Antonio: +24,891
5. Nashville: +126,142————————————-5. Orlando: +23,321
6. Las Vegas: +119,742———————————-6. Jacksonville: +18,921
7. Portland: +106,839————————————-7. Nashville: +18,708
8. Jacksonville: +87,040———————————8. Portland: +13,384
9. Sacramento: +49,262———————————9. Sacramento: +12,888
10. Columbus: +42,932———————————10. Columbus: +12,562
11. Des Moines: +32,042——————————-11. Kansas City: +8,531
12. Indianapolis: +30,772——————————-12. Minneapolis: +8,095
13. Kansas City: +16,802——————————-13. Indianapolis: +7,763
14. Madison: +13,224————————————14. Des Moines: +4,812
15. Grand Rapids: +12,355—————————-15. Grand Rapids: +2,217
16. Omaha: +5,265—————————————16. Madison: +1,706
17. Minneapolis: +432———————————–17. Cincinnati: +1,541
18. Canton: -5,797—————————————-18. Omaha: +383
19. Akron: -13,427—————————————-19. Dayton: -346
20. Youngstown: -16,228——————————-20. Akron: -877
21. Dayton: -16,864————————————–21. Canton: -1,469
22. Wichita: -18,452————————————–22. Youngstown: -1,711
23. Cincinnati: -21,259———————————-23. Providence: -2,588
24. Toledo: -23,102————————————–24. Toledo: -3,070
25. Pittsburgh: -24,397———————————25. Wichita: -3,235
26. Providence: -33,335——————————-26. Virginia Beach: -4,706
27. Milwaukee: -50,575——————————–27. Cleveland: -8,008
28. Virginia Beach: -51,916—————————28. Pittsburgh: -8,633
29. Cleveland: -64,353——————————–29. Milwaukee: -9,635
30. St. Louis: -67,560———————————30. St. Louis: -8,828
31. San Jose: -73,026——————————–31. Detroit: -14,863
32. Detroit: -141,006———————————-32. San Jose: -25,729
33. Chicago: -479,482——————————–33. Chicago: -85,177

Total International Migration By Metro Census 2010-July 1, 2017 and July 1, 2016-July 1, 2017
Census 2010-July 1, 2017———————————July 1, 2016-July 1, 2017

1. Chicago: +183,162—————————————1. Chicago: +28,302
2. Orlando: +135,860—————————————2. Orlando: +22,207
3. San Jose: +132,938————————————-3. San Jose: +20,747
4. Detroit: +86,366——————————————4. Detroit: +13,214
5. Minneapolis: +83,552———————————-5. Minneapolis: +13,107
6. Sacramento: +49,560———————————-6. Austin: +8,185
7. Austin: +49,311——————————————7. Sacramento: +7,722
8. Las Vegas: +46,411————————————8. Columbus: +7,350
9. Columbus: +45,744————————————9. Las Vegas: +7,221
10. Providence: +41,325——————————–10. Providence: +6,381
11. San Antonio: +40,953——————————-11. Portland: +6,335
12. Charlotte: +39,380———————————–12. Charlotte: +6,279
13. Portland: +38,542————————————13. San Antonio: +6,173
14. Virginia Beach: +34,619—————————-14. Nashville: +5,510
15. Nashville: +33,169———————————–15. Cleveland: +5,045
16. Cleveland: +31,236———————————-16. Indianapolis: +4,603
17. Indianapolis: +30,329——————————-17. Pittsburgh: +4,359
18. Jacksonville: +28,593——————————-18. Cincinnati: +4,285
19. St. Louis: +27,666————————————19. Jacksonville: +4,043
20. Pittsburgh: +27,300———————————20. St. Louis: +4,032
21. Cincinnati: +26,502———————————21. Milwaukee: +3,689
22. Kansas City: +23,098——————————22. Kansas City: +3,572
23. Milwaukee: +22,616——————————–23. Grand Rapids: +2,233
24. Omaha: +14,383————————————24. Omaha: +2,213
25. Grand Rapids: +13,800—————————25. Madison: +1,949
26. Madison: +12,367———————————-26. Des Moines: +1,807
27. Des Moines: +11,592—————————–27. Dayton: +1,654
28. Dayton: +11,230———————————–28. Akron: +1,647
29. Akron: +10,413————————————-29. Wichita: +1,187
30. Wichita: +8,117————————————-30. Virginia Beach: +1,077
31. Toledo: +4,627————————————-31. Toledo: +769
32. Youngstown: +2,171——————————32. Youngstown: +381
33. Canton: +1,118————————————33. Canton: +174

Total Net Migration By Metro Census 2010-July 1, 2017 and July 1, 2016-July 1, 2017
Census 2010-July 1, 2017———————————July 1, 2016-July 1, 2017

1. Orlando: +291,358————————————–1. Orlando: +45,528
2. Austin: +273,662—————————————-2. Austin: +38,305
3. Charlotte: +216,864————————————3. Charlotte: +37,381
4. San Antonio: +210,637——————————–4. Las Vegas: +36,635
5. Las Vegas: +166,153———————————-5. San Antonio: +31,064
6. Nashville: +159,311————————————6. Nashville: +24,218
7. Portland: +145,381————————————7. Jacksonville: +22,964
8. Jacksonville: +115,633——————————-8. Minneapolis: +21,202
9. Sacramento: +98,822——————————–9. Sacramento: +20,610
10. Columbus: +88,676——————————–10. Columbus: +19,912
11. Minneapolis: +83,984——————————11. Portland: +19,719
12. Indianapolis: +61,101——————————12. Indianapolis: +12,366
13. San Jose: +59,912———————————-13. Kansas City: +12,103
14. Des Moines: +43,634——————————14. Des Moines: +6,619
15. Kansas City: +39,900——————————15. Cincinnati: +5,826
16. Grand Rapids: +26,155—————————16. Grand Rapids: +4,450
17. Madison: +25,591———————————-17. Providence: +3,793
18. Omaha: +19,648————————————18. Madison: +3,655
19. Providence: +7,990———————————19. Omaha: +2,596
20. Cincinnati: +5,243———————————-20. Dayton: +1,308
21. Pittsburgh: +2,903———————————-21. Akron: +770
22. Akron: -3,014—————————————-22. Canton: -1,295
23. Canton: -4,679————————————–23. Youngstown: -1,330
24. Dayton: -5,634————————————–24. Detroit: -1,649
25. Wichita: -10,335————————————25. Wichita: -2,048
26. Youngstown: -14,057—————————–26. Toledo: -2,301
27. Virginia Beach: -17,297————————–27. Cleveland: -2,963
28. Toledo: -18,475————————————28. Virginia Beach: -3,629
29. Milwaukee: -27,959——————————29. Pittsburgh: -4,274
30. Cleveland: -33,117——————————-30. San Jose: -4,982
31. St. Louis: -39,894———————————31. St. Louis: -5,796
32. Detroit: -54,640————————————32. Milwaukee: -5,946
33. Chicago: -296,320——————————-33. Chicago: -56,875


2017 County Population Estimates


2017 county population estimates

Early this morning, the Census released the most recent population figures for counties, Metropolitan Statistical Areas and Consolidated Statistical Areas. The 2017 county population estimates, among others, cover the year from July 1, 2016 to July 1, 2017.


Here are Ohio’s 88 counties and their population Census 2010, July 1, 2016 and July 1, 2017.

Census 2010——————————July 1, 2016————————-July 1, 2017
1. Cuyahoga: 1,280,122———–1. Franklin: 1,269,998———–1. Franklin: 1,291,981
2. Franklin: 1,163,414————2. Cuyahoga: 1,253,454——–2. Cuyahoga: 1,248,514
3. Hamilton: 802,374 ————–3. Hamilton: 810,087————-3. Hamilton: 813,822
4. Summit: 541,781—————-4. Summit: 540,394—————4. Summit: 541,228
5. Montgomery: 535,153——5. Montgomery: 531,395——–5. Montgomery: 530,604
6. Lucas: 441,815——————6. Lucas: 432,562—————–6. Lucas 430,887
7. Stark: 375,586——————-7. Butler: 377,933——————7. Butler: 380,604
8. Butler: 368,130——————8. Stark: 373,528——————8. Stark: 372,542
9. Lorain: 301,356—————–9. Lorain: 306,590——————9. Lorain: 307,924
10. Mahoning: 238,823———10. Mahoning: 230,169————10. Lake: 230,117
11. Lake: 230,041—————–11. Lake: 229,270——————11. Mahoning: 229,796
12. Warren: 212,693————-12. Warren: 226,476—————12. Warren: 228,882
13. Trumbull: 210,312———–13. Clermont: 203,016————13. Clermont: 204,214
14. Clermont: 197,363———–14. Trumbull: 201,701————-14. Delaware: 200,464
15. Delaware: 174,214———–15. Delaware: 196,777————15. Trumbull: 200,380
16. Medina: 172,332————-16. Medina: 176,903—————16. Medina: 178,371
17. Licking: 166,492————–17. Licking: 171,822—————17. Licking: 173,448
18. Greene: 161,573————–18. Greene: 165,109—————-18. Greene: 166,752
19. Portage: 161,419————-19. Portage: 162,162—————19. Portage: 162,277
20. Fairfield: 146,156————20. Fairfield: 152,681—————-20. Fairfield: 154,733
21. Clark: 138,333—————–21. Clark: 134,621——————–21. Clark: 134,557
22. Wood: 125,488—————22. Wood: 129,704——————-22. Wood: 130,492
23. Richland: 124,475————23. Richland: 121,167—————-23. Richland: 120,589
24. Wayne: 114,520————–24. Wayne: 116,422——————24. Wayne: 116,038
25. Columbiana: 107,841——-25. Miami: 104,382——————–25. Miami: 105,122
26. Allen: 106,331—————-26. Columbiana: 103,744————26. Allen: 103,198
27. Miami: 102,506————–27. Allen: 103,626——————27. Columbiana: 103,077
28. Ashtabula: 101,497———28. Ashtabula: 98,169————–28. Ashtabula: 97,807
29. Geauga: 93,389————-29. Geauga: 93,848—————–29. Geauga: 93,918
30. Tuscarawas: 92,582——–30. Tuscarawas: 92,485————30. Tuscarawas: 92,297
31. Muskingum: 86,074———31. Muskingum: 85,929————-31. Muskingum: 86,149
32. Scioto: 79,499—————-32. Ross: 76,910———————32. Ross: 77,313
33. Ross: 78,064—————–33. Scioto: 76,240——————–33. Scioto: 75,929
34. Erie: 77,079——————34. Hancock: 75,590—————–34. Hancock: 75,754
35. Hancock: 74,782————35. Erie: 74,944———————–35. Erie: 74,817
36. Belmont: 70,400————-36. Belmont: 68,568—————–36. Belmont: 68,029
37. Jefferson: 69,709————37. Jefferson: 66,914—————37. Athens: 66,597
38. Marion: 66,501—————38. Athens: 66,320——————38. Jefferson: 66,359
39. Athens: 64,757—————39. Marion: 65,334——————39. Marion: 64,967
40. Lawrence: 62,450———–40. Knox: 60,832———————40. Knox: 61,261
41. Washington: 61,778———41. Lawrence: 60,729————–41. Washington: 60,418
42. Sandusky: 60,944————42. Washington: 60,535———–42. Lawrence: 60,249
43. Knox: 60,921——————43. Sandusky: 59,281————–43. Sandusky: 59,195
44. Huron: 59,626—————–44. Huron: 58,391——————-44. Huron: 58,494
45. Seneca: 56,745—————45. Pickaway: 57,530—————45. Pickaway: 57,830
46. Pickaway: 55,698————-46. Union: 55,456——————-46. Union: 56,741
47. Ashland: 53,139—————47. Seneca: 55,357—————–47. Seneca: 55,243
48. Darke: 53,139—————–48. Ashland: 53,417—————–48. Ashland: 53,628
49. Union: 52,300——————49. Darke: 51,636——————-49. Darke: 51,536
50. Shelby: 49,423—————–50. Shelby: 48,726—————–50. Shelby: 48,759
51. Auglaize: 45,949————–51. Auglaize: 45,797—————-51. Auglaize: 45,778
52. Logan: 45,858—————–52. Logan: 45,171——————-52. Logan: 45,325
53. Brown: 44,846—————–53. Holmes: 43,832—————–53. Madison: 44,036
54. Crawford: 43,784————-54. Brown: 43,644——————-54. Holmes: 43,957
55. Highland: 43,589————-55. Madison: 43,354—————–55. Brown: 43,576
56. Madison: 43,435————-56. Highland: 42,993—————–56. Highland: 42,971
57. Fulton: 42,698—————-57. Fulton: 42,325——————–57. Fulton: 42,289
58. Holmes: 42,366————–58. Crawford: 42,037—————–58. Clinton: 42,009
59. Preble: 42,270—————-59. Clinton: 41,881——————-59. Crawford: 41,746
60. Clinton: 42,040—————60. Preble: 41,105——————–60. Preble: 41,120
61. Ottawa: 41,428—————61. Mercer: 40,710——————-61. Mercer: 40,873
62. Mercer: 40,814—————62. Ottawa: 40,495——————-62. Ottawa: 40,657
63. Champaign: 40,097———63. Guernsey: 39,200—————63. Guernsey: 39,093
64. Guernsey: 40,087———–64. Champaign: 38,737————-64. Champaign: 38,840
65. Defiance: 39,037————65. Defiance: 38,121—————–65. Defiance: 38,156
66. Williams: 37,642————66. Williams: 36,921——————66. Williams: 36,784
67. Coshocton: 36,901———-67. Coshocton: 36,644————-67. Coshocton: 36,544
68. Perry: 36,058—————–68. Perry: 36,019——————–68. Perry: 36,024
69. Morrow: 34,827————–69. Morrow: 34,827——————69. Morrow: 34,994
70. Putnam: 34,499————–70. Putnam: 34,016—————–70. Putnam: 33,878
71. Jackson: 33,225————-71. Jackson: 32,534—————–71. Jackson: 32,449
72. Hardin: 32,058—————72. Hardin: 31,407——————-72. Hardin: 31,364
73. Gallia: 30,934—————-73. Gallia: 29,996———————73. Gallia: 29,973
74. Hocking: 29,380————-74. Fayette: 28,662——————74. Fayette: 28,752
75. Fayette: 29,030————–75. Hocking: 28,386—————–75. Hocking: 28,474
76. Carroll: 28,836—————76. Pike: 28,237———————–76. Pike: 28,270
77. Van Wert: 28,744————77. Van Wert: 28,166—————-77. Van Wert: 28,217
78. Pike: 28,709——————-78. Adams: 27,832——————-78. Adams: 27,726
79. Adams: 28,550—————79. Carroll: 27,637——————–79. Carroll: 27,385
80. Henry: 28,215—————-80. Henry: 27,269———————80. Henry: 27,185
81. Meigs: 23,770—————-81. Meigs: 23,177———————81. Meigs: 23,080
82. Wyandot: 22,615————-82. Wyandot: 22,042—————-82. Wyandot: 22,029
83. Paulding: 19,614————83. Paulding: 18,839——————83. Paulding: 18,845
84. Harrison: 15,864————-84. Harrison: 15,257——————84. Harrison: 15,216
85. Morgan: 15,054————–85. Morgan: 14,762——————-85. Morgan: 14,709
86. Noble: 14,645—————–86. Noble: 14,443———————86. Noble: 14,406
87. Monroe: 14,642————–87. Monroe: 14,097——————–87. Monroe: 13,946
88. Vinton: 13,435—————-88. Vinton: 13,021———————88. Vinton: 13,092

Columbus’ counties tended to move up in the rankings 2010-2017.


Let’s now take a look at total growth for the periods July 1, 2016-July 1, 2017 and Census 2010 to July 1, 2017.
Census 2010-July 1, 2017————————-July 1, 2016-July 1, 2017

1. Franklin: +128,452—————————–1. Franklin: +21,983
2. Delaware: +26,275—————————–2. Hamilton: +3,735
3. Warren: +16,049——————————–3. Delaware: +3,687
4. Butler: +12,474———————————-4. Butler: +2,671
5. Hamilton: +11,435——————————5. Warren: +2,406
6. Fairfield: +8,556——————————–6. Fairfield: +2,052
7. Licking: +6,956———————————7. Greene: +1,643
8. Clermont: +6,862——————————-8. Licking: +1,626
9. Lorain: +6,555———————————–9. Medina: +1,468
10. Medina: +6,038——————————-10. Lorain: +1,334
11. Greene: +5,178——————————-11. Union: +1,285
12. Wood: +5,003———————————12. Clermont: +1,198
13. Union: +4,482———————————13. Lake: +847
14. Miami: +2,621———————————14. Summit: +834
15. Pickaway: +2,152—————————–15. Wood: +788
16. Athens: +1,833——————————–16. Miami: +740
17. Holmes: +1,593——————————–17. Madison: +682
18. Wayne: +1,522———————————18. Knox: +429
19. Hancock: +965———————————19. Ross: +403
20. Portage: +856———————————-20. Pickaway: +300
21. Madison: +598———————————21. Athens: +277
22. Geauga: +508———————————-22. Muskingum: +220
23. Ashland: +489———————————23. Ashland: +211
24. Knox: +331————————————-24. Hancock: +164
25. Morrow: +167———————————25. Mercer: +163
26. Lake: +67————————————–26. Ottawa: +162
27. Muskingum: +63—————————–27. Logan: +154
28. Mercer: +59———————————-28. Montgomery: +147
29. Perry: -15————————————-29. Clinton: +128
30. Clinton: -28———————————–30. Holmes: +125
31. Auglaize: -171——————————-31. Portage: +115
32. Noble: -239———————————–32. Champaign: +103
33. Fayette: -273——————————–33. Huron: +103
34. Tuscarawas: -285————————–34. Fayette: +90
35. Vinton: -338———————————35. Hocking: +88
36. Morgan: -347——————————-36. Vinton: +71
37. Coshocton: -354—————————37. Geauga: +70
38. Fulton: -409———————————38. Van Wert: +51
39. Pike: -432———————————–39. Morrow: +40
40. Van Wert: -526—————————-40. Defiance: +35
41. Logan: -529———————————41. Pike: +33
42. Summit: -554——————————-42. Shelby: +33
43. Wyandot: -586——————————43. Preble: +15
44. Putnam: -618——————————-44. Paulding: +6
45. Highland: -629—————————–45. Perry: +5
46. Harrison: -646——————————46. Wyandot: -13
47. Shelby: -659——————————–47. Auglaize: -19
48. Meigs: -687———————————48. Highland: -22
49. Hardin: -696——————————–49. Gallia: -23
50. Monroe: -696——————————-50. Fulton: -36
51. Ross: -752———————————-51. Noble: -37
52. Paulding: -770——————————52. Harrison: -41
53. Jackson: -777——————————53. Hardin: -43
54. Ottawa: -777——————————-54. Morgan: -53
55. Adams: -826——————————-55. Clark: -64
56. Williams: -864—————————–56. Brown: -68
57. Defiance: -875—————————-57. Henry: -84
58. Hocking: -899—————————–58. Jackson: -85
59. Gallia: -973——————————–59. Sandusky: -86
60. Guernsey: -998————————–60. Meigs: -97
61. Henry: -1,030—————————–61. Coshocton: -100
62. Huron: -1,131—————————–62. Darke: -100
63. Preble: -1,139—————————-63. Adams: -106
64. Champaign: -1,253———————64. Guernsey: -107
65. Brown: -1,267—————————-65. Seneca: -114
66. Washington: -1,360———————66. Washington: -117
67. Darke: -1,433—————————-67. Erie: -127
68. Carroll: -1,451—————————68. Williams: -137
69. Seneca: -1,499————————-69. Putnam: -138
70. Marion: -1,534————————–70. Monroe: -151
71. Sandusky: -1,751———————-71. Tuscarawas: -188
72. Crawford: -2,039———————–72. Carroll: -252
73. Lawrence: -2,199———————-73. Crawford: -291
74. Erie: -2,249—————————–74. Scioto: -311
75. Belmont: -2,373————————75. Ashtabula: -362
76. Stark: -3,050—————————-76. Marion: -367
77. Allen: -3,128—————————-77. Mahoning: -373
78. Jefferson: -3,350———————-78. Wayne: -384
79. Scioto: -3,568————————–79. Allen: -428
80. Montgomery: -3,634——————80. Lawrence: -480
81. Ashtabula: -3,681———————81. Belmont: -539
82. Clark: -3,790—————————82. Jefferson: -555
83. Richland: -3,887———————-83. Richland: -578
84. Columbiana: -4,764——————84. Columbiana: -667
85. Mahoning: -9,011———————85. Stark: -986
86. Trumbull: -9,938———————-86. Trumbull: -1,321
87. Lucas: -10,928————————87. Lucas: -1,675
88. Cuyahoga: -31,595——————88. Cuyahoga: -4,940

Finally, let’s examine the components of population change, but top 15 only.

Top 15 Counties with the Most Births Census 2010-July 1, 2017 and July 1, 2016-July 1, 2017
Census 2010-July 1, 2017——————————–July 1, 2016-July 1, 2017

1. Franklin: +134,9580———————————–1. Franklin: +19,039
2. Cuyahoga: +107,949———————————-2. Cuyahoga: +14,637
3. Hamilton: +79,087————————————-3. Hamilton: +10,787
4. Montgomery: +48,275——————————–4. Montgomery: +6,576
5. Summit: +44,151—————————————5. Summit: +5,945
6. Lucas: +40,874—————————————–6. Lucas: +5,494
7. Butler: +32,888—————————————–7. Butler: +4,531
8. Stark: +30,188——————————————8. Stark: +4,163
9. Lorain: +24,497—————————————-9. Lorain: +3,329
10. Warren: +17,492————————————-10. Mahoning: +2,382
11. Mahoning: +17,312———————————11. Warren: +2,376
12. Clermont: +16,980———————————-12. Clermont: +2,307
13. Lake: +16,465—————————————–13. Lake: +2,244
14. Delaware: +15,662———————————-14. Delaware: +2,146
15. Trumbull: +15,153———————————–15. Trumbull: +2,059

Top 15 Counties with the Fewest Births Census 2010-July 1, 2017 and July 1, 2016-July 1, 2017
Census 2010-July 1, 2017——————————–July 1, 2016-July 1, 2017

1. Noble: +1,020——————————————-1. Noble: +131
2. Morgan: +1,050—————————————–2. Monroe: +135
3. Vinton: +1,051——————————————-3. Morgan: +139
4. Monroe: +1,083—————————————–4. Vinton: +144
5. Harrison: +1,150—————————————-5. Harrison: +149
6. Paulding: +1,595—————————————-6. Paulding: +213
7. Meigs: +1,762——————————————-7. Meigs: +228
8. Wyandot: +1,849—————————————8. Wyandot: +240
9. Carroll: +2,011—————————————–9. Carroll: +271
10. Hocking: +2,282————————————-10. Henry: +291
11. Henry: +2,295—————————————–11. Hocking: +309
12. Van Wert: +2,373————————————-12. Adams: +322
13. Adams: +2,431—————————————-13. Pike: +328
14. Ottawa: +2,489—————————————-14. Van Wert: +328
15. Pike: +2,504——————————————–15. Ottawa: +334

Top 15 Counties with the Most Deaths Census 2010-July 1, 2017 and July 1, 2016-July 1, 2017
Census 2010-July 1, 2017——————————–July 1, 2016-July 1, 2017

1. Cuyahoga: -98,692———————————–1. Cuyahoga: -13,439
2. Franklin: -65,458————————————–2. Franklin: -9,542
3. Hamilton: -56,157————————————-3. Hamilton: -7,768
4. Montgomery: -42,353——————————-4. Montgomery: -5,883
5. Summit: -40,895————————————–5. Summit: -5,735
6. Lucas: -31,778—————————————-6. Lucas: -4,465
7. Stark: -29.531—————————————–7. Stark: -4,077
8. Butler: -22,747—————————————-8. Butler: -3,347
9. Mahoning: -22,021———————————–9. Lorain: -2,947
10. Lorain: -21,265————————————-10. Mahoning: -2,920
11. Trumbull: -18,189———————————-11. Trumbull: -2,459
12. Lake: -17,265—————————————-12. Lake: -2,444
13. Clark: -12,267—————————————-13. Warren: -1,785
14. Clermont: -11,924———————————-14. Clermont: -1,706
15. Warren: -11,411————————————-15. Clark: -1,680

Top 15 Counties with the Fewest Deaths Census 2010-July 1, 2017 and July 1, 2016-July 1, 2017
Census 2010-July 1, 2017——————————–July 1, 2016-July 1, 2017

1. Noble: -916————————————————1. Noble: -131
2. Vinton: -1,025———————————————2. Vinton: -147
3. Morgan: -1,215——————————————-3. Morgan: -152
4. Monroe: -1,260——————————————-4. Harrison: -186
5. Paulding: -1,405—————————————–5. Paulding: -186
6. Harrison: -1,449——————————————6. Monroe: -189
7. Wyandot: -1,756—————————————–7. Wyandot: -246
8. Meigs: -2,004———————————————8. Henry: -249
9. Henry: -2,007———————————————9. Carroll: -289
10. Hocking: -2,131—————————————10. Meigs: -290
11. Putnam: -2,153—————————————–11. Hocking: -294
12. Carroll: -2,191—————————————–12. Putnam: -303
13. Holmes: -2,191—————————————–13. Van Wert: -306
14. Van Wert: -2,275—————————————14. Morrow: -308
15. Hardin: -2,284——————————————-15. Fayette: -318

Top 15 Counties with the Highest Natural Increase (Births vs. Deaths) Census 2010-July 1, 2017 and July 1, 2016-July 1, 2017
Census 2010-July 1, 2017——————————–July 1, 2016-July 1, 2017

1. Franklin: +69,500————————————-1. Franklin: +9,497
2. Hamilton: +22,930————————————2. Hamilton: +3,019
3. Butler: +10,141—————————————-3. Cuyahoga: +1,198
4. Cuyahoga: +9,257————————————4. Butler: +1,184
5. Lucas: +9,096——————————————5. Lucas: +1,029
6. Delaware: +8,339————————————-6. Delaware: +1,013
7. Warren: +6,081—————————————-7. Montgomery: +693
8. Montgomery: +5,922——————————–8. Clermont: +601
9. Clermont: +5,056————————————-9. Warren: +591
10. Holmes: +3,410————————————–10. Holmes: +445
11. Fairfield: +3,380————————————-11. Guernsey: +414
12. Wayne: +3,313—————————————12. Licking: +408
13. Summit: +3,256————————————-13. Wayne: +406
14. Lorain: +3,232—————————————14. Lorain: +382
15. Licking: +3,173————————————–15. Fairfield: +378

Top 15 Counties with the Lowest Natural Increase (Births vs. Deaths) Census 2010-July 1, 2017 and July 1, 2016-July 1, 2017
Census 2010-July 1, 2017——————————–July 1, 2016-July 1, 2017

1. Mahoning: -4,709—————————————1. Mahoning: -538
2. Trumbull: -3,036—————————————-2. Trumbull: -400
3. Jefferson: -2,097—————————————–3. Jefferson: -276
4. Belmont: -1,370——————————————4. Lake: -200
5. Erie: -990————————————————–5. Belmont: -197
6. Ottawa: -977———————————————-6. Ottawa: -171
7. Columbiana: -891—————————————7. Washington: -134
8. Washington: -829—————————————8. Erie: -132
9. Lake: -800———————————————–9. Columbiana: -130
10. Clark: -694———————————————10. Clark: -119
11. Scioto: -493——————————————–11. Scioto: -68
12. Crawford: -363—————————————-12. Lawrence: -67
13. Ashtabula: -354—————————————13. Meigs: -62
14. Harrison: -299—————————————–14. Monroe: -54
15. Lawrence: -285—————————————15. Harrison: -37

Top 15 Counties with the Most Domestic Migration Census 2010-July 1, 2017 and July 1, 2016-July 1, 2017
Census 2010-July 1, 2017——————————–July 1, 2016-July 1, 2017

1. Franklin: +18,270———————————-1. Franklin: +5,861
2. Delaware: +15,671———————————2. Delaware: +2,346
3. Warren: +6,996————————————-3. Fairfield: +1,491
4. Fairfield: +4,106————————————4. Warren: +1,332
5. Licking: +3,332————————————-5. Licking: +1,137
6. Medina: +2,900————————————-6. Medina: +1,058
7. Union: +1,953—————————————7. Union: +871
8. Pickaway: +1,489———————————-8. Greene: +763
9. Wood: +1,447—————————————9. Lake: +748
10. Clermont: +1,372——————————–10. Butler: +668
11. Miami: +1,293————————————-11. Madison: +639
12. Ottawa: +224————————————–12. Miami: +547
13. Madison: +177————————————13. Clermont: +515
14. Morgan: -186————————————–14. Ross: +379
15. Lorain: -271—————————————-15. Ottawa: +337

Top 15 Counties with the Least Domestic Migration Census 2010-July 1, 2017 and July 1, 2016-July 1, 2017
Census 2010-July 1, 2017——————————–July 1, 2016-July 1, 2017

1. Cuyahoga: -65,672————————————-1. Cuyahoga: -10,087
2. Hamilton: -25,292—————————————2. Lucas: -3,249
3. Lucas: -23,401——————————————-3. Montgomery: -1,656
4. Montgomery: -16,752———————————-4. Hamilton: -1,533
5. Summit: -10,630—————————————–5. Stark: -1,232
6. Trumbull: -6,852—————————————–6. Trumbull: -923
7. Mahoning: -6,113—————————————7. Wayne: -897
8. Allen: -4,673———————————————–8. Allen: -618
9. Stark: -4,510———————————————-9. Richland: -613
10. Richland: -4,240—————————————-10. Columbiana: -528
11. Columbiana: -3,802————————————11. Portage: -425
12. Ashtabula: -3,779—————————————12. Ashtabula: -412
13. Scioto: -3,267——————————————–13. Lawrence: -392
14. Clark: -3,198———————————————14. Marion: -389
15. Portage: -2,797—————————————–15. Tuscarawas: -382

Top 15 Counties with the Most International Migration Census 2010-July 1, 2017 and July 1, 2016-July 1, 2017
Census 2010-July 1, 2017——————————–July 1, 2016-July 1, 2017

1. Franklin: +40,914—————————————1. Franklin: +6,584
2. Cuyahoga: +24,799————————————2. Cuyahoga: +3,961
3. Hamilton: +14,063————————————–3. Hamilton: +2,288
4. Montgomery: +7,418————————————4. Montgomery: +1,131
5. Summit: +7,132——————————————5. Summit: +1,101
6. Butler: +5,226——————————————–6. Butler: +839
7. Lorain: +3,810——————————————–7. Lorain: +641
8. Greene: +3,443——————————————8. Portage: +546
9. Portage: +3,281—————————————–9. Lucas: +539
10. Lucas: +3,247——————————————10. Warren: +499
11. Warren: +3,140—————————————-11. Greene: +473
12. Delaware: +2,178————————————-12. Delaware: +336
13. Athens: +2,081—————————————–13. Athens: +326
14. Mahoning: +1,917————————————-14. Mahoning: +326
15. Lake: +1,740——————————————–15. Lake: +314

Top 15 Counties with the Least International Migration Census 2010-July 1, 2017 and July 1, 2016-July 1, 2017
Census 2010-July 1, 2017——————————–July 1, 2016-July 1, 2017

1. Lawrence: -168——————————————1. Lawrence: -19
2. Belmont: -113——————————————–2. Belmont: -18
3. Jefferson: -108——————————————-3. Jefferson: -16
4. Columbiana: -44—————————————–4. Columbiana: -7
5. Williams: -40———————————————-5. Williams: -6
6. Brown: -39————————————————6. Brown: -4
7. Holmes: -16———————————————–7. Holmes: -3
8. Monroe: -5————————————————8. Monroe: -1
9. Vinton: -2————————————————–9. Van Wert: -1
10. Meigs: 0————————————————10. Harrison: 0
11. Trumbull: +2——————————————-11. Ottawa: 0
12. Harrison: +4——————————————-12. Vinton: 0
13. Adams: +7———————————————13. Meigs: +1
14. Van Wert: +10—————————————-14. Noble: +1
15. Noble: +10——————————————–15. Pike: +1
16. Morgan: +10

Top 15 Counties with the Most Net Migration Census 2010-July 1, 2017 and July 1, 2016-July 1, 2017
Census 2010-July 1, 2017——————————–July 1, 2016-July 1, 2017

1. Franklin: +59,184—————————————1. Franklin: +12,445
2. Delaware: +17,849————————————–2. Delaware: +2,682
3. Warren: +10,136—————————————-3. Warren: +1,831
4. Fairfield: +5,274—————————————–4. Fairfield: +1,686
5. Licking: +3,928——————————————5. Butler: +1,507
6. Lorain: +3,539——————————————–6. Greene: +1,236
7. Medina: +3,492——————————————-7. Licking: +1,225
8. Wood: +2,720———————————————8. Medina: +1,142
9. Butler: +2,527——————————————–9. Lake: +1,062
10. Union: +2,415—————————————–10. Lorain: +969
11. Greene: +2,038—————————————-11. Union: +952
12. Clermont: +1,975————————————-12. Hamilton: +755
13. Miami: +1,662——————————————-13. Madison: +679
14. Pickaway: +1,556————————————-14. Summit: +649
15. Athens: +1,285——————————————15. Clermont +609

Top 15 Counties with the Least Net Migration Census 2010-July 1, 2017 and July 1, 2016-July 1, 2017
Census 2010-July 1, 2017——————————–July 1, 2016-July 1, 2017

1. Cuyahoga: -40,873————————————1. Cuyahoga: -6,126
2. Lucas: -20,154——————————————2. Lucas: -2,710
3. Hamilton: -11,229————————————–3. Stark: -1,061
4. Montgomery: -9,334———————————–4. Trumbull: -918
5. Trumbull: -6,850—————————————-5. Wayne: -794
6. Allen: -4,504———————————————6. Allen: -596
7. Mahoning: -4,196————————————–7. Richland: -587
8. Richland: -4,087—————————————-8. Columbiana: -535
9. Columbiana: -3,846————————————9. Montgomery: -525
10. Summit: -3,496—————————————-10. Lawrence: -411
11. Stark: -3,408——————————————-11. Marion: -379
12. Ashtabula: -3,327————————————-12. Belmont: -341
13. Scioto: -3,064——————————————13. Ashtabula: -336
14. Clark: -3,032——————————————–14. Tuscarawas: -326
15. Huron: -2,359——————————————-15. Holmes: -319

So there you have it for counties. Visit here for the 2017 metro statistics.