The US Census recently released 2015 census tract population density data, including census tract population density. I figured midway through the decade would be a good point to update where these stand because they give greater insight in smaller-scale population changes. I looked at all the census tracts in Franklin County and came up with the following map series.
First, the population in 2015.
Next, the population density of tracts in 2010, as reference.
And now 2015.
On the surface, it’s difficult to see the changes, but put side by side, you can tell there have been a lot of increases across the county. To make this more visible, I made the following maps.
You can see that some of the strongest density increases occurred around Downtown and the Short North, New Albany, parts of the Campus area, and Dublin.
The map above gives a straightforward look at where the density increased and decreased. As you can see, the increases FAR outweighed the decreases. Most of the latter were scattered except across the Far South Side and parts of the Whitehall area.
Here were the top 20 most dense census tracts in 2015. 1. 1810: 29,508.2 South Campus/Victorian Village 2. 1121: 25,287.9 Main Campus 3. 13: 21,961.4 Campus/Indianola Terrace 4. 1110: 18168.6 North Campus/Tuttle Park 5. 10: 17386.3 Campus/SoHud 6. 12: 16,981.9 Campus/Iuka Ravine 7. 20: 13,030.5 Short North/Victorian Village 8. 17: 12,872.3 Weinland Park 9. 6: 12,153.6 Old North Columbus 10. 21: 10,853.5 Short North/High Street 11. 8163: 10,255.3 Lincoln Village/Southwest Columbus 12: 4810: 9,557.4 South Central Hilltop 13. 47: 9,492.7 North Central Hilltop 14. 6352: 9,434.0 Northwest Columbus/Henderson Road 15. 57: 9,257.4 Brewery District/South German Village 16. 5: 9,177.9 Old North Columbus 17. 6933: 9,090.9 Forest Park East 18. 16: 8,980.5 Weinland Park 19. 4620: 8,928.6 North Central Hilltop 20. 1820: 8743.3 Victorian Village
It’s obvious that the High Street corridor is the most dense of the city, racking up most of the top 20.
Now here are the 20 tracts with the largest density increases 2010-2015. 1. 1121: 4,375.9 2. 6: 2,178.5 3. 21: 1,934.9 4. 22: 1,478.1 5. 40: 1,107.7 South Downtown 6. 1820: 1,044.1 7. 20: 921.7 8. 38: 904.3 Old Towne East 9. 5: 861.2 10. 210: 833.9 Clintonville 11. 32: 751.1 Arena District West/West Victorian Village 12. 730: 736.9 13. 7551: 656.0 Somerset/South Easton 14. 7951: 610.4 West Columbus 15. 6372: 574.6 Hayden Falls/Sawmill Road 16. 7209: 514 New Albany 17. 7395: 497.6 Blacklick/East Broad 18. 10: 492.8 19. 8230: 449.3 Westland 20. 710: 447.3 West-Central Linden
And finally, the top 20 largest declines 2010-2015. 1. 13: -2,964.3 2. 12: -1,625.1 3. 42: -1,620.8 Scioto Peninsula/East Franklinton 4. 920: -902.2 Northeast Linden 5. 17: -775.4 6. 50: -554.4 Franklinton 7. 61: -485.7 South High Street 8. 59: -441.9 Near South Side/Deshler Park 9. 4620: -380.4 10. 720: -380.2 11. 4610: -335.4 12. 820: -305.4 North Linden 13. 7721: -305.2 North Linden 14. 45: -258.1 North Hilltop 15. 60: -253.2 Vassor Village 16. 810: North Central Linden 17. 7532: -240.3 Morse Road/Easton 18. 2520: -240.1 Near East Side/King-Lincoln 19. 47: -206.6 20. 9333: -194.9 Linwood
So there you have it. The Census Tract Maps page gives demographic and population data for census tracts going back to 1930.
In the 2nd post related to the recently-released Censusdemographic data, I’ll look at Columbus city diversity and how it’s been changing since 2005, as well as how it compares to other regional and national peers.
Rank by City of Total White, non-Hispanic Population by Year 2005————————————–2010————————————-2015 1. Chicago, IL: 819,215————1. Chicago: 853,910—————1. Chicago: 879,318 2. Indianapolis, IN: 491,044——2. Indianapolis: 482,195———–2. Columbus: 491,602 3. Columbus: 442,958————-3. Columbus: 470,971————-3. Indianapolis: 479,376 4. Portland, OR: 382,033———-4. Portland: 417,876—————4. Portland: 449,552 5. San Antonio, TX: 356,420—–5. Austin: 384,065——————5. Austin: 444,638 6. Austin, TX: 347,013————-6. San Antonio: 351,420———-6. Nashville: 365,542 7. Nashville, TN: 314,518——–7. Nashville: 339,030————–7. San Antonio: 364,707 8. Charlotte, NC: 302,789——-8. Charlotte: 331,357—————8. Charlotte: 356,507 9. Virginia Beach, VA: 290,891–9. Virginia Beach: 282,812——9. Omaha: 293,631 10. San Jose, CA: 281,822—–10. Las Vegas: 280,604——-10. Virginia Beach: 281,686 11. Las Vegas, NV: 281,679—-11. Omaha: 277,606————–11. Las Vegas: 278,444 12. Omaha, NE: 267,685——–12. San Jose: 265,311————12. San Jose: 268,948 13. Kansas City, MO: 249,123—13. Kansas City: 247,473——13. Kansas City: 261,360 14. Milwaukee, WI: 219,891——14. Minneapolis: 242,848——14. Minneapolis: 243,709 15. Minneapolis, MN: 216,975—-15. Milwaukee: 221,514——-15. Milwaukee: 216,755 16. Toledo: 183,746—————–16. Pittsburgh: 203,622——–16. Pittsburgh: 192,187 17. Pittsburgh, PA: 180,725——-17. Toledo: 177,341————17. Toledo: 164,305 18. Sacramento, CA: 160,599—-18. Sacramento: 165,610—–18. Sacramento: 155,784 19. Cleveland: 147,359————19. Cincinnati: 143,120——–19. Cincinnati: 147,360 20. St. Louis, MO: 143,590——–20. Cleveland: 137,977——–20. St. Louis: 138,178 21. Cincinnati: 138,486————-21. St. Louis: 134,146———-21. Cleveland: 133,998 22. Akron: 128,976——————22. Akron: 120,800————22. Grand Rapids: 119,128 23. Grand Rapids, MI: 113,791—23. Grand Rapids: 104,636—-23. Akron: 117,587 24. Orlando, FL: 92,326————24. Orlando: 96,867————24. Orlando: 102,822 25. Detroit, MI: 77,163————–25. Dayton: 72,663————-25. Dayton: 75,539 26. Dayton: 67,581——————26. Providence: 64,284——-26. Detroit: 64,511 27. Providence, RI: 64,223——–27. Detroit: 55,298————-27. Providence: 61,492
Columbus moved from 3rd to 2nd over the 10-year period for total White, non-Hispanic population.
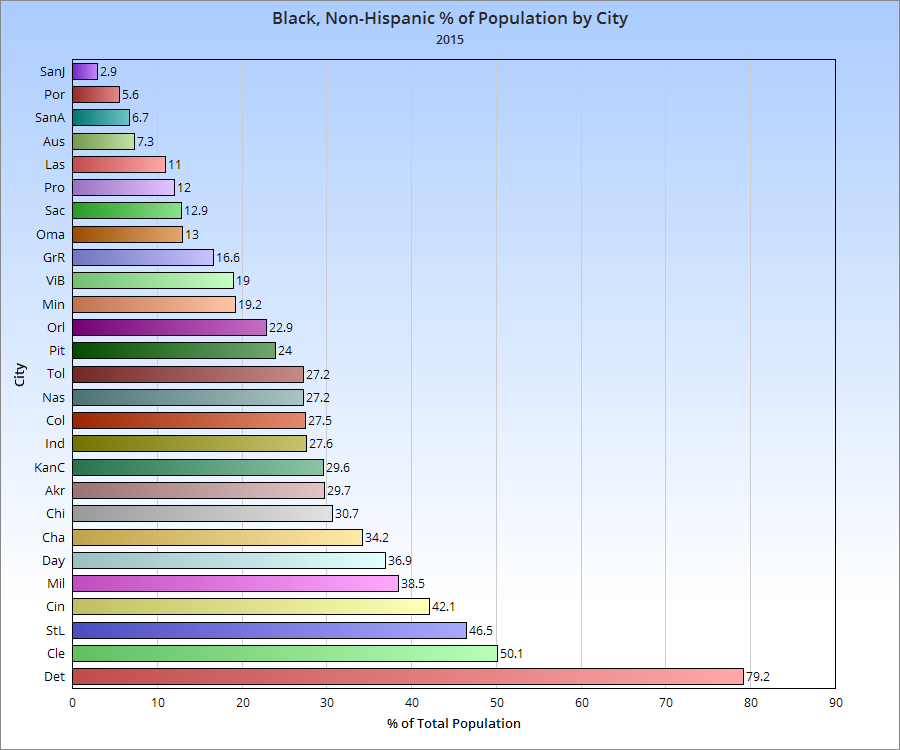
Rank by City of Total Black, non-Hispanic Population by Year 2005—————————————–2010———————————2015 1. Chicago: 938,097—————–1. Chicago: 895,294———–1. Chicago: 834,048 2. Detroit: 683,999——————–2. Detroit: 587,707————-2. Detroit: 536,527 3. Milwaukee: 222,040————–3. Charlotte: 251,274———-3. Charlotte: 282,456 4. Cleveland: 221,797—————4. Milwaukee: 230,473——–4. Indianapolis: 234,338 5. Charlotte: 205,216—————-5. Indianapolis: 226,314——-5. Columbus: 233,320 6. Indianapolis: 193,948————6. Columbus: 216,486———6. Milwaukee: 231,304 7. Columbus: 179,197—————7. Cleveland: 208,528———7. Cleveland: 194,350 8. St. Louis: 168,768—————-8. Nashville: 171,104———–8. Nashville: 178,293 9. Nashville: 148,051—————-9. St. Louis: 157,382———–9. St. Louis: 146,925 10. Kansas City: 131,694———-10. Kansas City: 138,461—–10. Kansas City: 140,515 11. Cincinnati: 131,010————-11. Cincinnati: 131,909——–11. Cincinnati: 125,621 12. Pittsburgh: 81,758————–12. Virginia Beach: 79,583—-12. San Antonio: 98,876 13. Virginia Beach: 80,004——–13. San Antonio: 79,307——13. Virginia Beach: 85,867 14. Orlando: 73,736—————–14. Toledo: 75,033————-14. Minneapolis: 78,861 15. Toledo: 72,190——————-15. Pittsburgh: 71,539——–15. Toledo: 76,173 16. Sacramento: 71,452————16. Orlando: 70,988————16. Pittsburgh: 73,012 17. San Antonio: 70,723————17. Minneapolis: 63,749——17. Las Vegas: 68,777 18. Dayton: 60,196——————-18. Sacramento: 61,976——18. Austin: 68,061 19. Akron: 59,810——————–19. Austin: 61,833————–19. Sacramento: 63,477 20. Las Vegas: 59,780————–20. Dayton: 61,402————-20. Orlando: 61,955 21. Austin: 59,583——————-21. Akron: 60,653—————-21. Akron: 58,716 22. Minneapolis: 57,499————22. Las Vegas: 60,187———22. Omaha: 57,546 23. Omaha: 50,333——————23. Omaha: 55,086————-23. Dayton: 51,896 24. Grand Rapids: 40,408———24. Grand Rapids: 41,848—–24. Portland: 35,362 25. Portland: 30,828—————25. Portland: 37,355————-25. Grand Rapids: 32,423 26. San Jose: 27,446————–26. San Jose: 29,831———–26. San Jose: 30,068 27. Providence: 18,794————27. Providence: 19,265——–27. Providence: 21,484
Columbus moved up from 7th to 5th in total Black, non-Hispanic during the period.
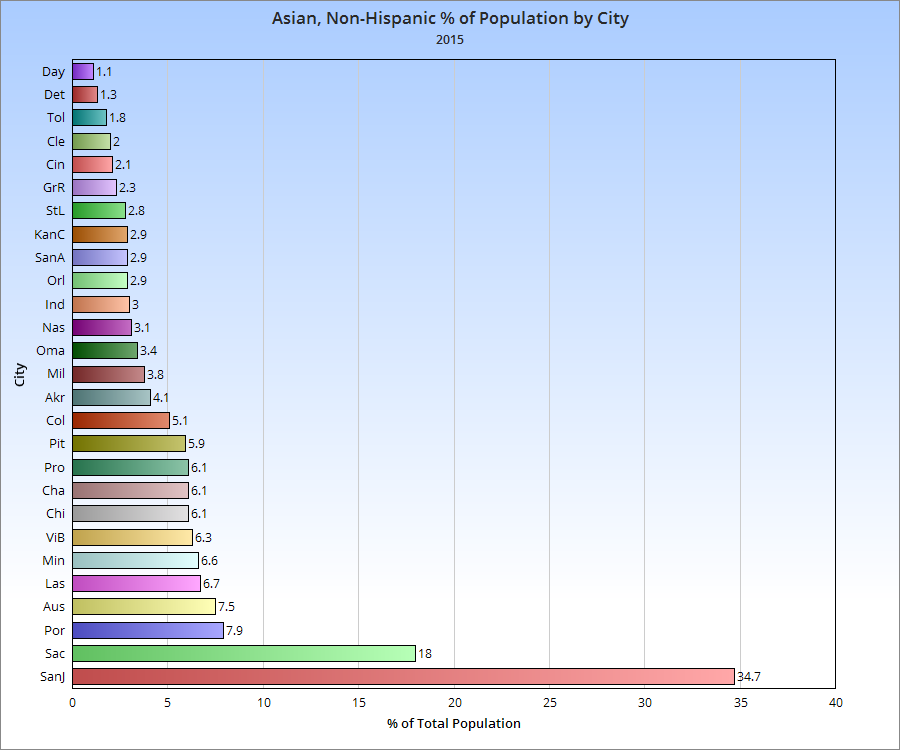
Rank by City of Total Asian, non-Hispanic Population by Year 2005————————————-2010——————————————2015 1. San Jose: 269,186————–1. San Jose: 303,227—————–1. San Jose: 355,777 2. Chicago: 127,686—————-2. Chicago: 148,280——————2. Chicago: 166,771 3. Sacramento: 80,307————3. Sacramento: 84,556————-3. Sacramento: 88,422 4. Portland: 36,278—————–4. Austin: 46,575———————-4. Austin: 69,696 5. Austin: 35,239——————–5. Portland: 43,185——————-5. Charlotte: 50,142 6. Columbus: 27,125—————6. Las Vegas: 37,406—————-6. Portland: 49,811 7. Las Vegas: 25,077————–7. Charlotte: 37,181——————7. Columbus: 42,933 8. Charlotte: 23,356—————-8. Columbus: 35,468—————-8. San Antonio: 41,988 9. Virginia Beach: 22,501———9. San Antonio: 29,200————-9. Las Vegas: 41,782 10. San Antonio: 20,492———10. Virginia Beach: 27,303—–10. Virginia Beach: 28,358 11. Minneapolis: 20,189———-11. Milwaukee: 22,670————11. Minneapolis: 26,958 12. Milwaukee: 19,596————12. Minneapolis: 21,426———–12. Indianapolis: 25,264 13. Nashville: 16,943—————13. Indianapolis: 17,137———-13. Milwaukee: 22,497 14. Indianapolis: 12,312———–14. Nashville: 17,045————–14. Nashville: 20,577 15. Providence: 10,751————15. Pittsburgh: 12,036————-15. Pittsburgh: 18,067 16. Pittsburgh: 10,727————–16. Providence: 11,497———–16. Omaha: 15,243 17. Kansas City: 10,674———-17. Kansas City: 10,263———–17. Kansas City: 13,552 18. Detroit: 9,577——————-18. St. Louis: 8,717—————–18. Providence: 10,842 19. St. Louis: 7,046—————–19. Omaha: 8,397——————19. St. Louis: 8,920 20. Omaha: 6,971——————20. Orlando: 7,870——————20. Detroit: 8,790 21. Cincinnati: 6,874—————21. Detroit: 6,549——————–21. Akron: 8,006 22. Cleveland: 6,289————–22. Cincinnati: 5,938—————–22. Orlando: 7,949 23. Orlando: 5,528—————–23. Cleveland: 5,392—————–23. Cleveland: 7,874 24. Toledo: 4,150——————-24. Akron: 4,567———————-24. Cincinnati: 6,259 25. Akron: 3,497——————–25. Grand Rapids: 3,695———–25. Toledo: 5,008 26. Grand Rapids: 2,847———26. Toledo: 3,125——————-26. Grand Rapids: 4,451 27. Dayton: 1,827——————27. Dayton: 1,231——————-27. Dayton: 1,548
Columbus fell from 6th to 7th in Asian, non-Hispanic population.
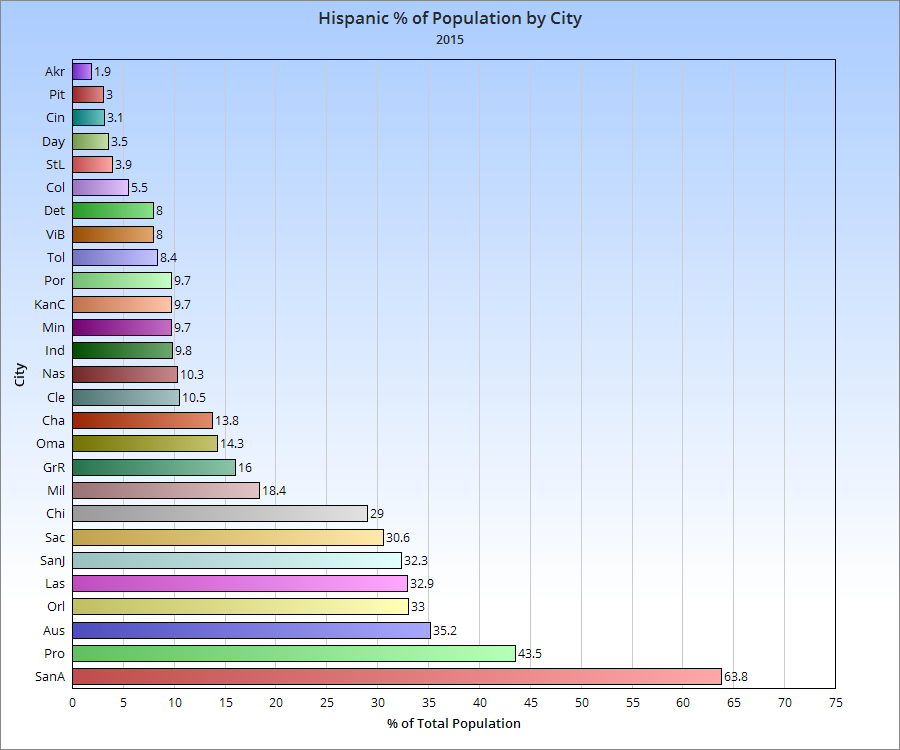
Rank by City of Total Hispanic Population by Year 2005——————————————–2010————————————2015 1. Chicago: 778,234—————1. San Antonio: 853,654———-1. San Antonio: 937,607 2. San Antonio: 735,458———–2. Chicago: 763,968—————2. Chicago: 787,725 3. San Jose: 279,420————–3. San Jose: 318,389————–3. San Jose: 331,232 4. Austin: 223,361——————4. Austin: 288,130——————4. Austin: 327,680 5. Las Vegas: 153,813————5. Las Vegas: 181,923————-5. Las Vegas: 204,913 6. Sacramento: 111,559———6. Sacramento: 124,461———–6. Sacramento: 150,153 7. Milwaukee: 80,945————-7. Milwaukee: 104,619————-7. Charlotte: 113,731 8. Providence: 60,008————-8. Charlotte: 96,246—————-8. Milwaukee: 110,335 9. Charlotte: 58,466—————9. Indianapolis: 78,467————-9. Orlando: 89,306 10. Indianapolis: 47,764———10. Providence: 76,645————10. Indianapolis: 83,426 11. Detroit: 46,993—————–11. Nashville: 61,212————–11. Providence: 77,968 12. Orlando: 43,978—————12. Portland: 58,986—————12. Nashville: 67,526 13. Portland: 43,324—————13. Orlando: 56,061—————13. Omaha: 63,516 14. Omaha: 39,674—————–14. Omaha: 53,661—————14. Portland: 61,064 15. Nashville: 37,463—————15. Kansas City: 49,800———15. Detroit: 53,980 16. Minneapolis: 37,017———–16. Detroit: 45,580—————-16. Columbus: 46,855 17. Kansas City: 35,995———–17. Columbus: 43,276————17. Kansas City: 46,037 18. Grand Rapids: 32,368———18. Cleveland: 36,067———-18. Cleveland: 40,603 19. Cleveland: 32,085————–19. Minneapolis: 34,504——-19. Minneapolis: 39,981 20. Columbus: 24,607———–20. Grand Rapids: 30,659——20. Virginia Beach: 36,309 21. Virginia Beach: 20,803——–21. Virginia Beach: 29,206—-21. Grand Rapids: 31,282 22. Toledo: 18,404——————22. Toledo: 21,346————–22. Toledo: 23,614 23. St. Louis: 8,268—————–23. St. Louis: 11,207————-23. St. Louis: 12,261 24. Pittsburgh: 5,018—————24. Cincinnati: 8,710————-24. Pittsburgh: 9,266 25. Cincinnati: 3,855—————25. Pittsburgh: 7,282————-25. Cincinnati: 9,121 26. Akron: 3,485——————–26. Akron: 3,990——————-26. Dayton: 4,945 27. Dayton: 1,693——————-27. Dayton: 3,180—————–27. Akron: 3,684
Columbus moved up from 20th to 16th in the total Hispanic population.
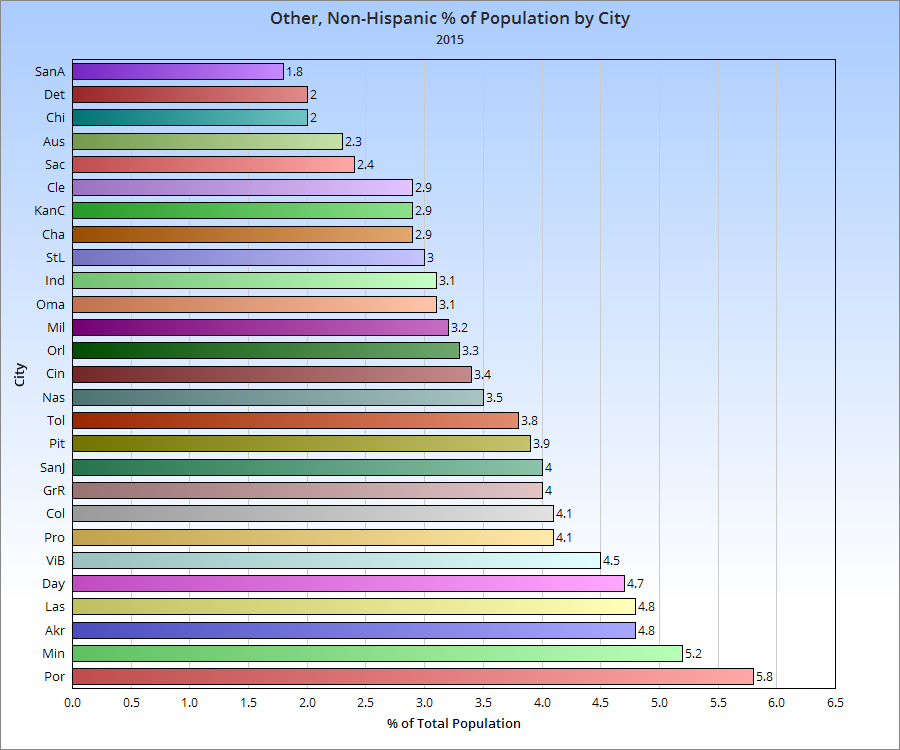
Rank by City of Total Other, non-Hispanic Population by Year 2005——————————————-2010———————————————–2015 1. Chicago: 38,694—————1. Chicago: 37,379————————–1. Chicago: 54,694 2. San Jose: 29,456————2. San Jose: 32,439————————2. San Jose: 40,894 3. Sacramento: 21,370———-3. Sacramento: 30,900——————-3. Portland: 36,398 4. Portland: 21,164————–4. Portland: 28,027————————4. Columbus: 34,357 5. Indianapolis: 20,242———-5. Las Vegas: 24,521—————–5. Sacramento: 32,909 6. Columbus: 20,096————-6. Columbus: 23,738——————6. Las Vegas: 29,853 7. San Antonio: 19,130———-7. San Antonio: 20,778—————7. San Antonio: 26,646 8. Minneapolis: 18,580———-8. Minneapolis: 20,753—————-8. Indianapolis: 26,019 9. Detroit: 18,324—————–9. Virginia Beach: 20,268————-9. Charlotte: 24,285 10. Las Vegas: 18,304———-10. Indianapolis: 20,086————–10. Nashville: 22,658 11. Virginia Beach: 16,685—-11. Charlotte: 18,360——————11. Austin: 21,765 12. Milwaukee: 14,476———-12. Detroit: 16,776——————–12. Minneapolis: 21,426 13. Kansas City: 13,399——–13. Milwaukee: 16,311———–13. Virginia Beach: 20,525 14. Austin: 13,261—————-14. Omaha: 15,519—————-14. Milwaukee: 19,263 15. Charlotte: 11,771————-15. Austin: 14,915—————–15. Omaha: 13,951 16. Omaha: 8,552—————–16. Kansas City: 14,668———-16. Kansas City: 13,897 17. Toledo: 7,447——————17. Nashville: 14,227————-17. Detroit: 13,316 18. Cincinnati: 7,315————–18. Pittsburgh: 12,080————18. Pittsburgh: 11,853 19. Cleveland: 7,004————–19. Toledo: 10,134—————-19. Cleveland: 11,234 20. Providence: 6,488————-20. Akron: 9,020——————20. Toledo: 10,678 21. Pittsburgh: 6,138————–21. Cleveland: 8,276—————21. Cincinnati: 10,176 22. St. Louis: 6,058—————-22. St. Louis: 7,704—————22. Akron: 9,560 23. Orlando: 5,731—————–23. Grand Rapids: 7,376——-23. St. Louis: 9,401 24. Nashville: 5,687—————24. Orlando: 7,251————–24. Orlando: 8,885 25. Akron: 4,431——————–25. Cincinnati: 7,230———–25. Grand Rapids: 7,815 26. Grand Rapids: 4,154———26. Providence: 6,471———-26. Providence: 7,418 27. Dayton: 1,382——————27. Dayton: 3,025—————27. Dayton: 6,669
Finally, Columbus moved up from 6th to 4th in the total of Other, non-Hispanic population. Overall, Columbus ranks fairly well in totals vs. its peers, as one might expect given that it is one of the largest cities in the grouping. However, to truly find out how it compares with these other cities, you have to look at percentages, which tells how much of the city’s populationis made up of each group. Columbus had the 8th highest White, non-Hispanic % of total population of the city in 2015.
Columbus had the 12th highest Black, non-Hispanic % of total population.
Columbus also had the 12th highest Asian, non-Hispanic % of total population.
Columbus ranks poorly with Hispanics in the group, having only the 22nd highest % of population.
Finally, Columbus ranks 8th again in Other, non-Hispanic % of population.
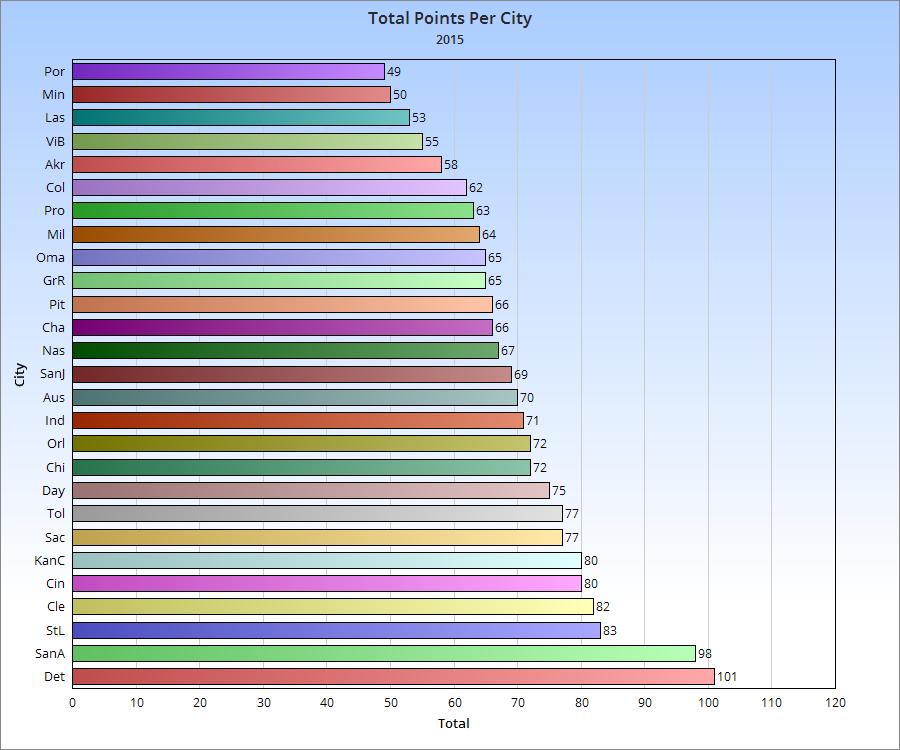
So what’s the final ranking for where Columbus is with diversity compared to its peers? To find out, I assigned points based on ranked position in each 5 racial categories. The final total determined where the cities ranked overall.
So based on this, Columbus is the 6th most racially diverse city of the 27 cities measured. This is no doubt surprising, but not so much when you get to the numbers.
*Note: Normally, Youngstown would be included, but the data was not available.
As promised, here are the 2015 metro area population estimates for Columbus and its regional and national peers.
2015 Metro Population Estimates Chicago, IL: 9,551,031 Detroit, MI: 4,302,043 Minneapolis, MN: 3,524,583 St. Louis, MO: 2,811,588 Charlotte, NC: 2,426,363 Portland, OR: 2,389,228 Orlando, FL: 2,387,138 San Antonio, TX: 2,384,075 Pittsburgh, PA: 2,353,045 Sacramento, CA: 2,274,194 Cincinnati: 2,157,719 Las Vegas, NV: 2,114,801 Kansas City, MO: 2,087,471 Cleveland: 2,060,810 Columbus: 2,021,632 Austin, TX: 2,000,860 Indianapolis: 1,988,817 San Jose, CA: 1,976,836 Nashville, TN: 1,830,345 Virginia Beach, VA: 1,724,876 Providence, RI: 1,613,070 Milwaukee, WI: 1,575,747 Grand Rapids, MI: 1,038,583 Omaha, NE: 915,312 Dayton: 800,909 Akron: 704,243 Toledo: 605,956 Youngstown: 549,885
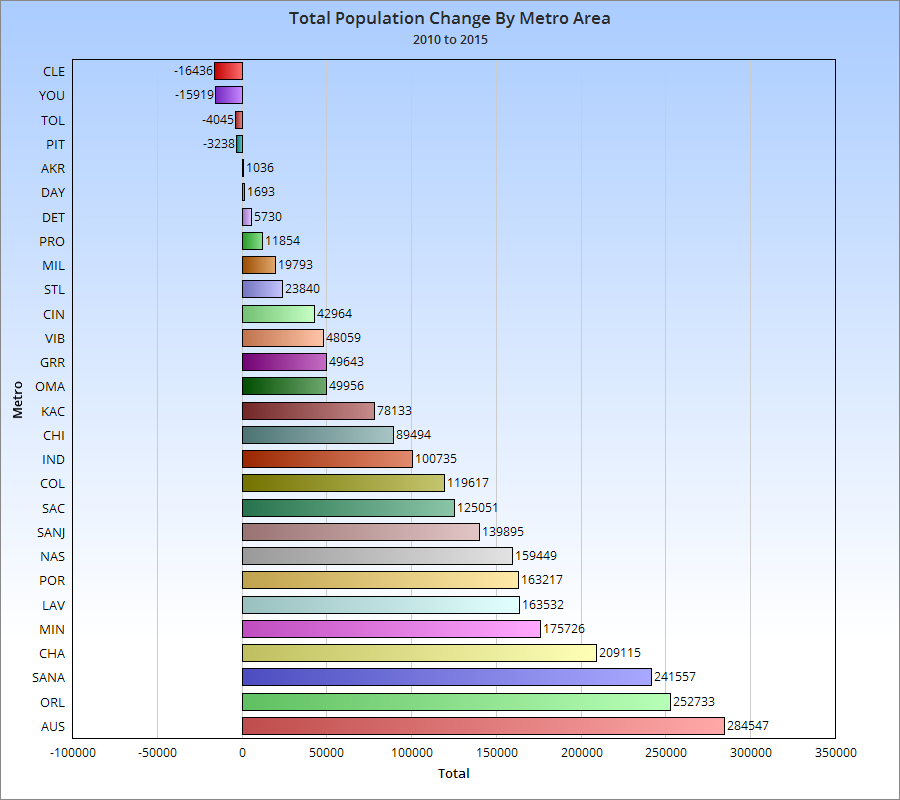
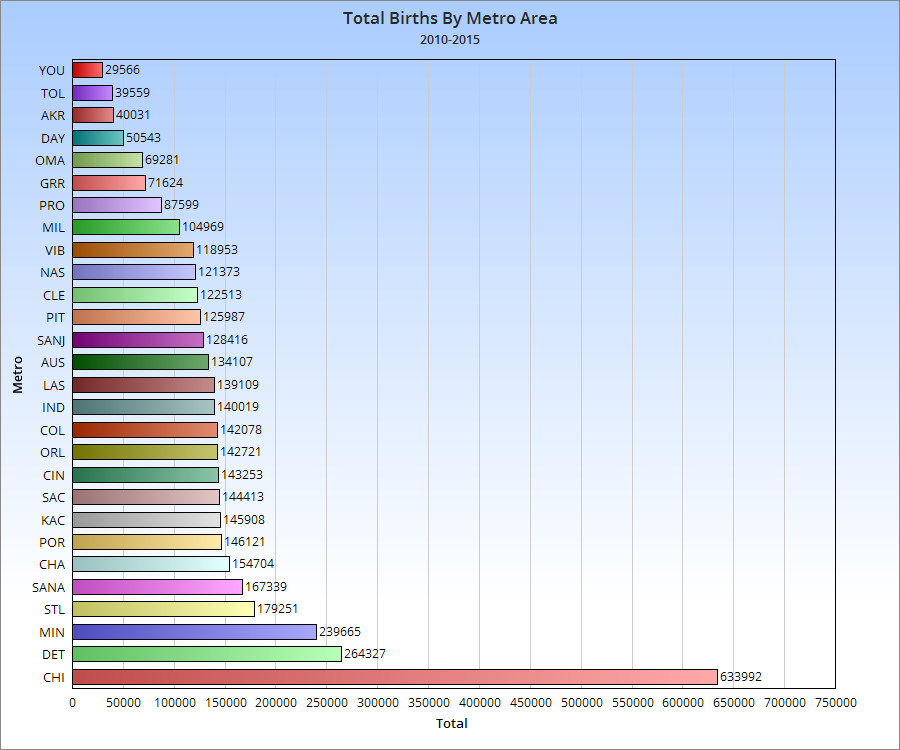
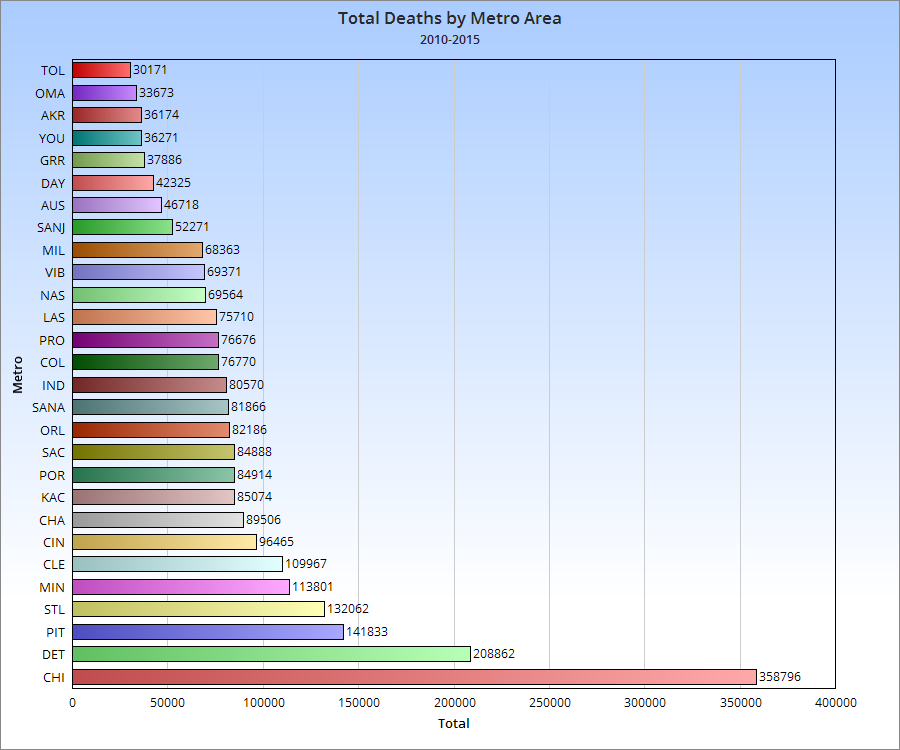
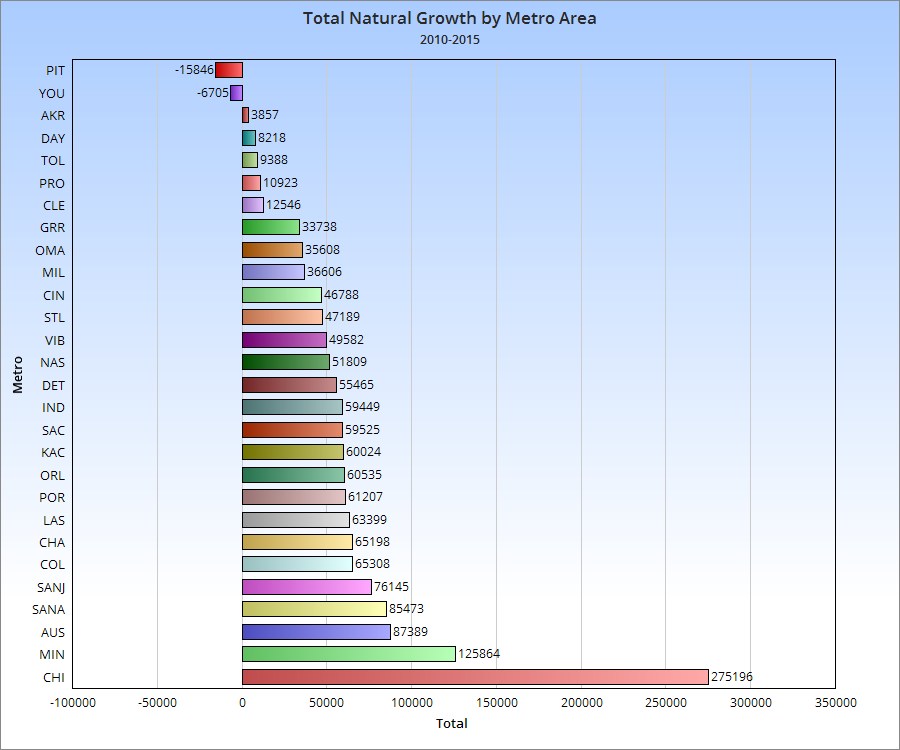
Components of Metro Area Population Change As you can see, while Columbus has a middle of the road birth rate for its peers, its relatively low death rate means that it manages to be near the top of the its peer group in natural growth.
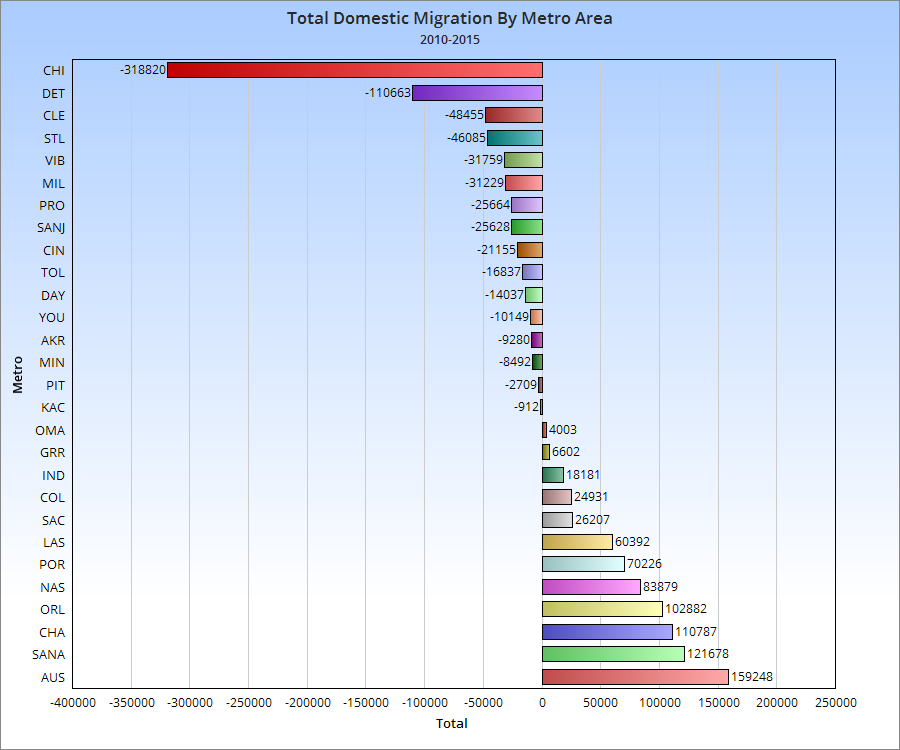
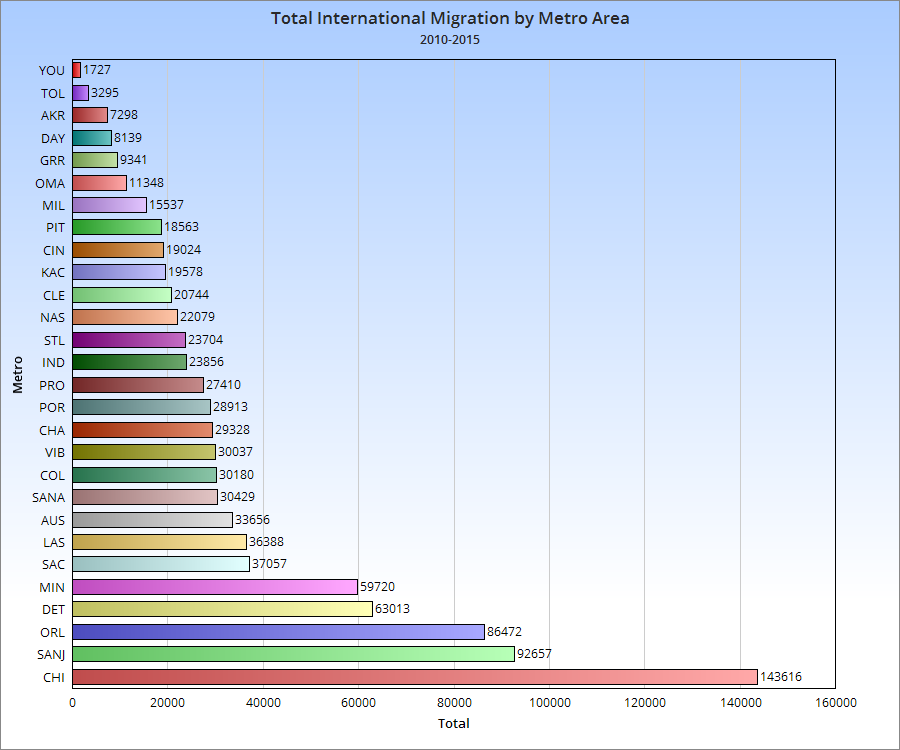
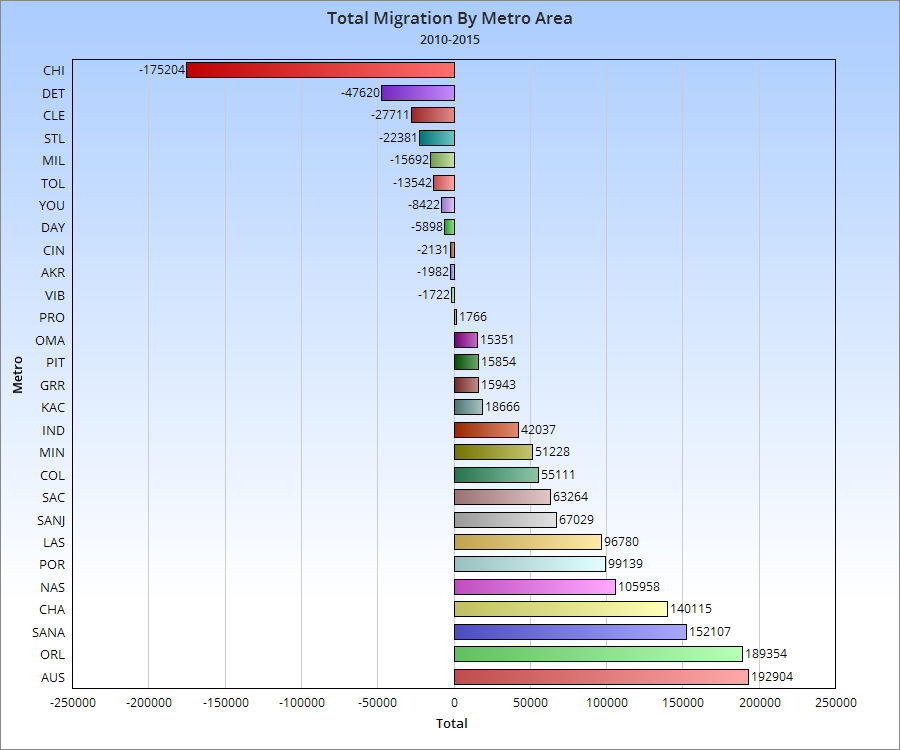
It seems that while international migration is competitive with peers in the Columbus metro, domestic migration would need to improve to truly be at the upper peer level. At the very least, it is positive.
The US Census has released its population estimates for both counties and metros for the year ending July 1, 2015. Here is a detailed look at Ohio’s counties in this 2015 county population estimates report.
From the numbers above, Columbus’ Franklin County was just below Cuyahoga last year. It is likely that, given each county’s growth rates, Franklin has now passed up Cuyahoga to become Ohio’s most populated county.
Franklin County’s natural growth rate destroys every other county in the state. It gains almost 7x that of Cuyahoga County, despite Cuyahoga having a larger population during this period, and nearly 3x that of Hamilton County.