The Housing Market Update January 2023 data, the first of the new year, from Columbus Realtors showed that home sales and overall supply continued to decline, helping to ensure most areas saw continued increases in median prices.
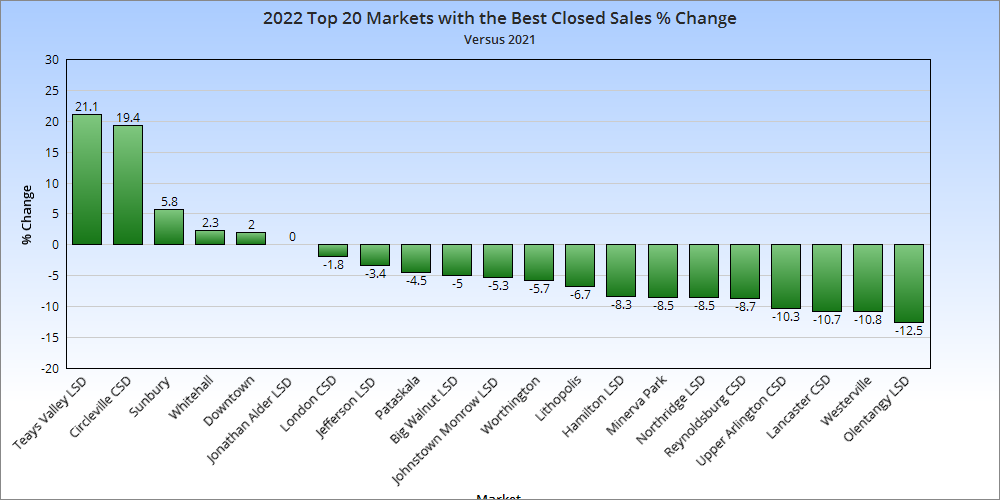
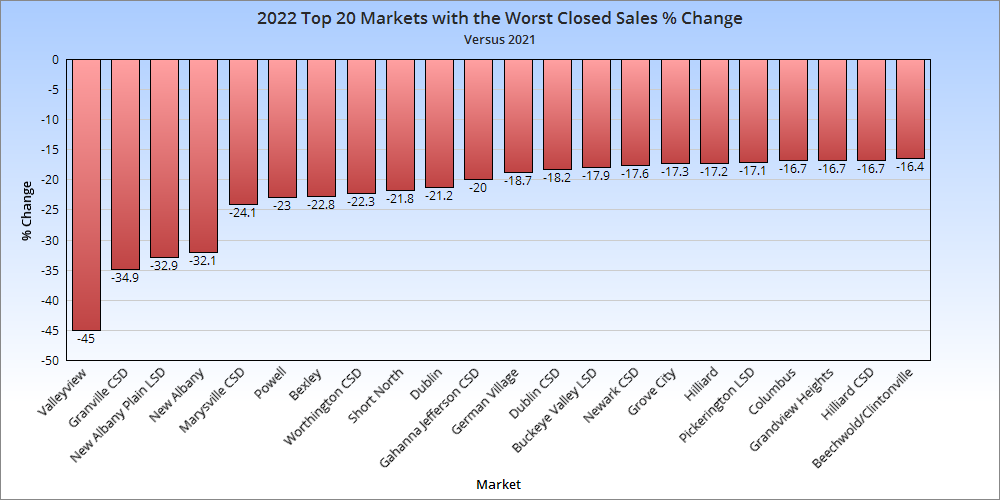
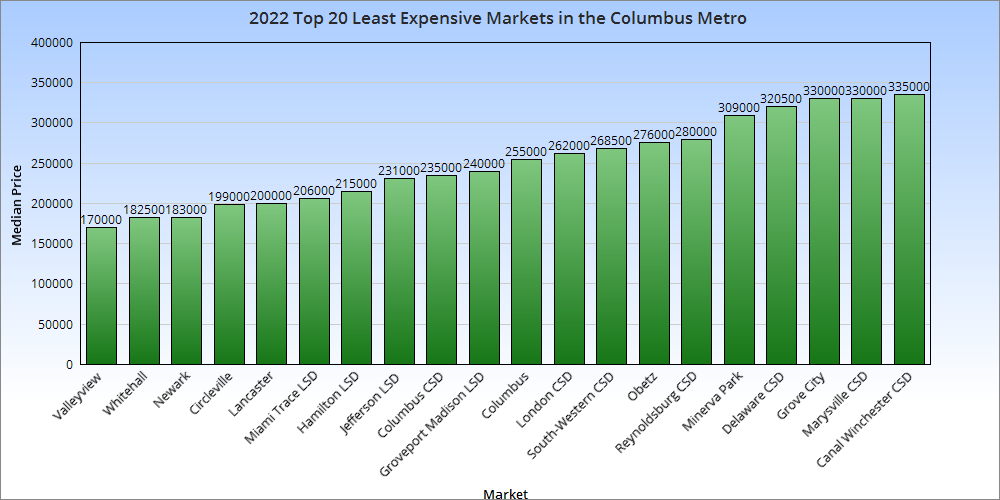
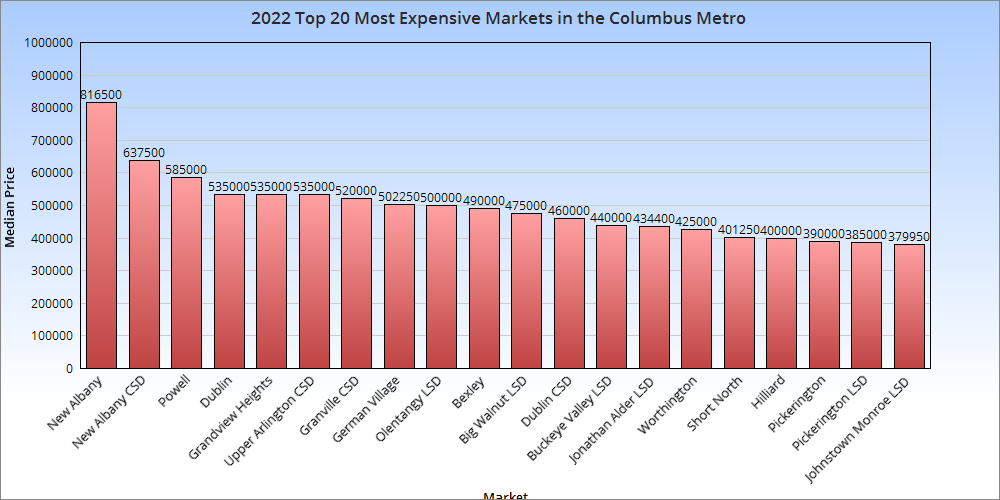
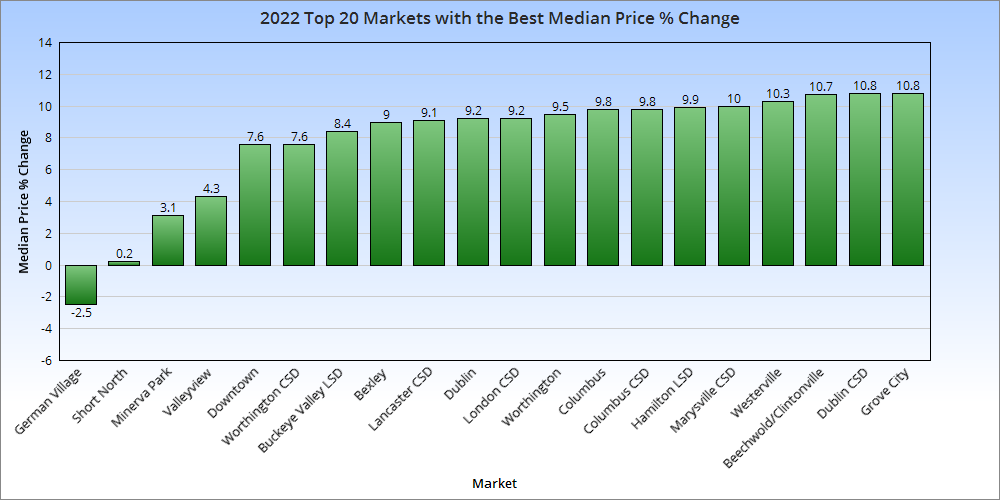
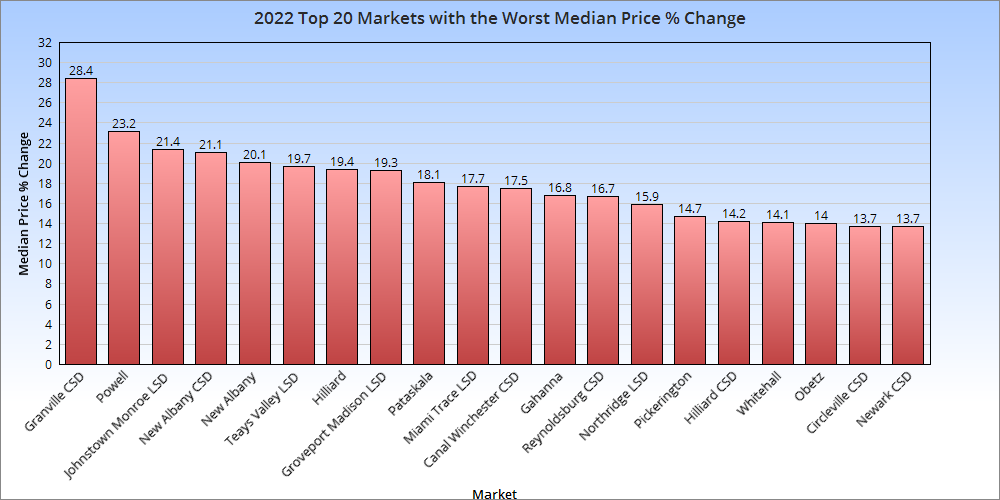
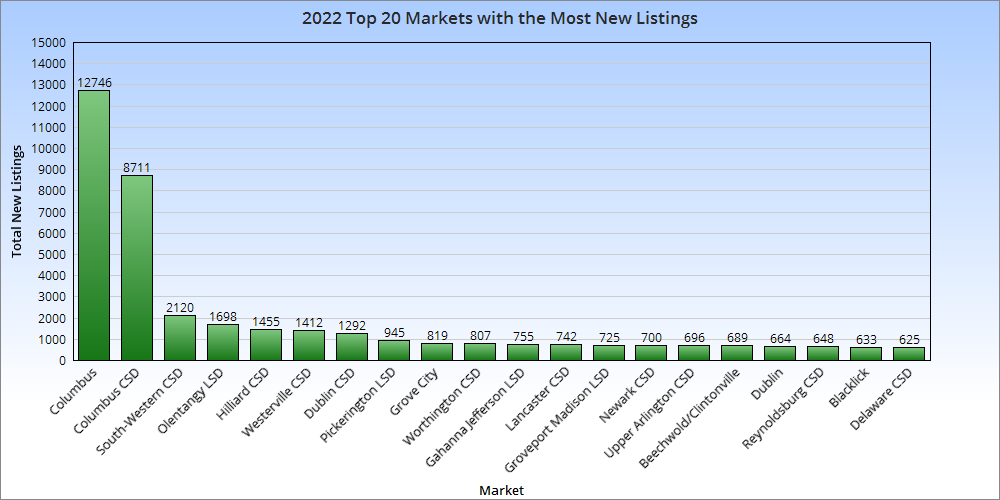
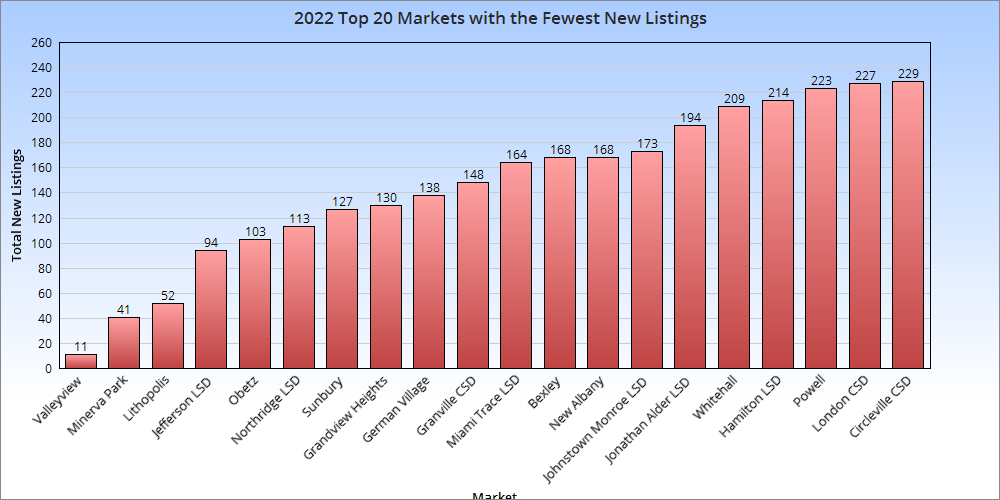
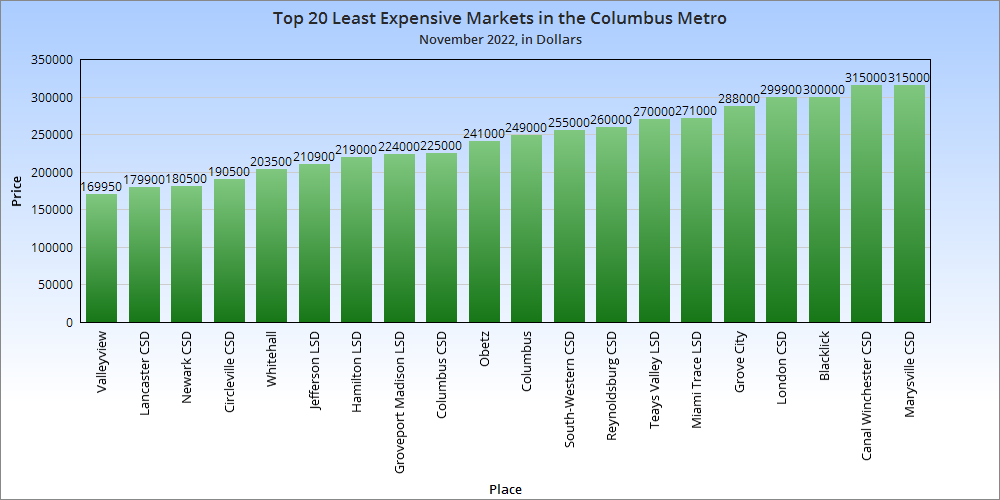
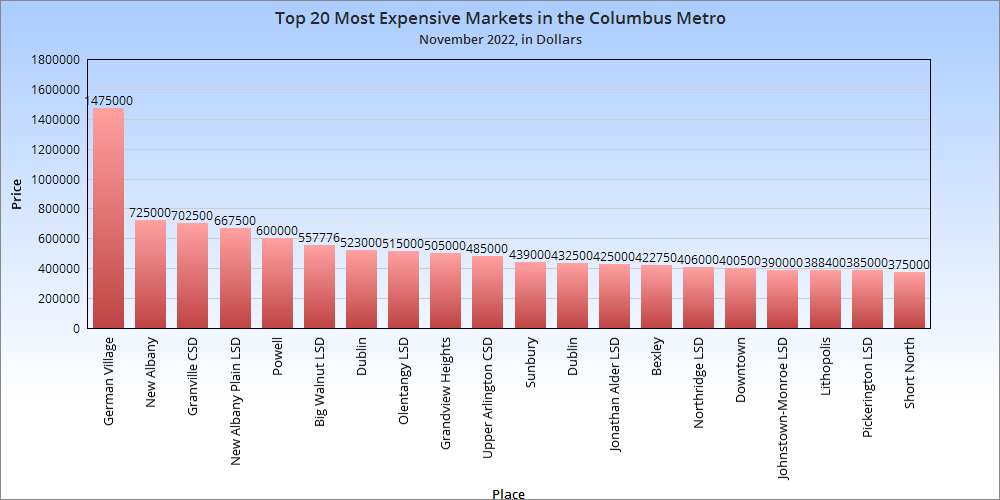
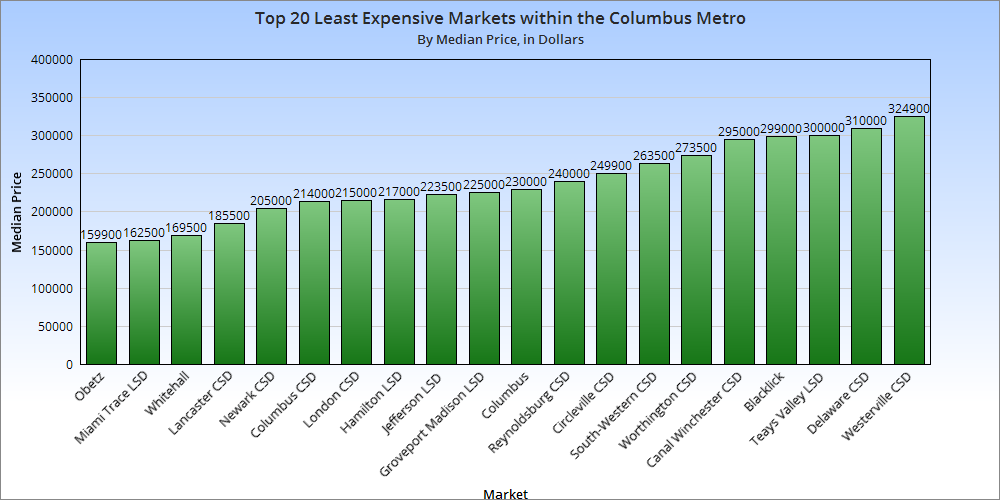
Note: LSD= Local School District, CSD= City School District. In both cases, school district boundaries differ from city boundaries.
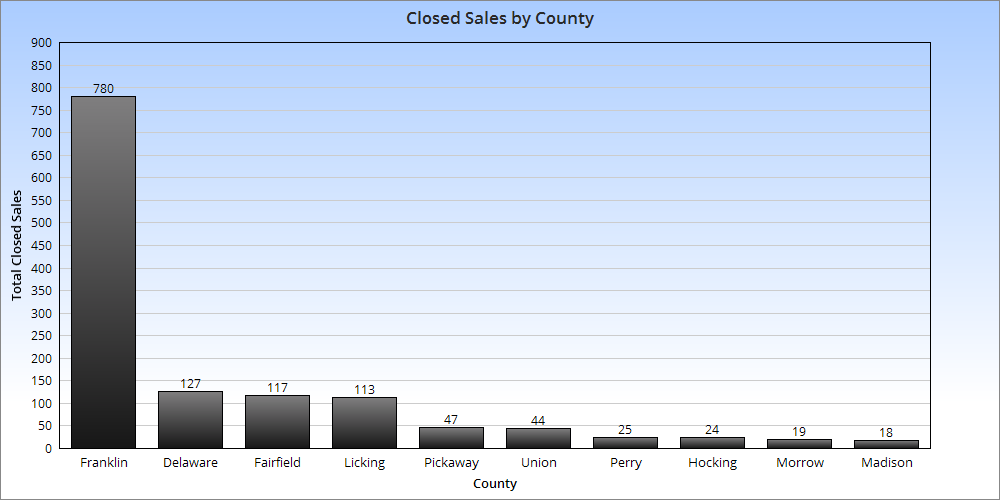
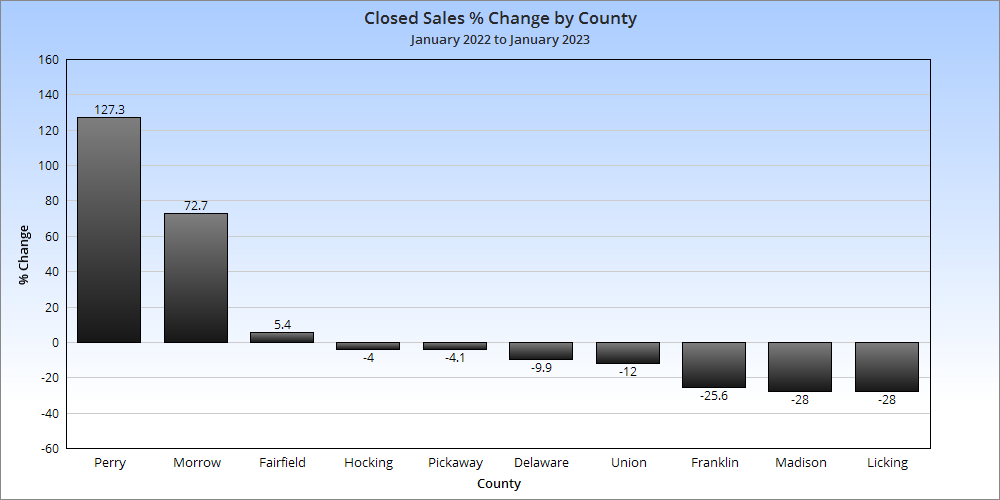
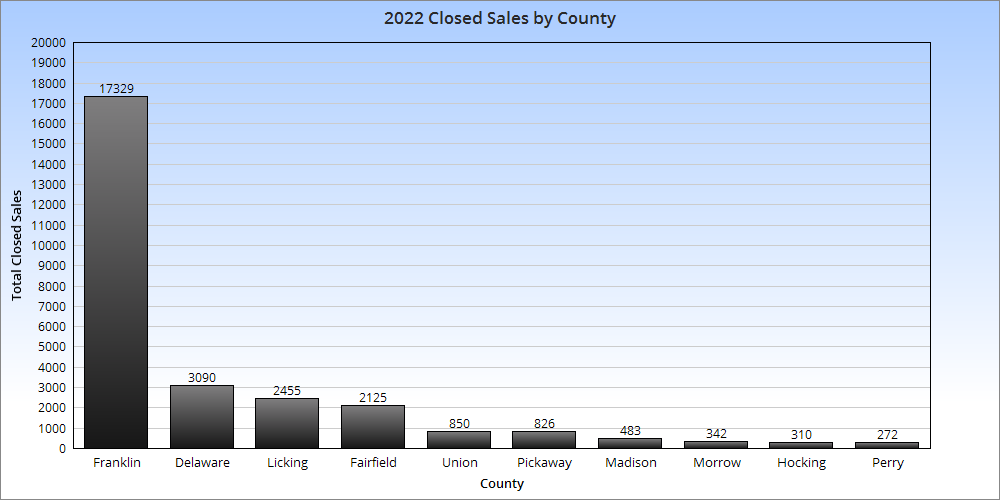
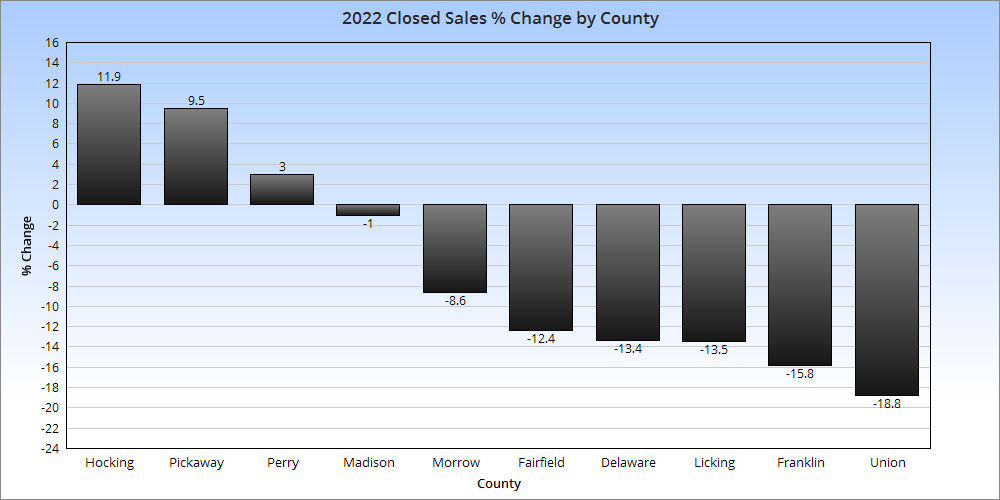
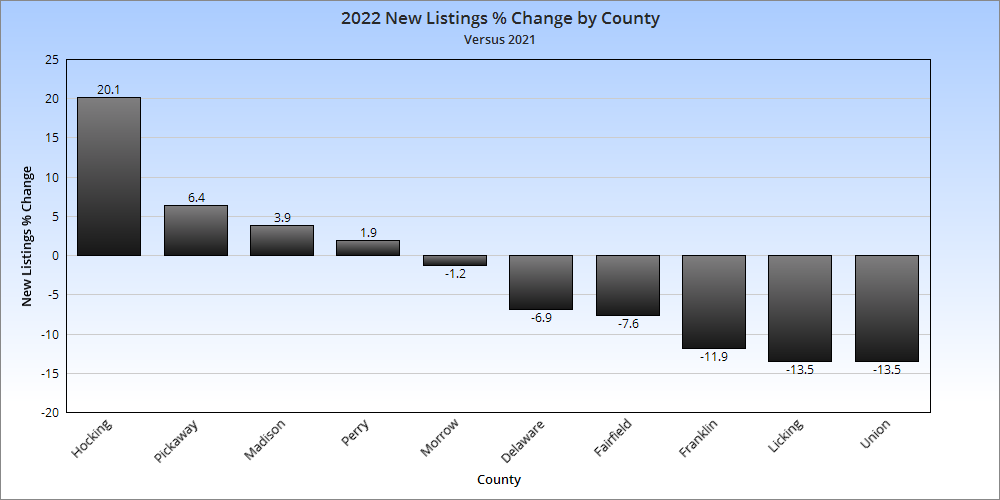
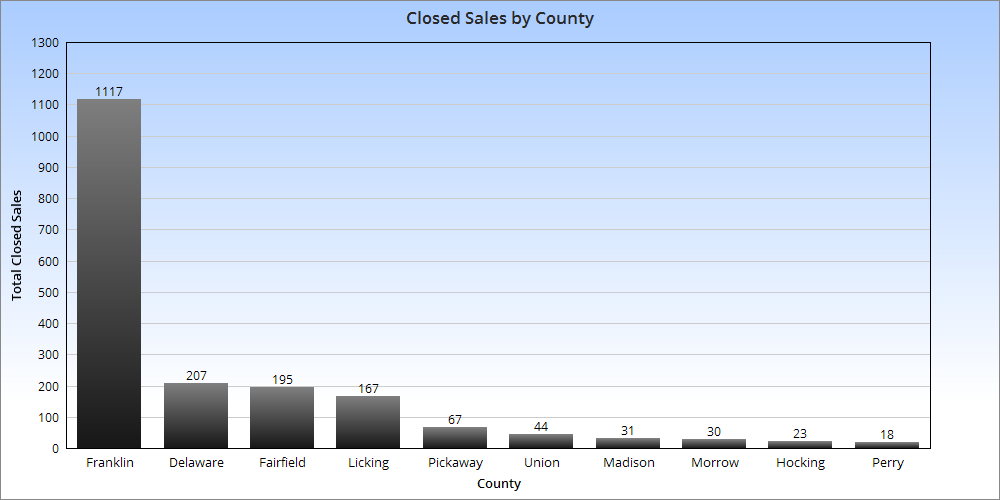
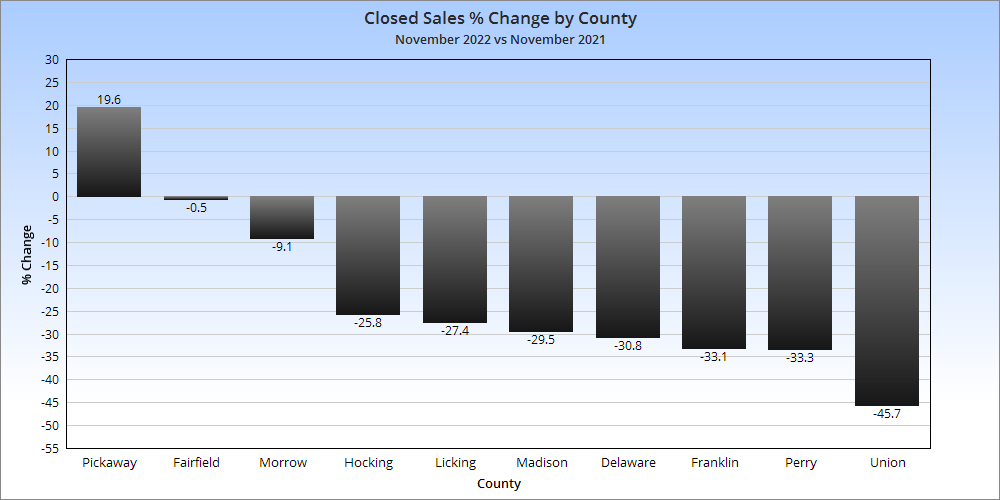
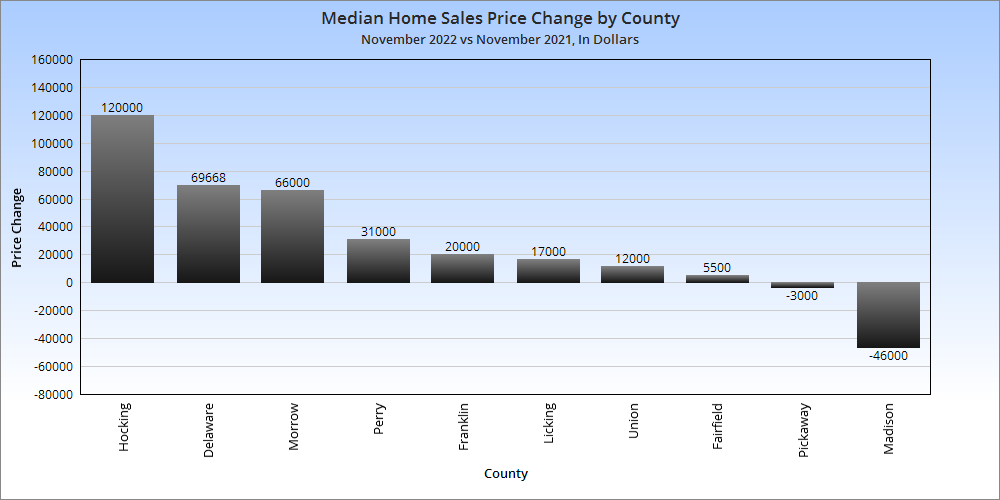
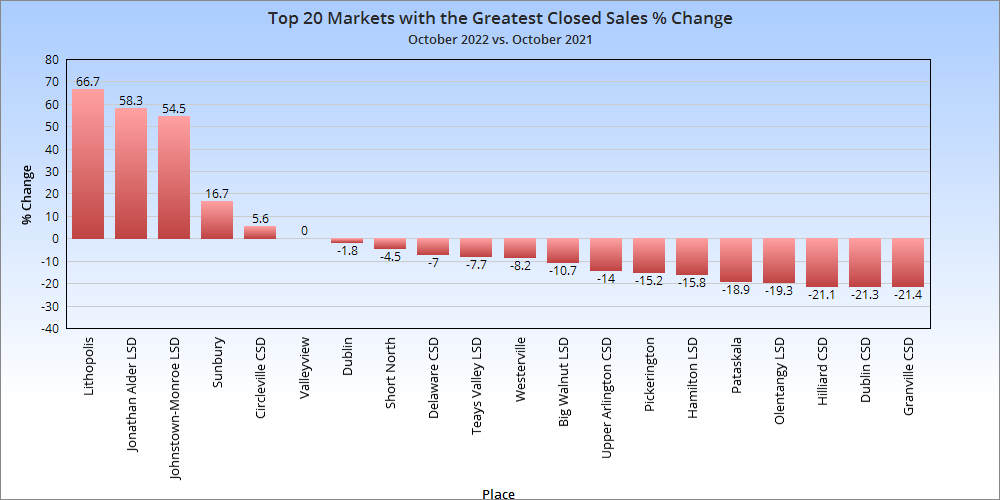
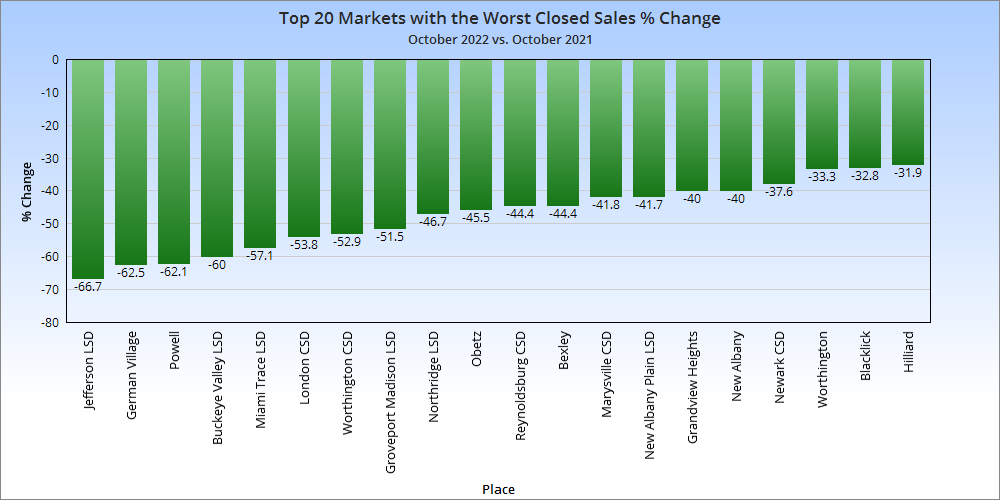
Closed sales are those sales that were completed during the month. 7 of the 10 metro counties saw declines in January
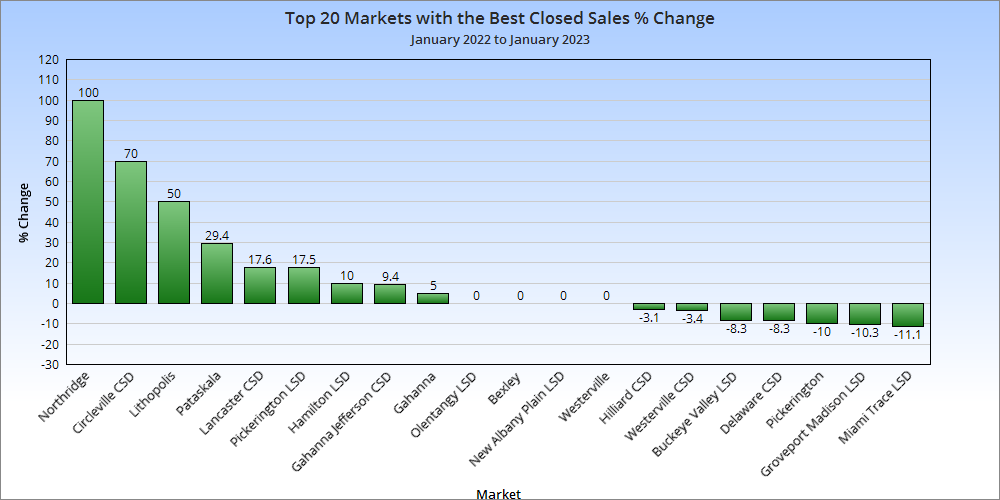
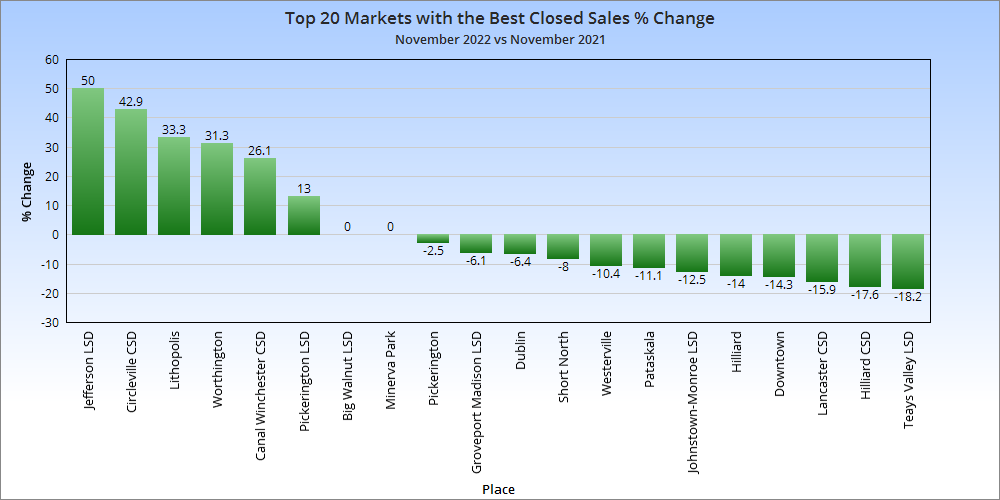
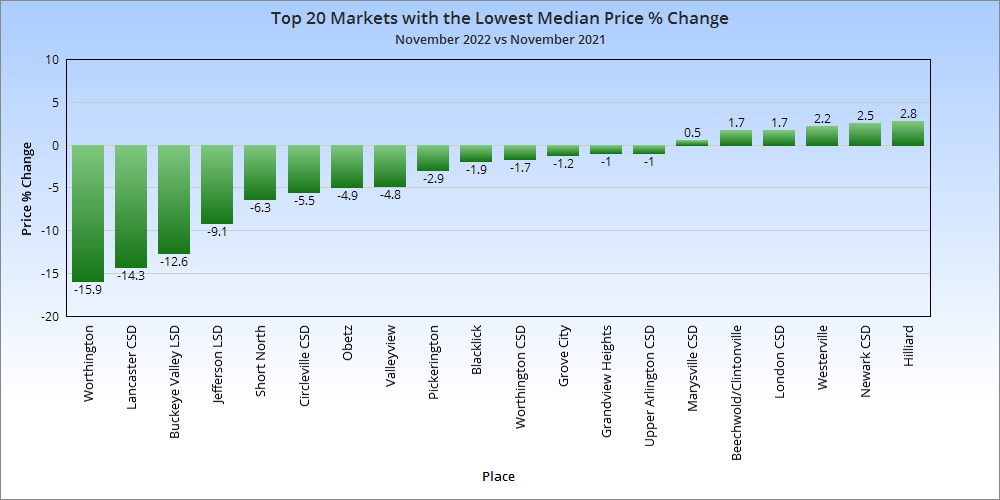
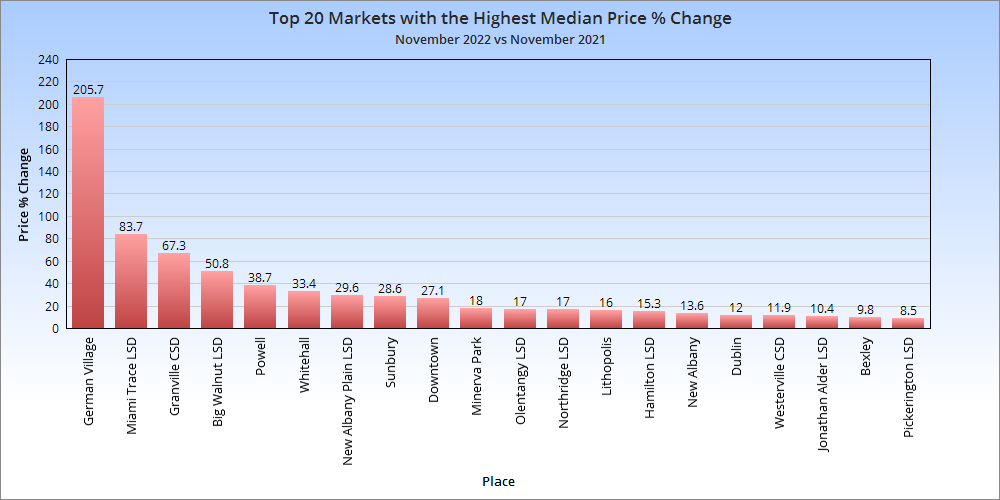
Only 9 of more than 40 local markets were up year-over-year.
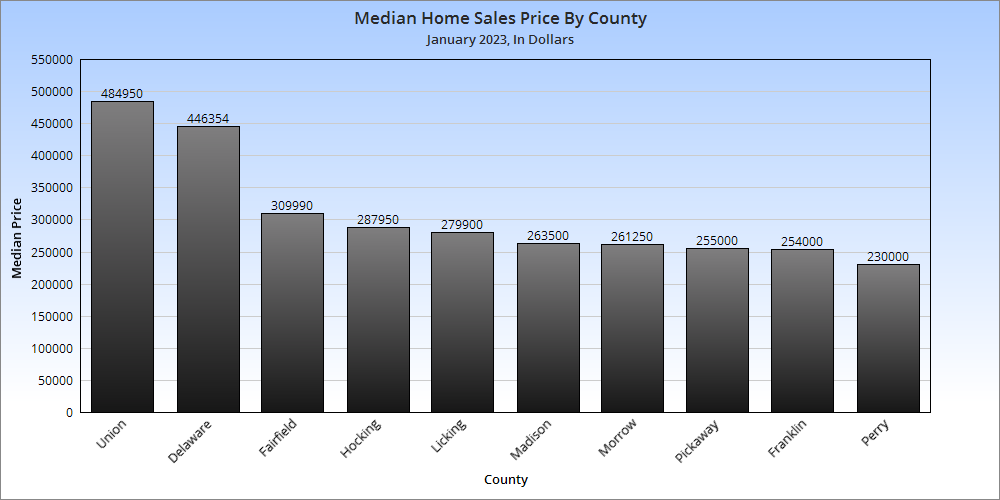
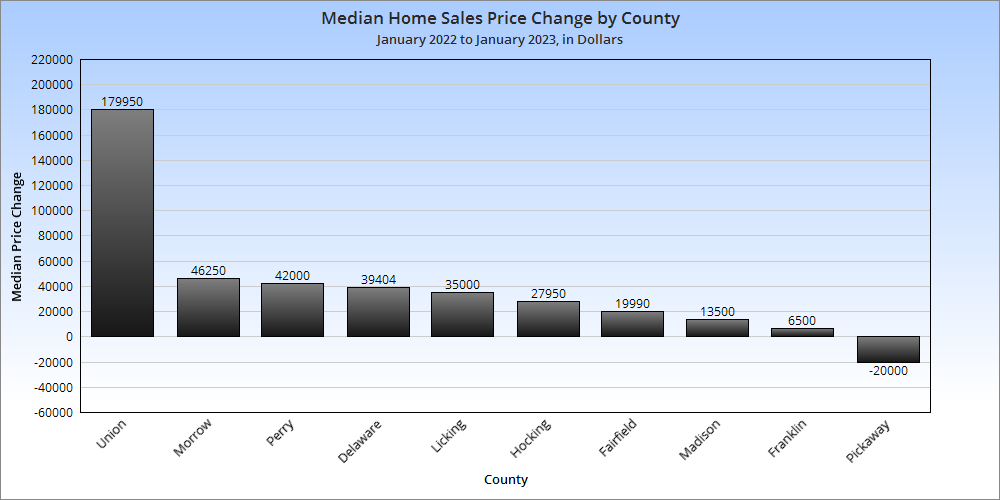
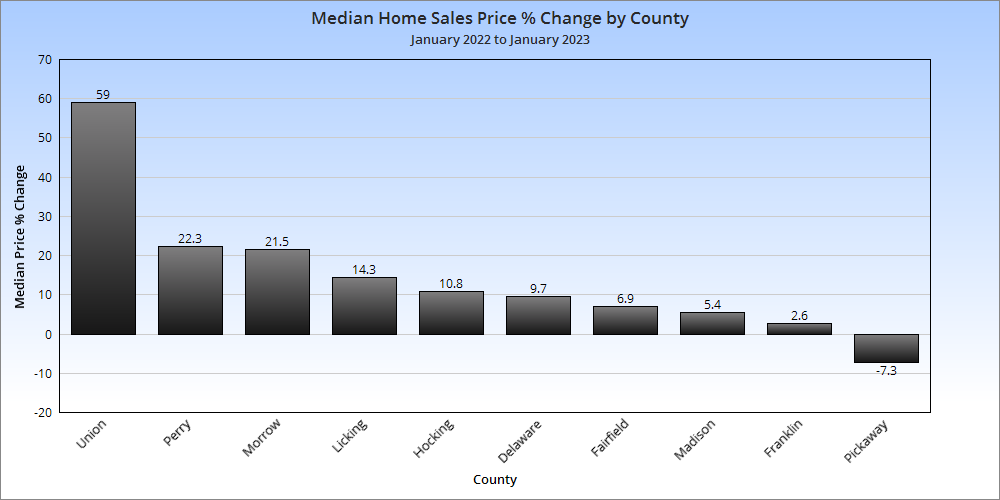
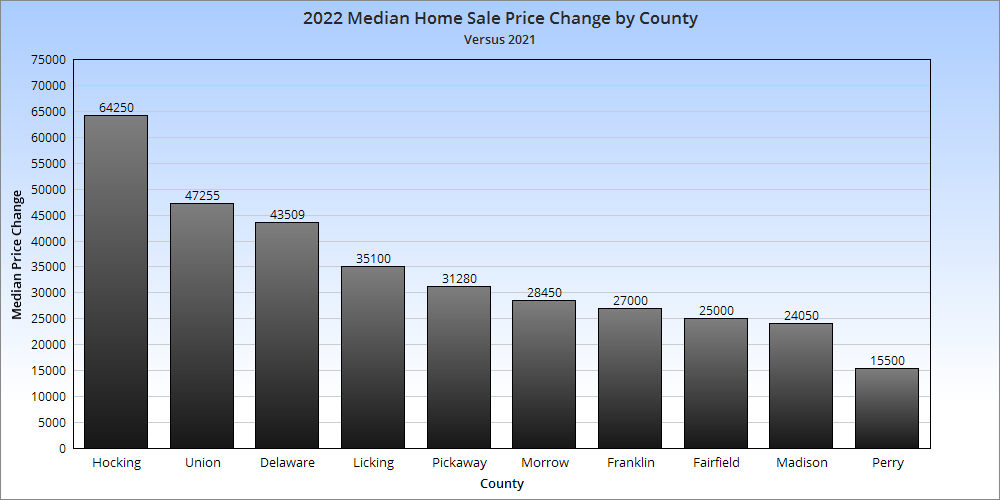
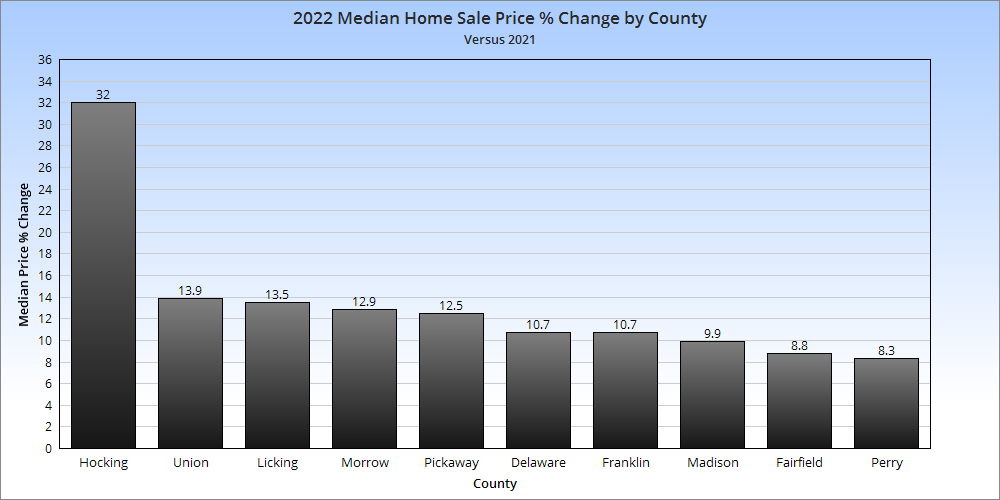
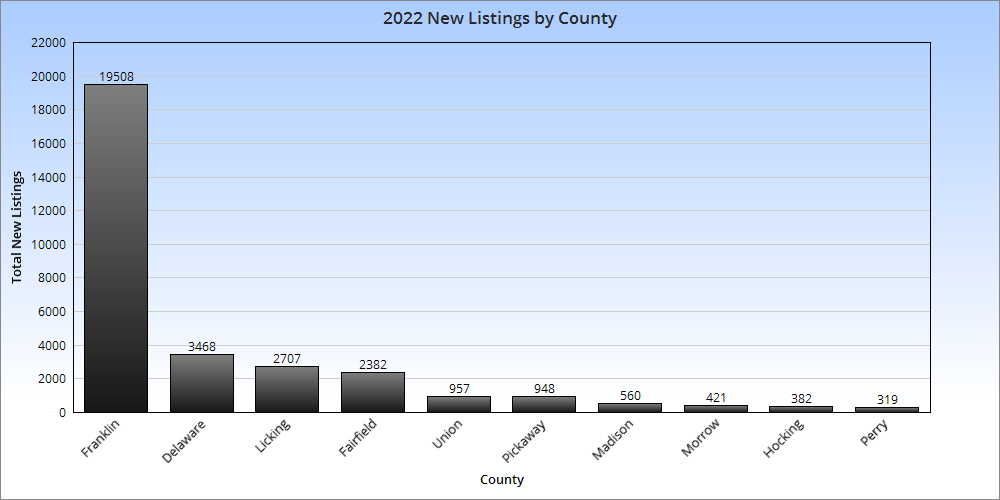
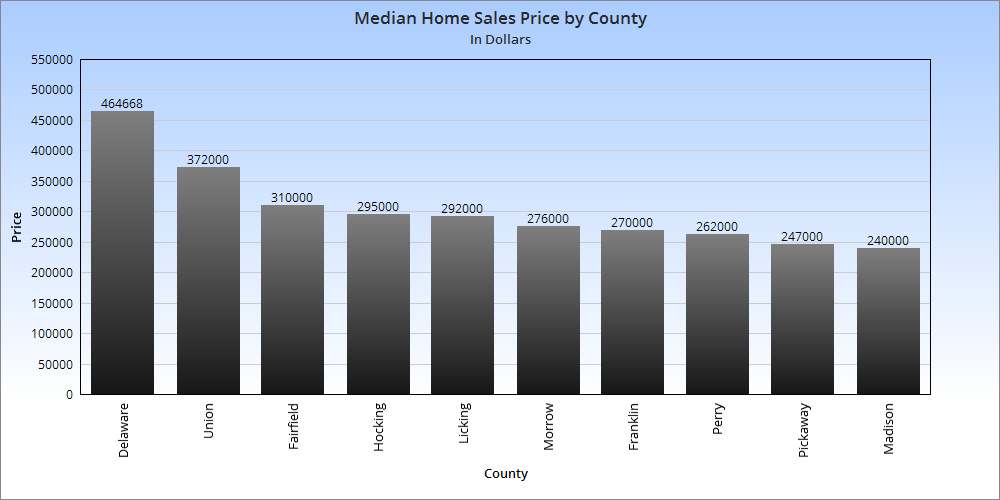
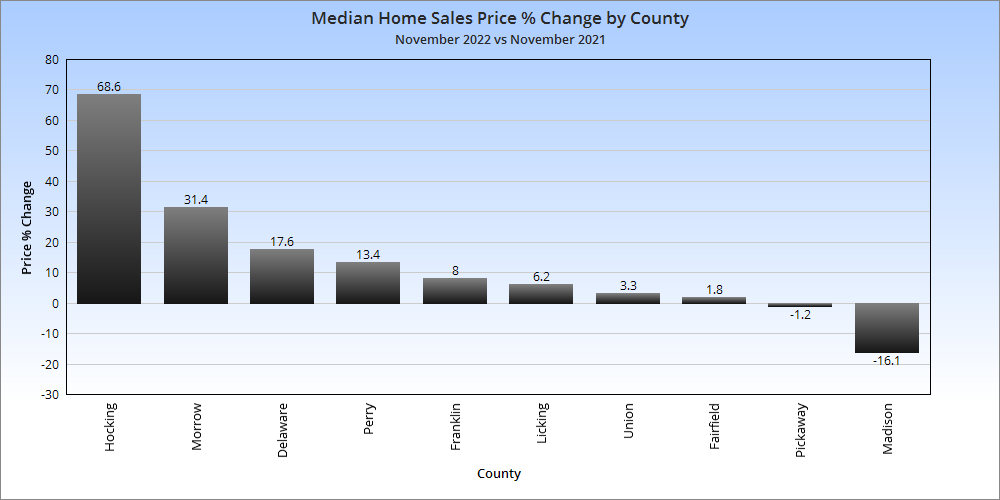
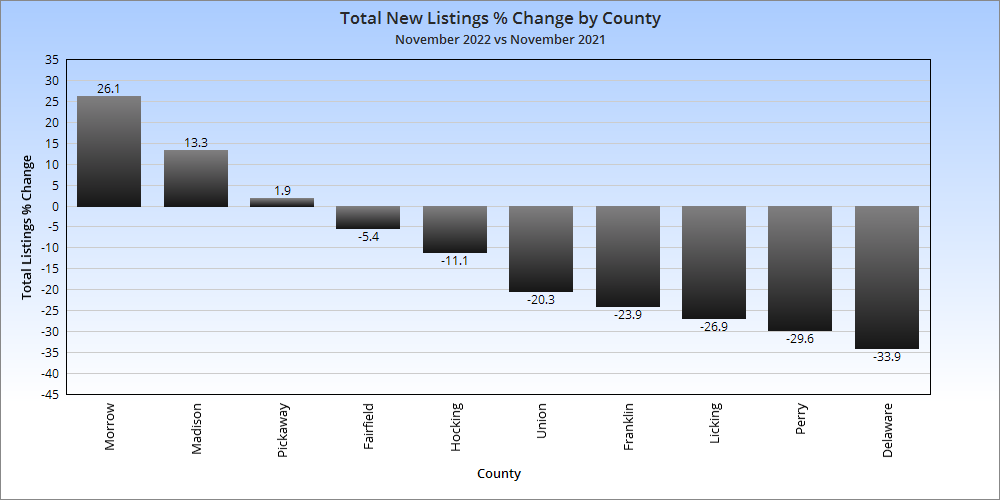
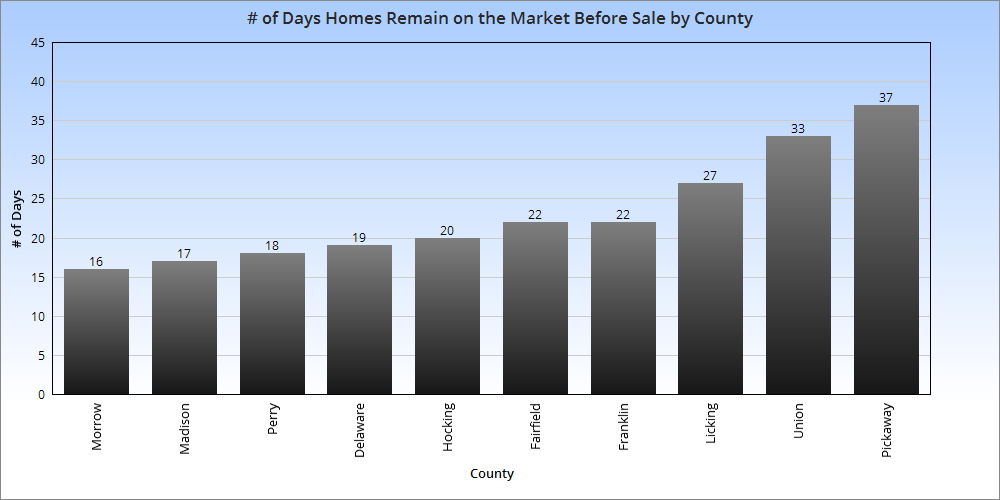
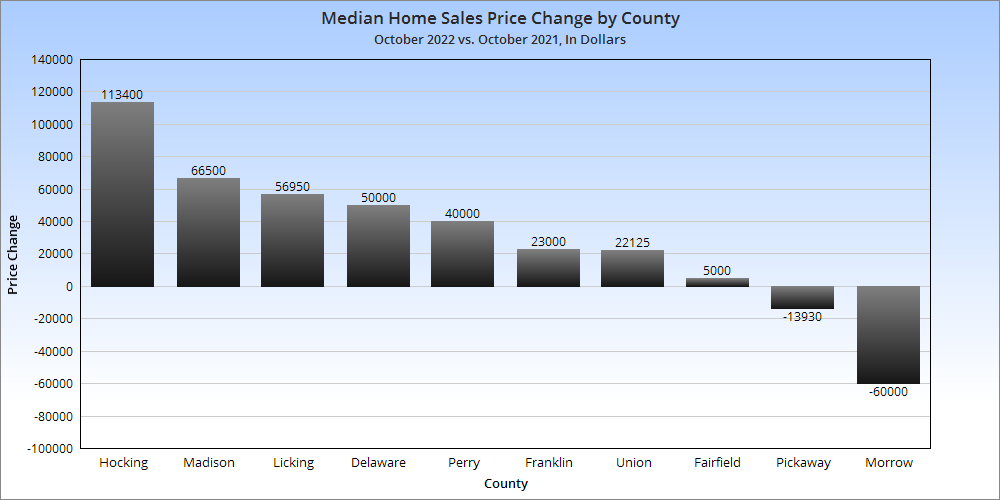
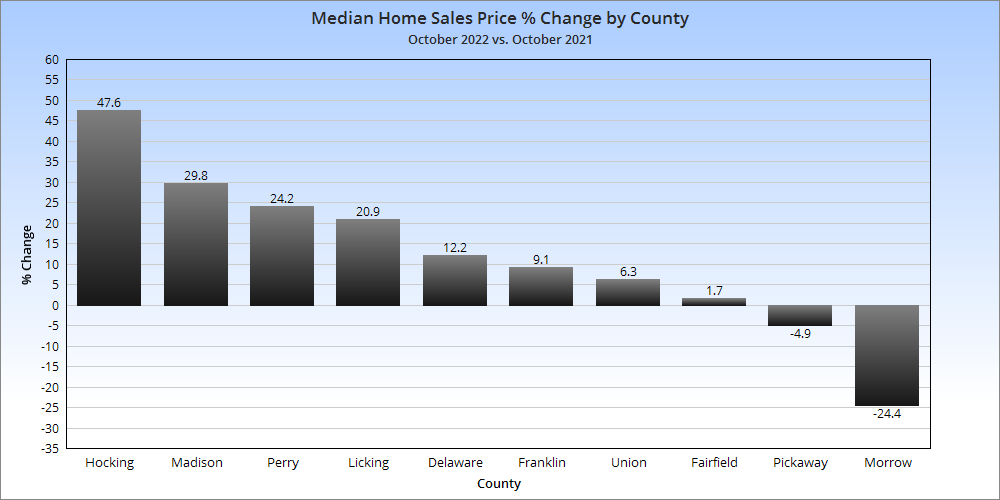
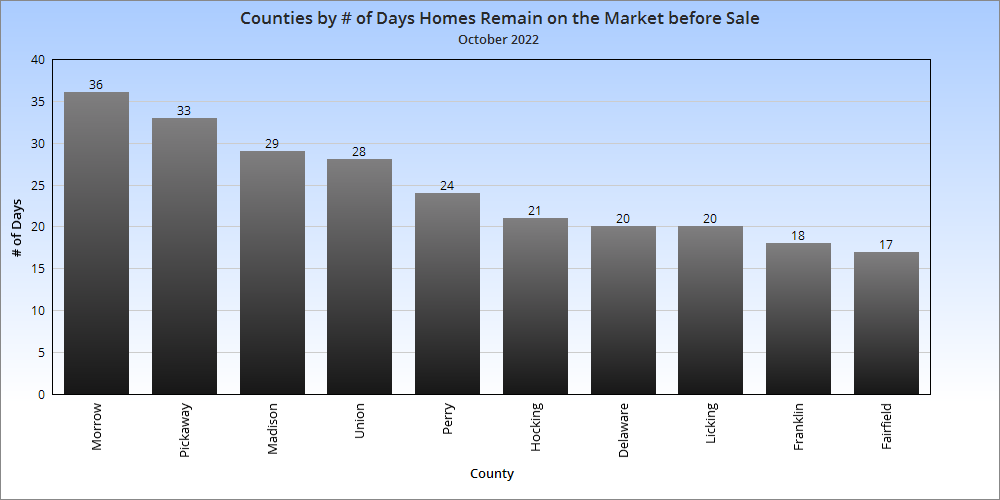
Not sure what was going on in Union County in January, but it was well above all other counties for the month. The market overall continued to be up on price year-over-year, except in Pickaway County.
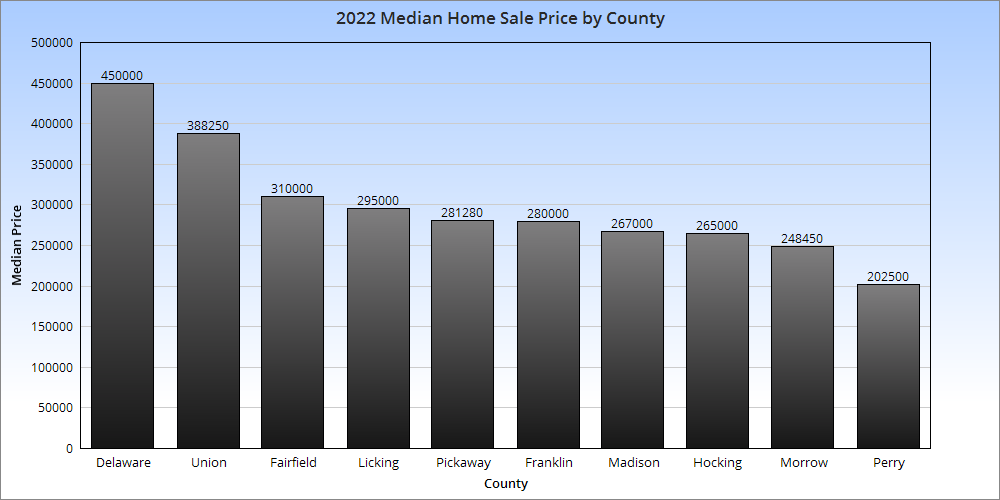
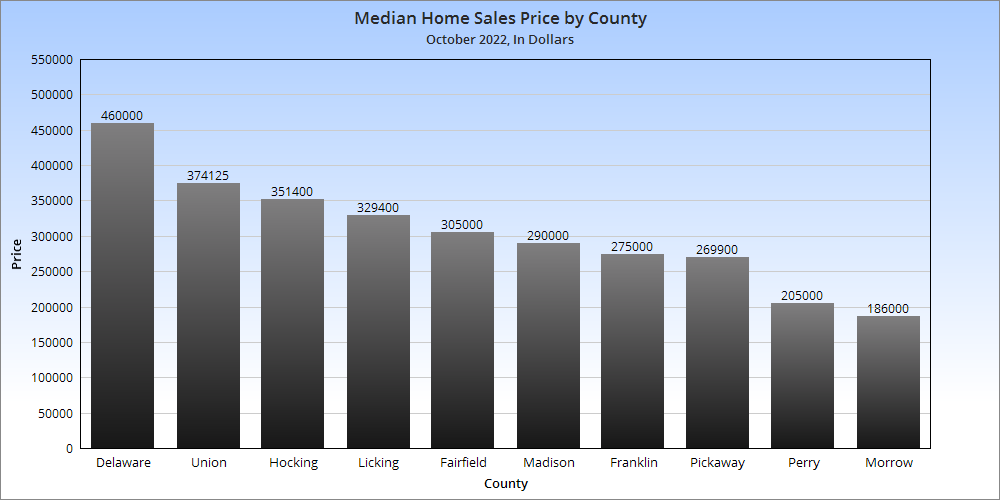
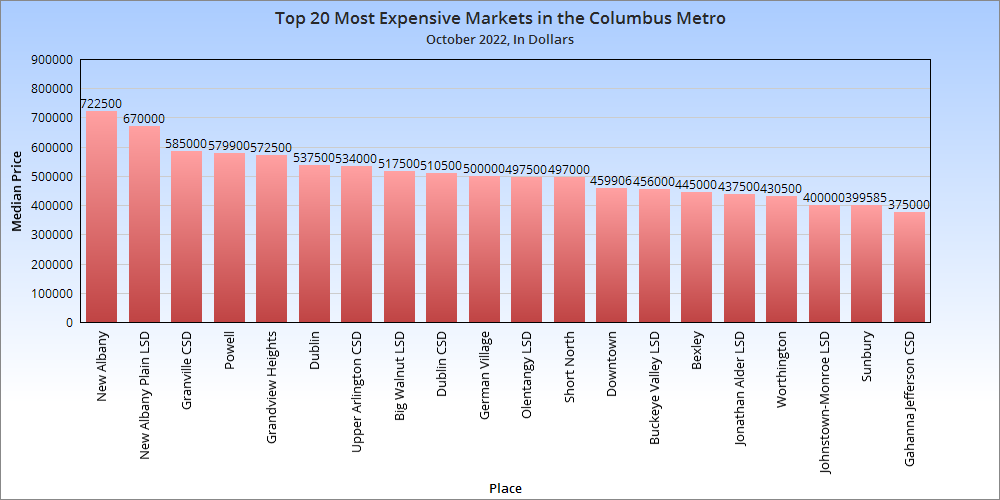
Overall Market Median Sales Price in January 2023: $307,289
Based on the 10 Columbus Metro Area counties, the metro price saw a more than $39,000 increase over January, 2022.
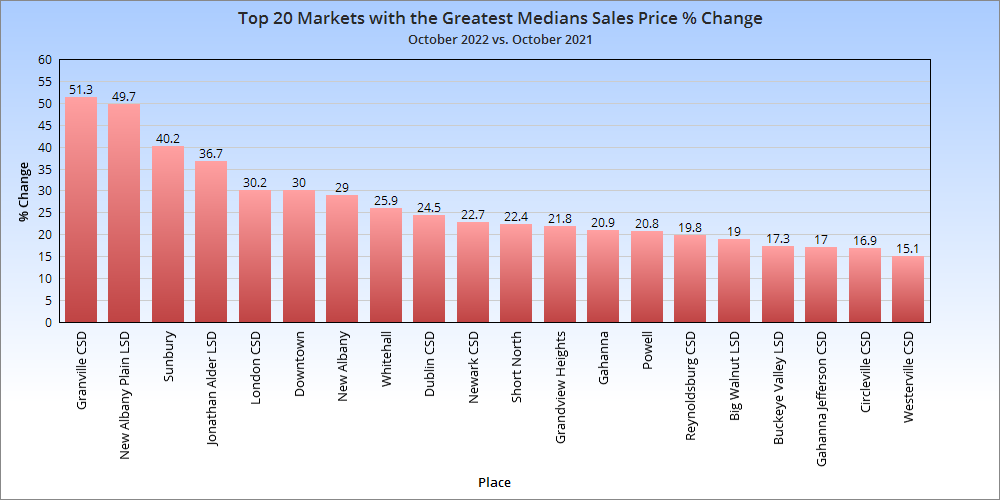
Overall Market Median Sales Price % Change in January, 2023 vs. January, 2022: +14.6%
Continuing home sale declines had relatively little impact on home prices overall, which saw a strong increase over the year.
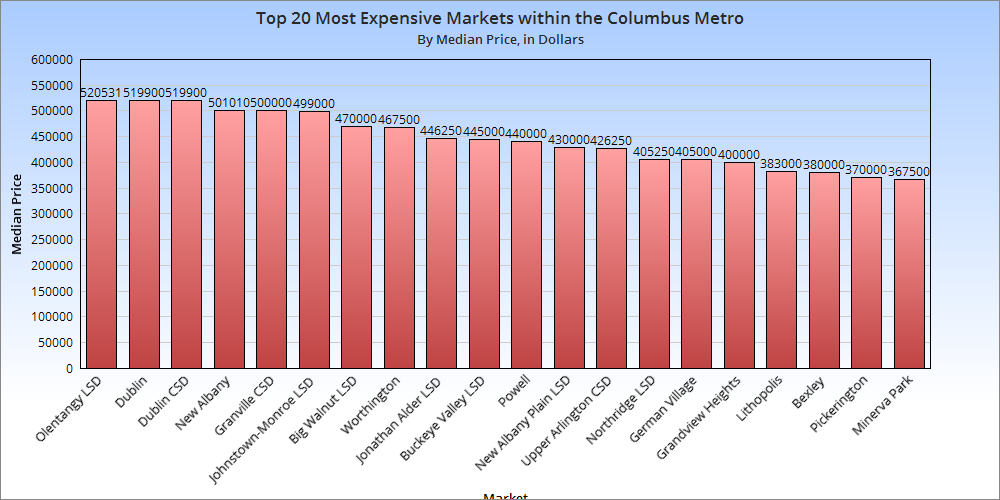
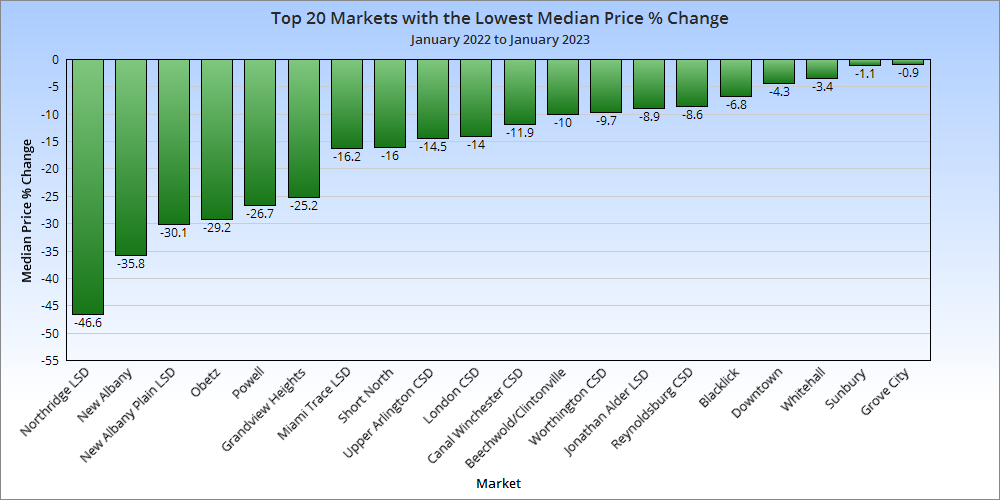
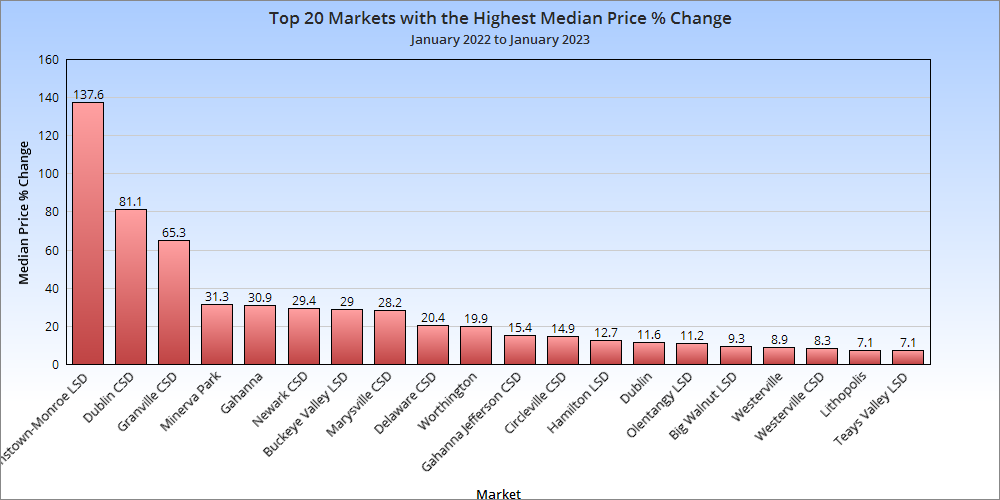
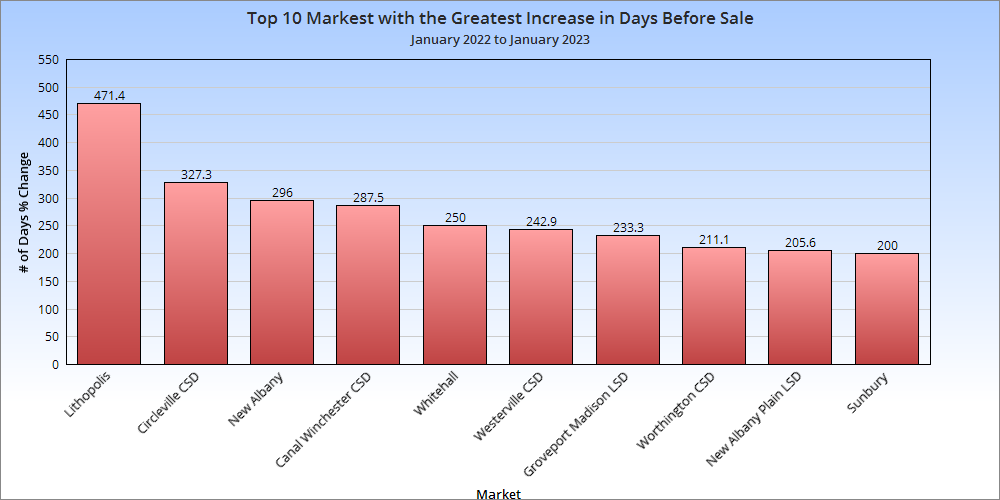
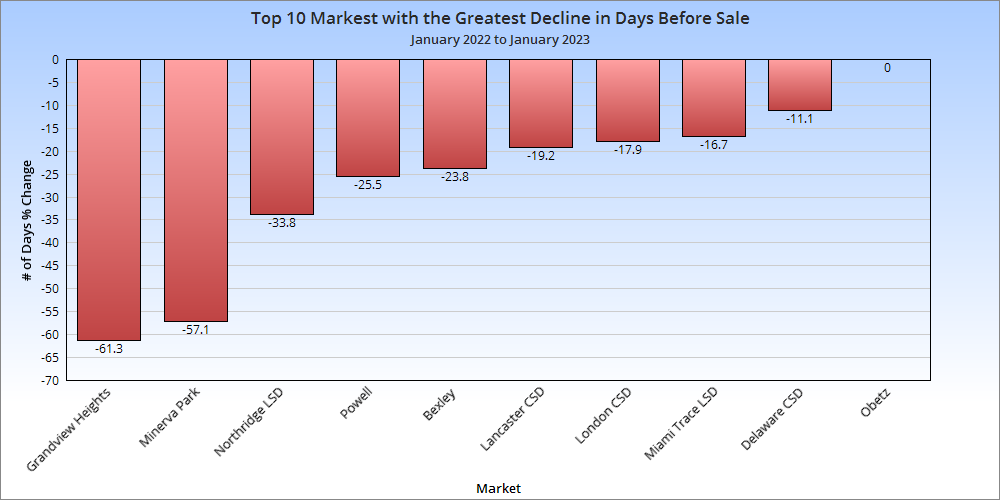
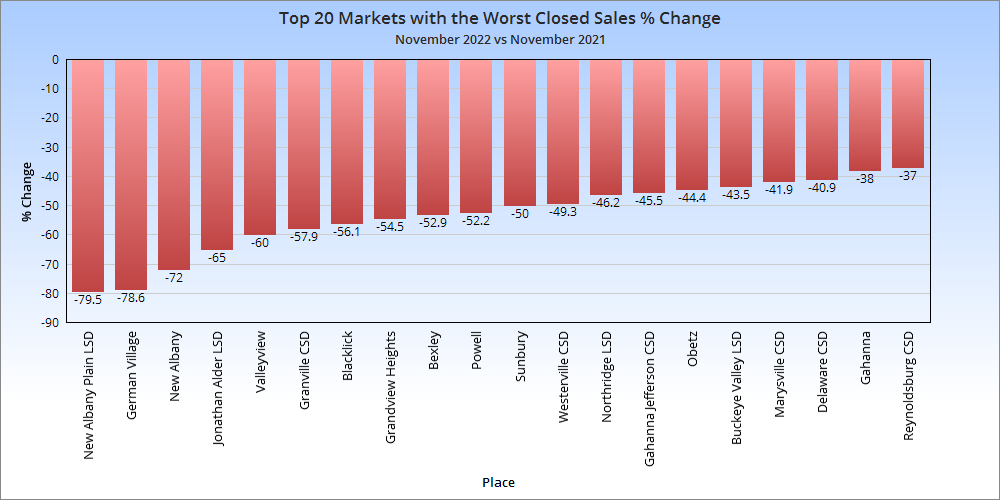
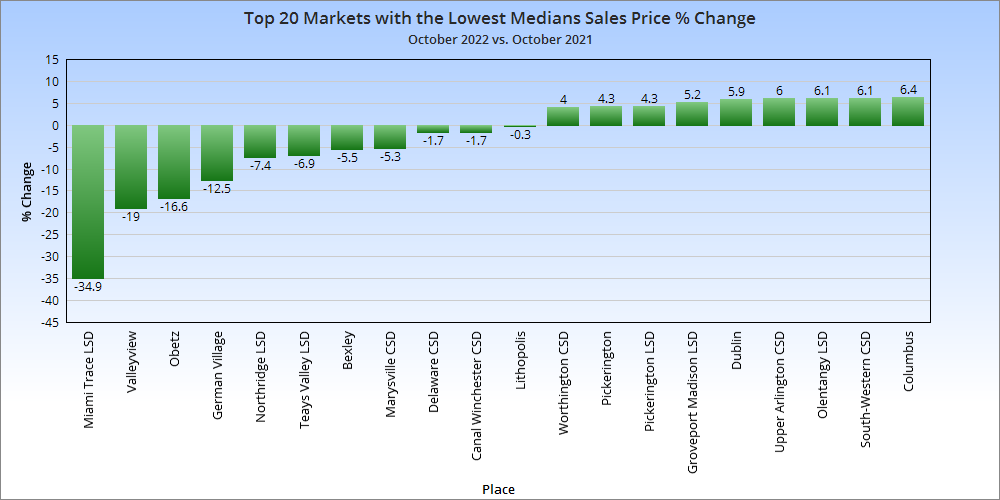
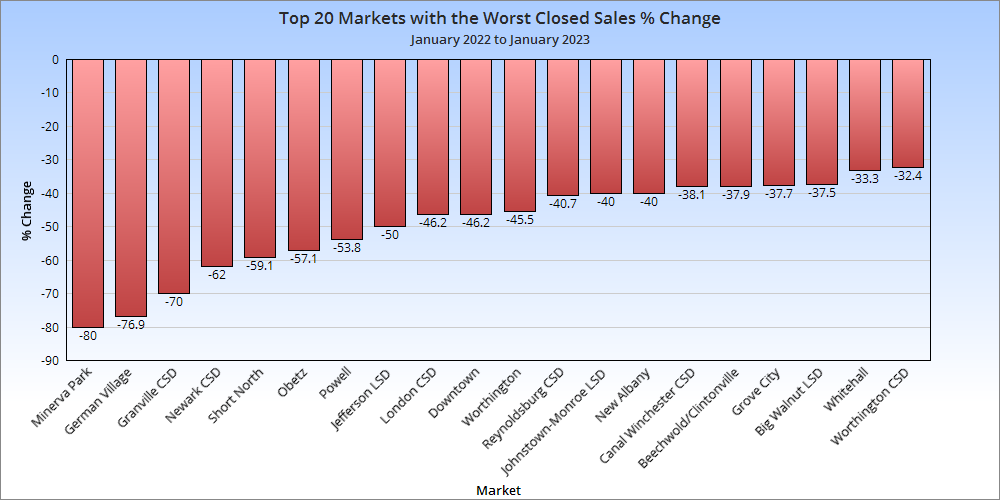
It seems the Intel project’s impact may finally be making an appearance in housing numbers, with the Johnstown district seeing a huge increase in median home prices versus January 2022, 2 months before the project became official. That said, New Albany had one of the areas largest declines, but that could be due to it generally being one of the most expensive markets last year.
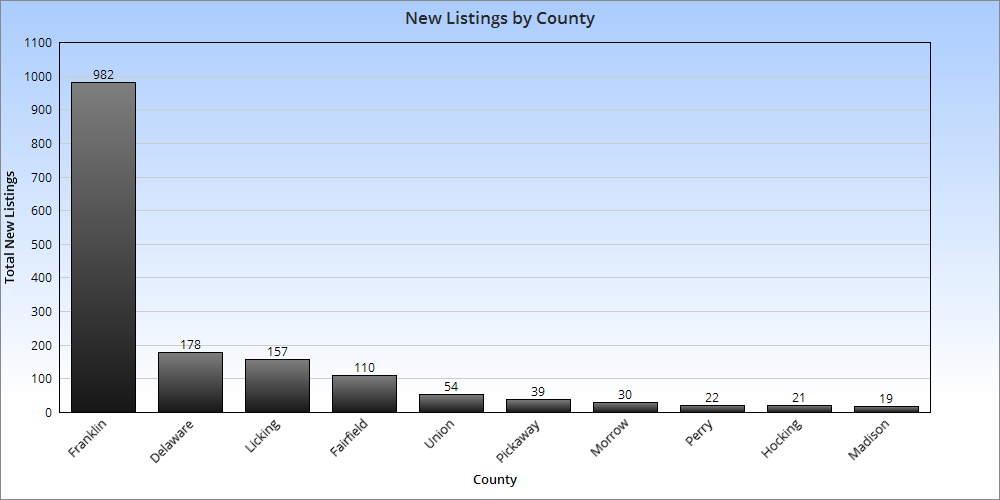
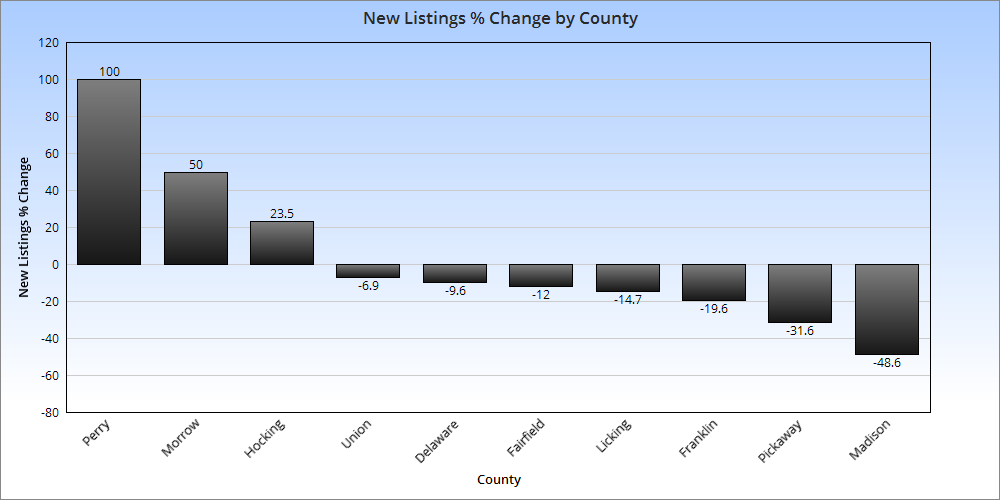
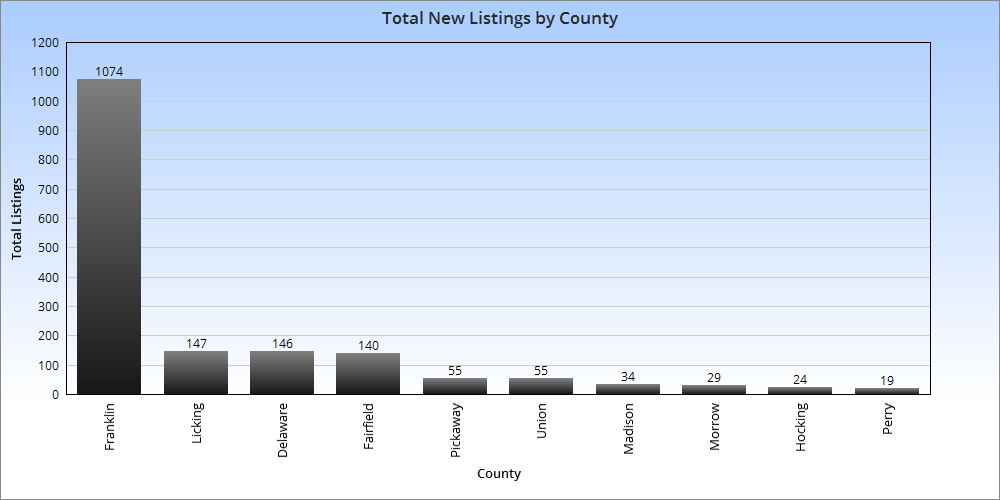
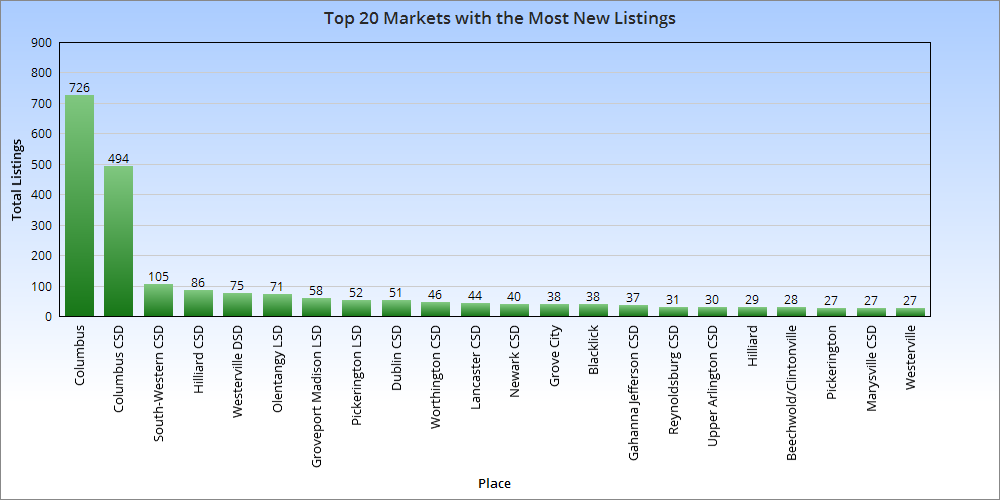
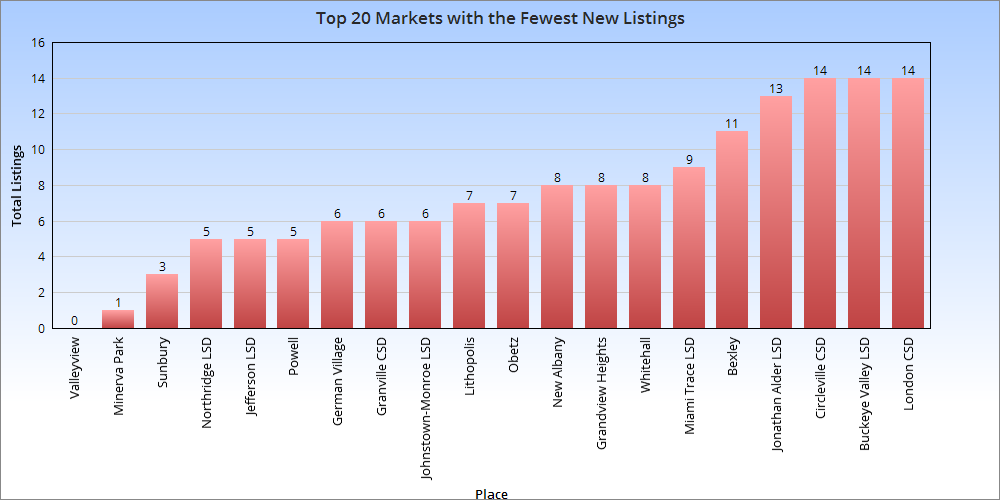
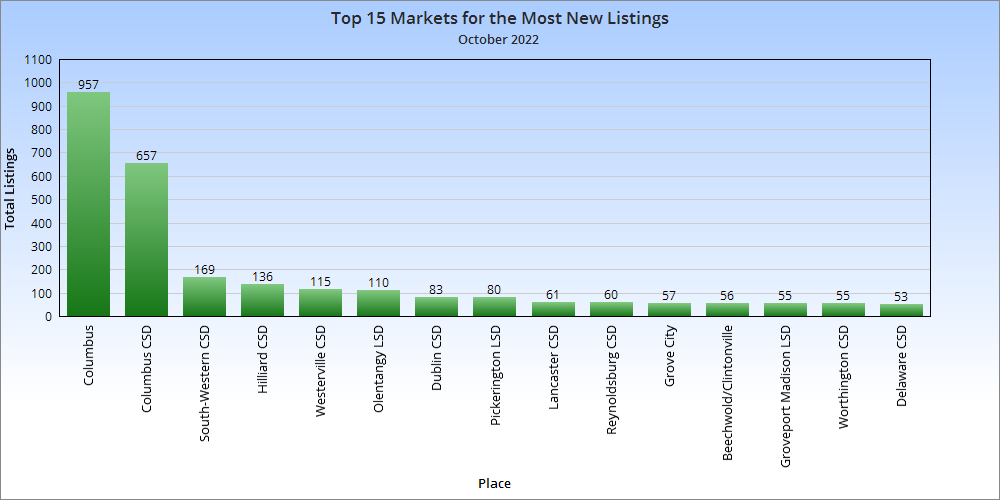
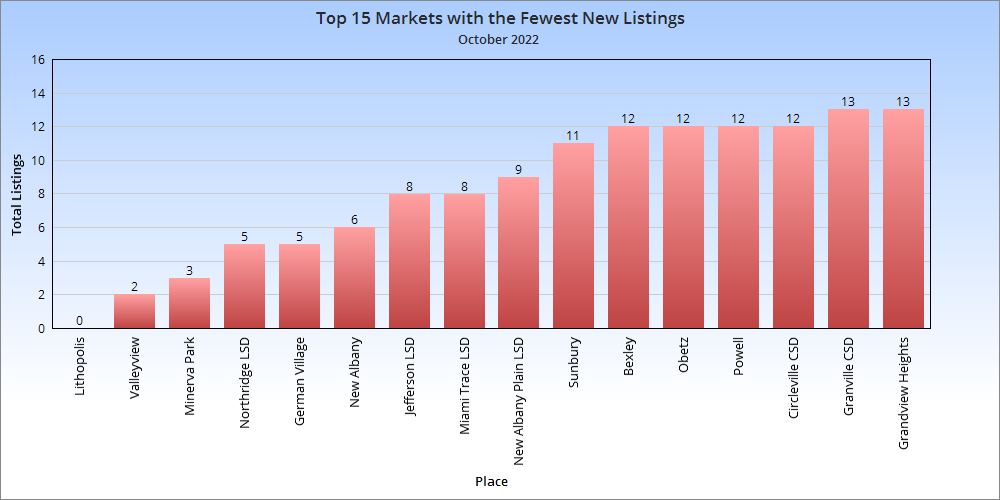
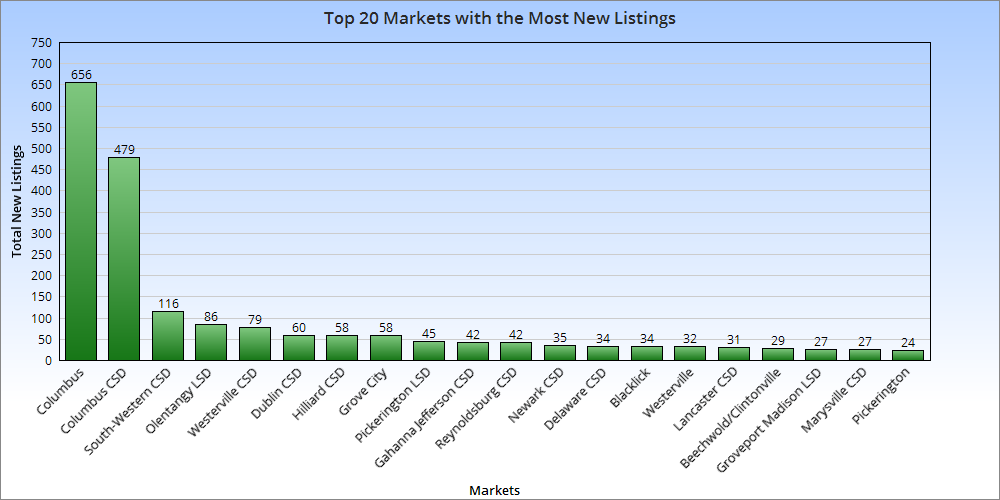
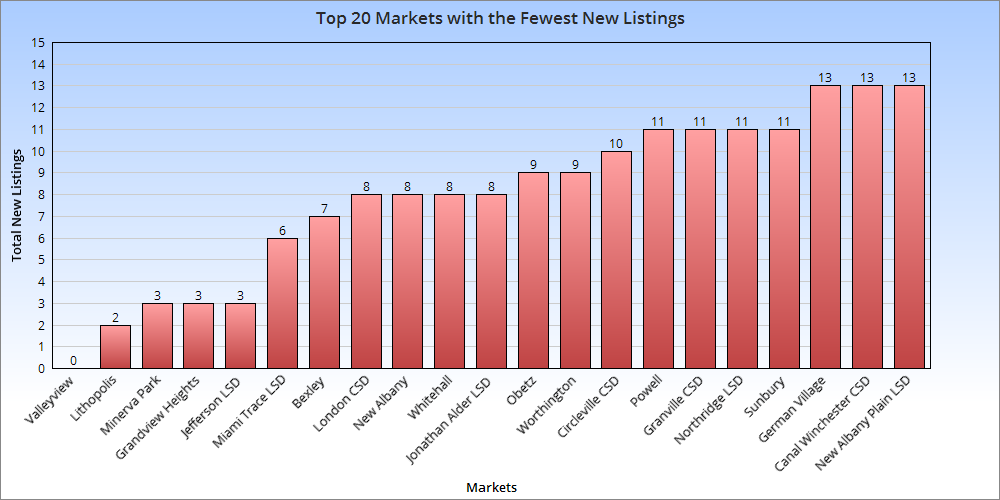
New listings across most of the metro area were down, accounting for most of the median price increase as demand remains strong in the region. Most of the decrease came from Franklin County.
Total Metro New Listings in January, 2023: 1,612
Total Metro New Listings Change from January, 2022 to January, 2023: -316
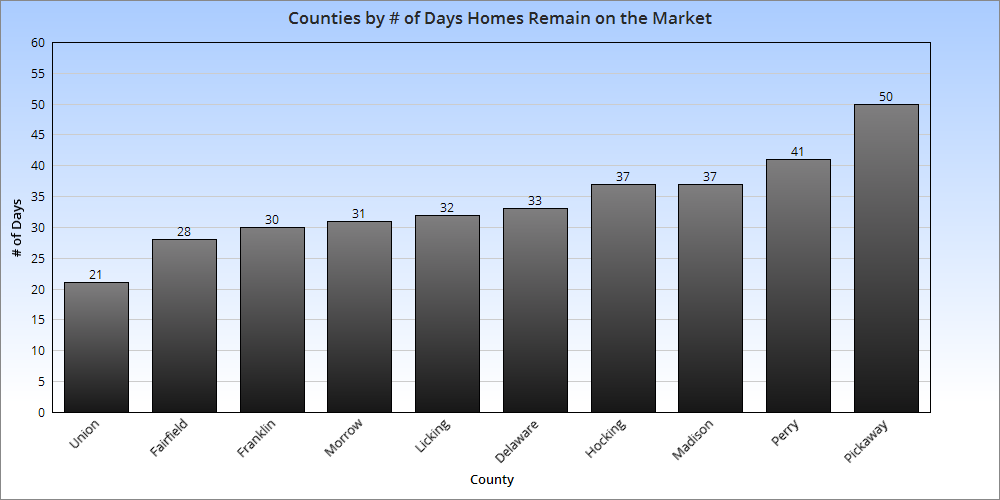
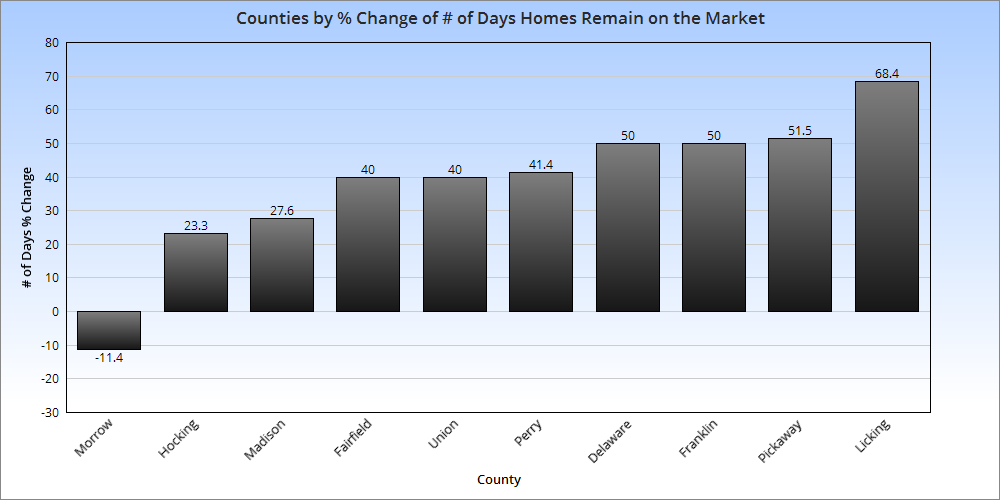
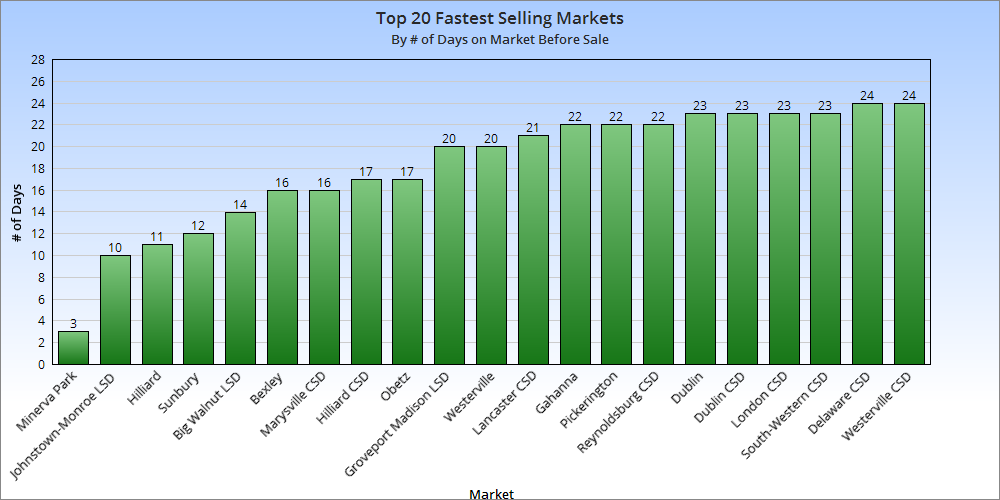
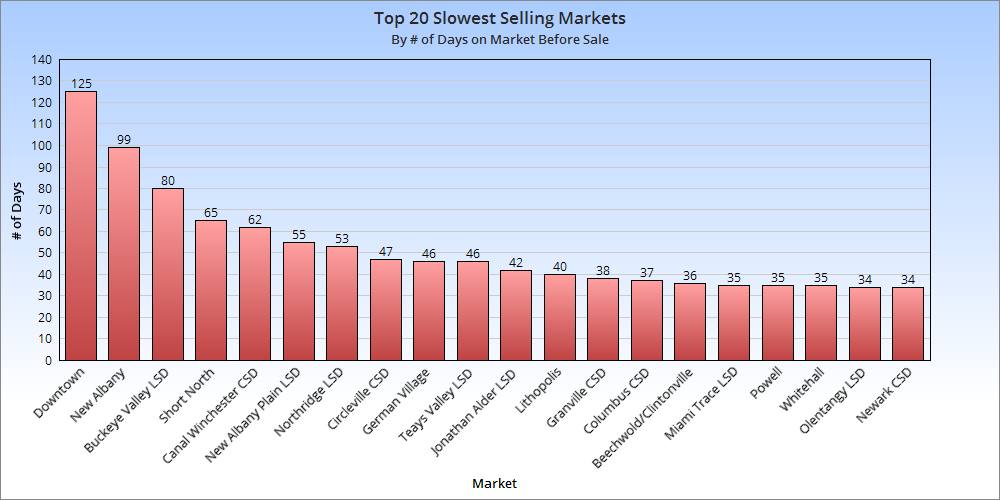
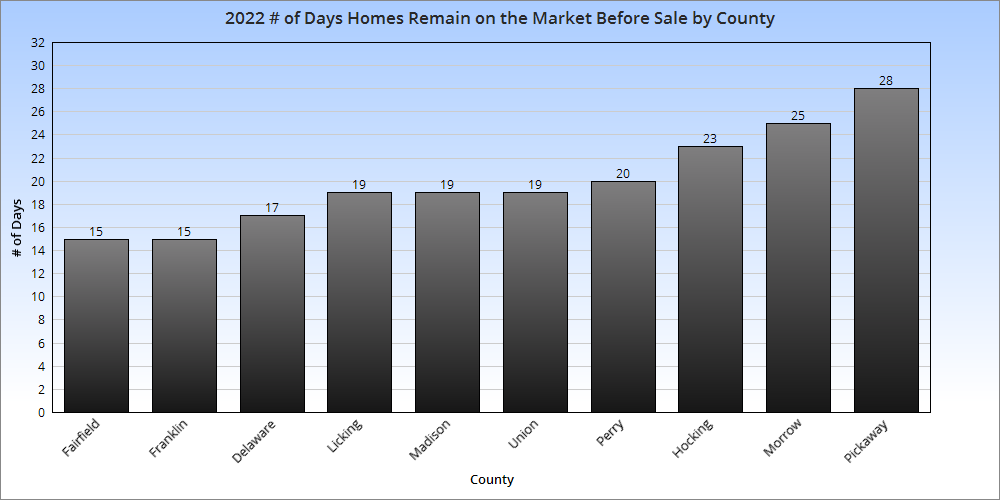
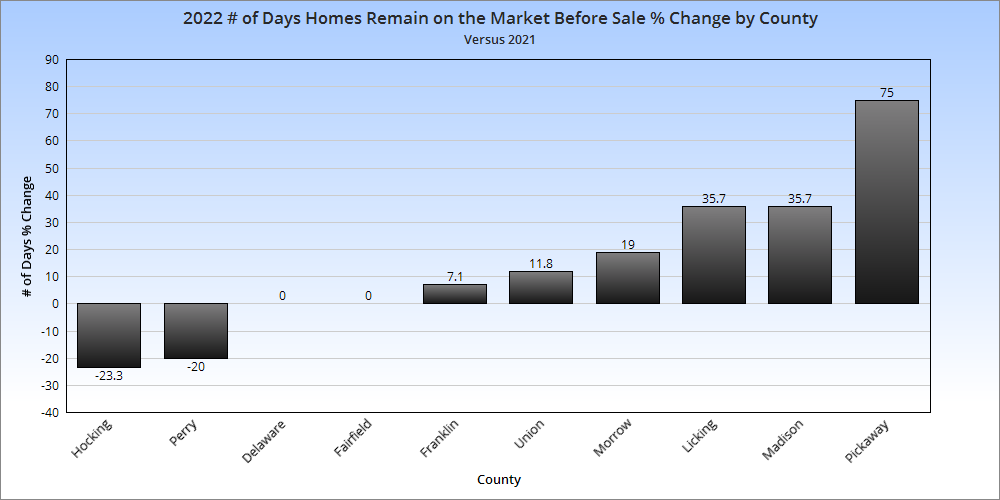
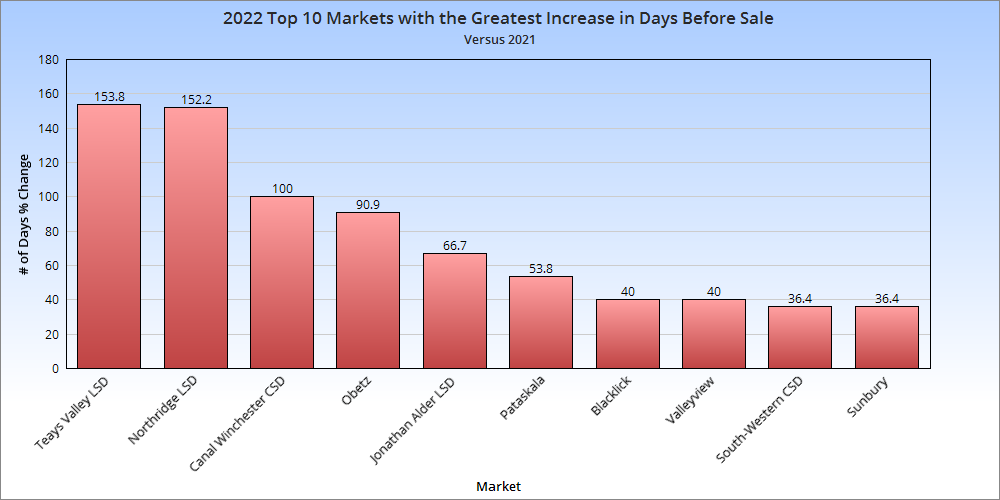
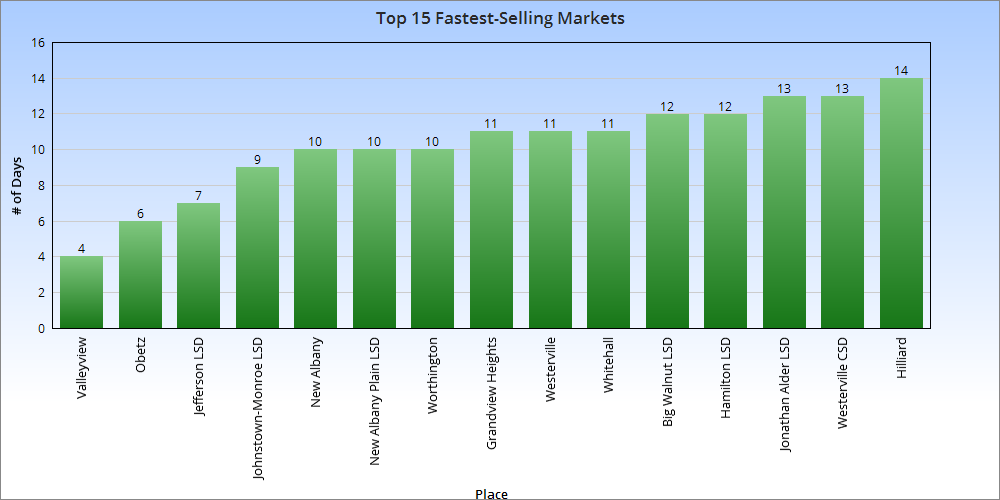
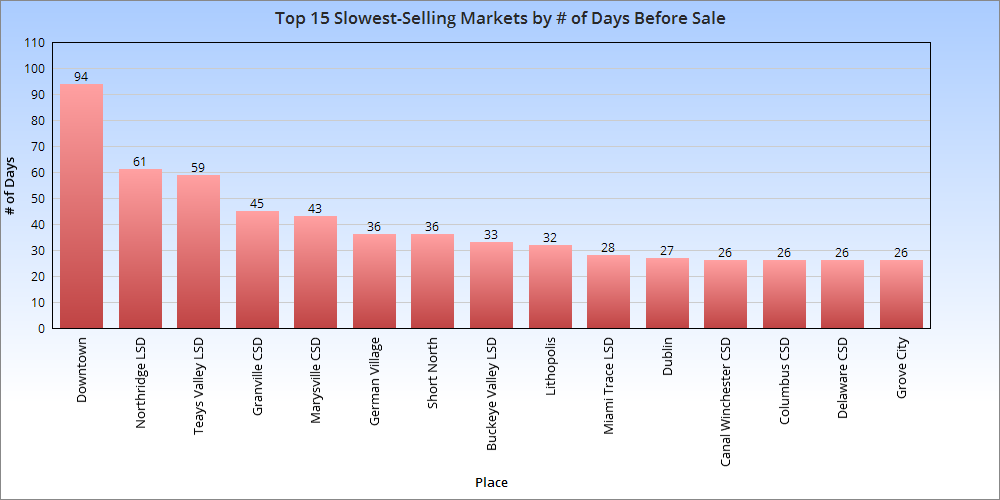
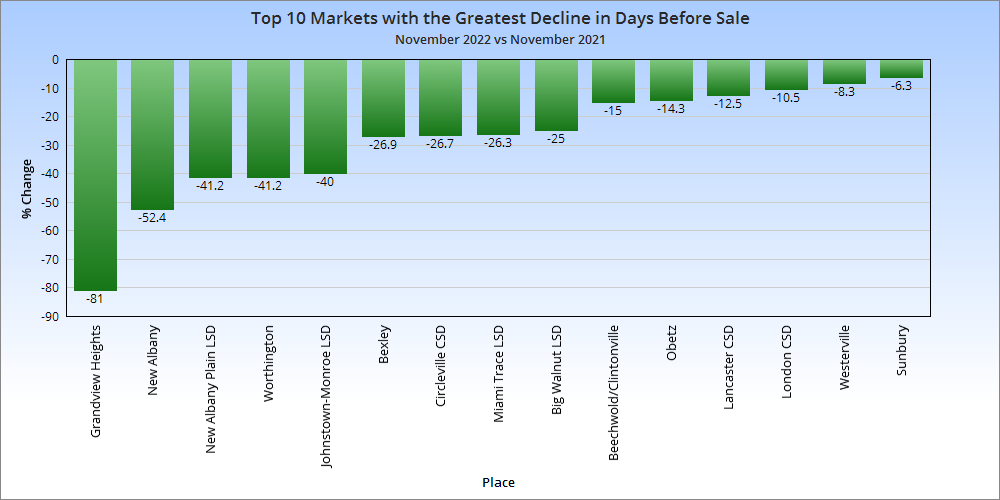
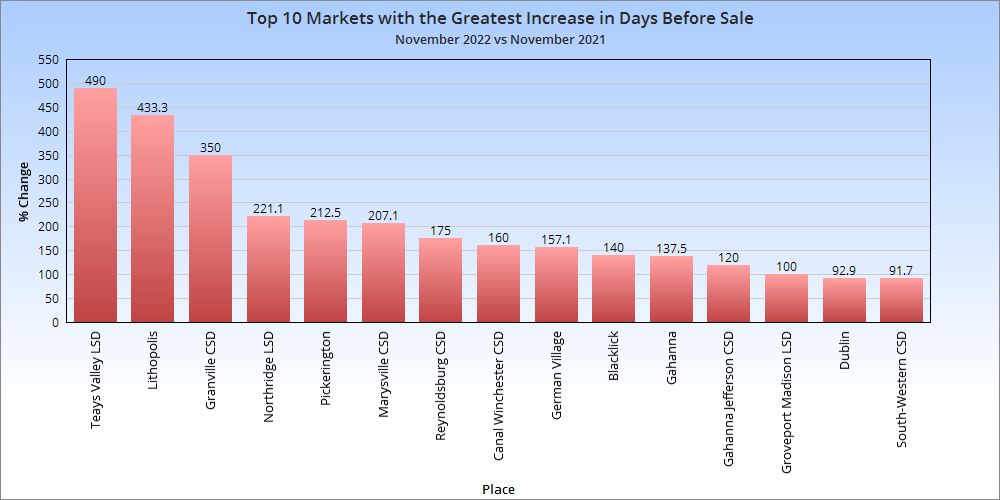
Average # of Days Homes Remain on the Market Before Sale for the Metro Overall in January, 2023: 34.0
# of Days Homes Remain on the Market Before Sale for the Metro January, 2022 to January, 2023: +8.8
Homes continued to sell more slowly than they did a year ago, now more than a week more slowly on average.