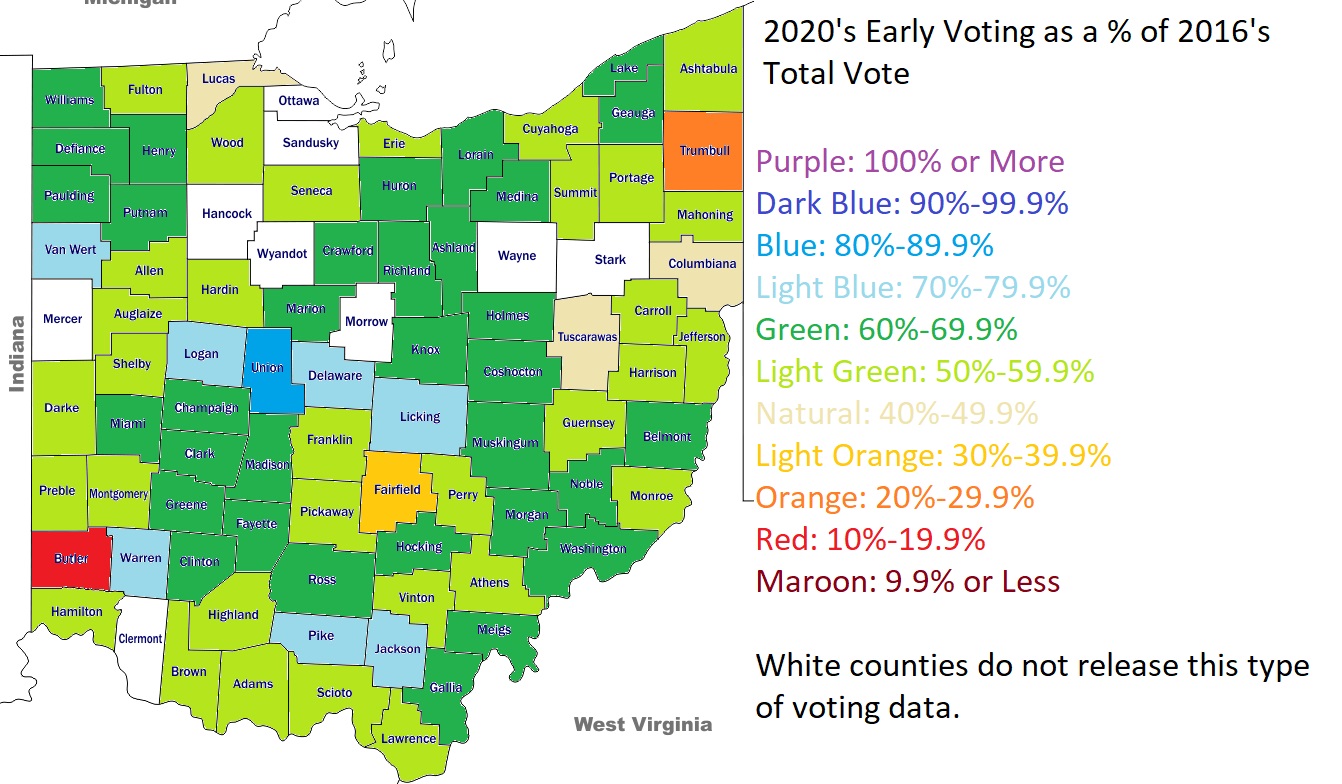
The early voting in Ohio was record-breaking, as it was in many parts of the US. More than 100.5 million people voted early, which includes absentee ballots and in-person voting. In Ohio, 3,411,463 people voted early, far outpacing 2016’s 1,798,277. The 2020 total represents nearly 62% of the ALL votes in 2016, a huge turnout. The state is now expecting full turnout to exceed 75% of registered voters, something that hasn’t happened since 1992’s record 77% turnout. Could this election exceed even that record? It’s certainly possible.
All data provided here is from the Secretary of State.
This post will update daily county voting data, where available, through the election. Numbers in parenthesis are from the previous day, for comparison. There are 8 counties without data, as those county board of elections do not post their statistics online.
**Last Updated: 11/2/2020- 10AM
Total Votes in Ohio Through 11/1: 2,909,171 (2,854,258)
County Average of the Return Rate for 2020 Absentee Ballots: 92.02% (91.09%)
Ohio does not register voters by party, but most counties do release the breakdown of how registered voters voted in previous elections and apply that breakdown to current early voting totals. These numbers are in no way any guarantee of how voters will actually vote in 2020, but they do provide at least some context as to *who* is voting so far. So which party’s past voters are ahead in the counties?
And here is a map of the net change of Democratic and Republican early votes between 2016 and 2020. Again, although we can’t be sure who these people voted for, it does appear that Democrats have made broad gains across most of the state.
With the economic collapse, pandemic and racial strife, Columbus’ minority-owned businesses need and deserve your support more than ever! Today’s link gives a list of Ohio Black-owned businesses.
40 businesses are listed here, but there are far more within the city, and even more in the suburbs and other Ohio cities. Follow the links within the site to check out businesses throughout the region.
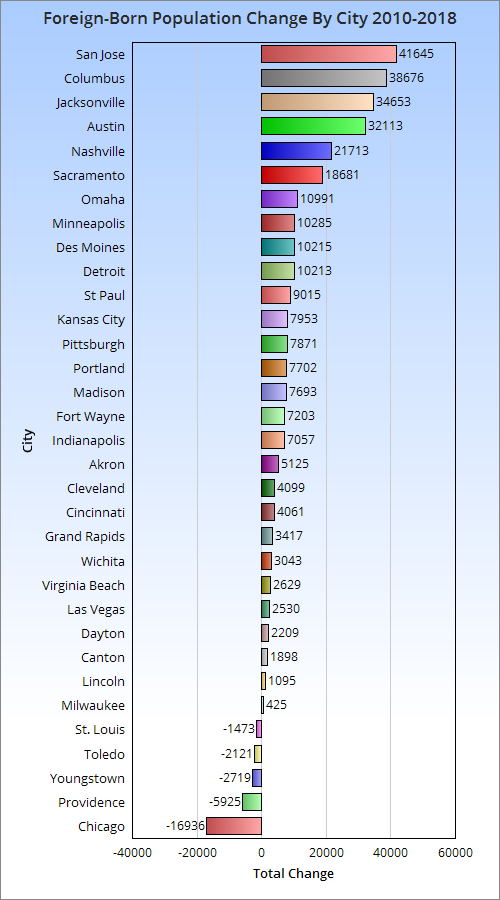
In the ongoing series discussing topics related to the 2018 Census demographic estimates, today I will update the foreign-born comparison. Beyond the simple comparison, I will also talk about the regions and countries that the foreign-born populations come from.
Total Foreign-Born Population Rank by City 2010 and 2018 2010————————————-——-2018 1. Chicago: 557,674—————1. Chicago: 540,738 2. San Jose: 366,194————-2. San Jose: 407,839 3. Austin: 148,431—————-3. Austin: 180,544 4. Las Vegas: 130,503———–4. Las Vegas: 133,033 5. Sacramento: 96,105———-5. Columbus: 125,339 6. Columbus: 86,663————-6. Sacramento: 114,786 7. Portland: 83,026—————7. Jacksonville: 111,798 8. Jacksonville: 77,145——–8. Nashville: 95,040 9. Indianapolis: 74,707——–9. Portland: 90,728 10. Nashville: 73,327———-10. Indianapolis: 81,764 11. Minneapolis: 57,846——11. Minneapolis: 68,131 12. Milwaukee: 57,222——–12. St. Paul: 59,381 13. Providence: 52,920——-13. Milwaukee: 57,647 14. St. Paul: 50,366———–14. Omaha: 50,279 15. Virginia Beach: 40,756—15. Providence ;46,995 16. Omaha: 39,288————16. Detroit: 44,520 17. Wichita: 39,128————17. Kansas City: 43,485 18. Kansas City: 35,532——18. Virginia Beach: 43,385 19. Detroit: 34,307————19. Wichita: 42,171 20. Madison: 24,929———20. Madison: 32,622 21. St. Louis: 23,011———-21. Des Moines: 31,013 22. Lincoln: 22,214———–22. Pittsburgh: 26,569 23. Des Moines: 20,798—–23. Lincoln: 23,309 24. Pittsburgh: 18,698——24. Fort Wayne: 22,489 25. Cleveland: 17,739——-25. Cleveland: 21,838 26. Grand Rapids: 16,615—26. St. Louis: 21,538 27. Cincinnati: 16,531——-27. Cincinnati: 20,592 28. Fort Wayne: 15,286—-28. Grand Rapids: 20,032 29. Toledo: 11,159———–29. Akron: 13,649 30. Akron: 8,524————30. Toledo: 9,038 31. Dayton: 5,102———–31. Dayton: 7,311 32. Youngstown: 3,695—-32. Canton: 3,241 33. Canton: 1,343———–33: Youngstown: 976
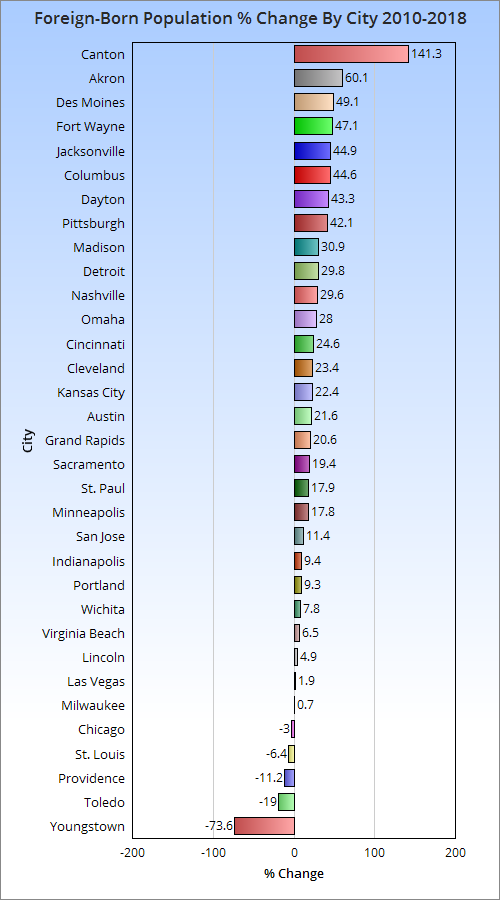
Here’s the 2010-2018 total change. And the 2010-2018 change by %.
Columbus has done very well in both total and % growth of its foreign-born population since 2010.
So now that we know how many foreign-born immigrants are arriving and how fast, let’s take a look at where they are coming from.
Total Foreign-Born Residents From Europe in 2000 and 2018 2000———————————————–2018 1. Chicago: 145,462———————1. Chicago: 91,397 2. San Jose: 21,904———————2. San Jose: 22,043 3. Portland: 17,572———————-3. Jacksonville: 18,808 4. Jacksonville: 10,883————4. Portland: 17,016 5. Las Vegas: 9,070—————-5. Austin: 11,981 6. Cleveland: 8,796—————-6. Las Vegas: 11,472 7. St. Louis: 8,543——————7. Columbus: 8,141 8. Sacramento: 8,204————-8. Nashville: 8,108 9. Milwaukee: 7,841—————9. Virginia Beach: 6,710 10. Austin: 7,474——————10. Sacramento: 6,275 11. Pittsburgh: 7,413————–11. Pittsburgh: 5,047 12. Columbus: 7,017————–12. Minneapolis: 5,031 13. Indianapolis: 6,543———–13. Omaha: 3,845 14. Virginia Beach: 6,333——–14. St. Louis: 4,711 15. Detroit: 5,600—————–15. Indianapolis: 4,199 16. Minneapolis: 5,409———–16. Omaha: 3,845 17. Providence: 5,126————-17. Milwaukee: 3,808 18. Nashville: 4,859—————18. Madison: 3,519 19. Cincinnati: 3,851————–19. Providence: 3,030 20. Grand Rapids: 3,396———20. Lincoln: 2,777 21. Omaha: 3,320—————–21. Cincinnati: 2,738 22. St. Paul: 3,255—————-22. St. Paul: 2,449 23. Des Moines: 3,216———–23. Grand Rapids: 2,336 24. Kansas City: 2,985———-24. Kansas City: 2,320 25. Madison: 2,871—————25. Fort Wayne: 2,235 26. Lincoln: 2,701—————-26. Wichita: 1,851 27. Akron: 2,687—————–27. Detroit: 1,767 28. Fort Wayne: 2076———–28. Akron: 1,580 29. Toledo: 2,020—————-29. Des Moines: 1,042 30. Wichita: 2,004————–30. Toledo: 496 31. Dayton: 901——————31. Canton: 347 32. Youngstown: 870———–32. Dayton: 347 33. Canton: 590—————–33. Youngstown: 337
Columbus had more European immigrants than most in 2000 and 2018, and was one of the relatively few cities that saw an increase by 2018.
Total Foreign-born Population from Asia 2000 and 2018 2000————————————————–2018 1. San Jose: 182,712—————————1. San Jose: 256,504 2. Chicago: 112,932—————————2. Chicago: 144,970 3. Sacramento: 40,253———————3. Austin: 59,711 4. Portland: 26,271—————————4. Sacramento: 56,084 5. Austin: 25,036——————————5. Columbus: 49,185 6. St. Paul: 23,245———————-6. Portland: 42,245 7. Columbus: 22,354——————-7. Jacksonville: 39,543 8. Jacksonville: 17,427—————–8. Las Vegas: 35,959 9. Minneapolis: 17,376—————–9. St. Paul: 34,246 10. Las Vegas: 17,062—————–10. Nashville: 28,142 11. Virginia Beach: 15,176————-11. Indianapolis: 24,992 12. Detroit: 15,114———————-12. Virginia Beach: 21,954 13. Nashville: 12,573——————-13. Milwaukee: 18,192 14. Milwaukee: 12,114——————14. Minneapolis: 17,929 15. Wichita: 10,826——————–15. Detroit: 17,474 16. Madison: 9,736——————–16. Madison: 17,021 17. Indianapolis: 9,190—————-17. Omaha: 14,582 18. Pittsburgh: 7,938—————–18. Wichita: 14,107 19. Providence: 7,871—————–19. Kansas City: 13,753 20. Kansas City: 7,312—————-20. Des Moines: 13,139 21. Lincoln: 6,691———————-21. Pittsburgh: 12,929 22. St. Louis: 6,425——————–22. Lincoln: 11,233 23. Omaha: 6,302 ———————23. Fort Wayne: 10,809 24. Cleveland: 6,213——————-24. Cleveland: 10,351 25. Des Moines: 5,239—————-25. St. Louis: 9,505 26. Cincinnati: 4,326——————26. Akron: 8,391 27. Toledo: 3,847———————-27. Providence: 7,744 28. Grand Rapids: 3,206————–28. Cincinnati: 5,599 29. Akron: 3,099———————–29. Toledo: 3,597 30. Fort Wayne: 2,792—————–30. Grand Rapids: 3,369 31. Dayton: 903————————-31. Dayton: 2,575 32. Youngstown: 338——————32. Canton: 542 33. Canton: 296————————33. Youngstown: 196
Columbus ranks even higher with its foreign-born Asian population.
Total Foreign-born Population from Africa 2000 and 2018 2000—————————————————2018 1. Minneapolis: 12,765——————–1. Columbus: 45,092 2. Chicago: 12,613————————-2. Minneapolis: 26,271 3. Columbus: 9,530———————–3. Chicago: 25,573 4. San Jose: 5,189————————-4. Nashville: 18,423 5. St. Paul: 4,697———————5. Indianapolis: 14,965 6. Nashville: 4,183——————-6. St. Paul: 13,594 7. Detroit:: 3,249———————7. Austin: 9,961 8. Providence: 3,138—————-8. Kansas City: 8,558 9. Indianapolis: 2,650—————9. San Jose: 8,546 10. Portland: 2,430—————–10. Cincinnati: 7,113 11. Austin 2,263———————11. Des Moines: 6,191 12. Kansas City: 2,192————–12. Omaha: 5,474 13. Cincinnati: 1,781—————-13. Grand Rapids: 3,932 14. Jacksonville: 1,719————-14. Portland: 3,899 15. St. Louis: 1,500—————–15. St. Louis: 3,777 16. Omaha: 1,497——————-16. Providence: 3,571 17. Milwaukee: 1,332—————17. Milwaukee: 3,552 18. Cleveland: 1,075—————-18. Jacksonville: 3,426 19. Sacramento: 1,051————-19. Lincoln: 2,942 20. Des Moines: 1,038————-20. Wichita: 2,752 21. Madison: 991——————–21. Madison: 2,599 22. Wichita: 946——————–22. Detroit: 2,081 23. Las Vegas: 916—————–23. Pittsburgh: 1,909 24. Pittsburgh: 905—————-24. Sacramento: 1,784 25. Virginia Beach: 840———–25. Virginia Beach: 1,783 26. Grand Rapids: 718————-26. Fort Wayne: 1,614 27. Toledo: 638——————–27. Dayton: 1,573 28. Lincoln: 637——————–28. Akron: 1,312 29. Dayton: 522——————–29. Las Vegas: 1,206 30. Fort Wayne: 384————–30. Cleveland: 622 31. Akron: 197———————-31. Toledo: 416 32. Canton: 89———————32. Youngstown: 277 33. Youngstown: 50—————33. Canton: 95
Columbus has claimed the number 1 spot in its foreign-born African population, passing previous top city Minneapolis.
And finally, the total foreign-born population from the Americas in 2000 and 2018 2000—————————————————-2018 1. Chicago: 357,235————————–1. Chicago: 277,742 2. San Jose: 117,989————————2. San Jose: 119,455 3. Austin: 73,935———————-3. Austin: 97,933 4. Las Vegas: 63,277——————4. Las Vegas: 83,782 5. Sacramento: 28,927—————5. Jacksonville: 49,339 6. Providence: 27,649—————-6. Sacramento: 42,722 7. Milwaukee: 24,781——————7. Nashville: 39,633 8. Detroit: 21,527———————-8. Indianapolis: 37,287 9. Portland: 20,939——————-9. Providence: 32,650 10. Minneapolis: 19,648————-10. Milwaukee: 31,917 11. Indianapolis: 17,530————–11. Omaha: 26,012 12. Nashville: 17,125——————12. Wichita: 23,429 13. Omaha: 14,467——————–13. Detroit: 23,198 14. Wichita:: 13,988——————14. Columbus: 22,469 15. Grand Rapids: 13,477————15. Portland: 20,407 16. Kansas City: 12,948————–16. Minneapolis: 18,765 17. Jacksonville: 11,881—————17. Kansas City: 18,170 18. St.Paul: 9,804———————18. Virginia Beach: 12,667 19. Columbus: 8,596—————–19. Des Moines: 10,675 20. Des Moines: 6,201—————20. Grand Rapids: 10,395 21. Virginia Beach: 5,754————21. Madison: 9,349 22. Cleveland: 5,192—————–22. St. Paul: 9,070 23. Madison: 5,080——————23. Fort Wayne: 7,831 24. Fort Wayne: 4,930————–24. Lincoln: 6,280 25. Lincoln: 3,106——————–25. Pittsburgh: 5,898 26. St. Louis: 2,961——————-26. Cleveland: 5,810 27. Toledo: 2,942———————27. Cincinnati: 4,901 28. Pittsburgh: 2,463—————-28. Toledo: 4,347 29. Cincinnati: 2,432—————–29. St. Louis: 3,545 30. Dayton: 919———————-30. Dayton: 2,816 31. Akron: 891————————31. Akron: 2,366 32. Canton: 347———————-32. Canton: 2,257 33. Youngstown: 333—————33. Youngstown: 166
Columbus does the worst with this group, but even here it moved up 5 spots in the rankings.
The rest of the foreign-born population is made up of small groups of people from Oceania- or basically island nations.
Today, I am going to examine 2017 metro population estimates from the US Census, not only for Ohio, but also Columbus’ peer group that includes Midwest and national metro areas. Midwest peers (outside Ohio) used would be any metro with a population greater than 500,000. National peers would be metros that either started or ended the period 2010-2017 with a population between 1.5-2.5 Million.
As with counties, I am going to start this look with a comparison of overall population.
Total Metro Area Population Census 2010, July 1, 2016 and July 1, 2017 Census 2010——————————-July 1, 2016————————July 1, 2017 1. Chicago, IL: 9,461,104————-1. Chicago: 9,546,326———–1. Chicago: 9,533,040 2. Detroit, MI: 4,296,250—————2. Detroit: 4,305,869————-2. Detroit: 9,313,002 3. Minneapolis, MN: 3,348,8459—3. Minneapolis: 3,557,276–3. Minneapolis: 3,600,618 4. St. Louis, MO: 2,787,701———4. St. Louis: 2,806,782———4. St. Louis: 2,807,338 5. Pittsburgh, PA: 2,356,285——–5. Charlotte: 2,475,519———5. Charlotte: 2,525,305 6. Portland, OR: 2,226,009———-6. Orlando: 2,453,333———-6. Orlando: 2,509,831 7. Charlotte: 2,217,012———–7. San Antonio: 2,426,211—–7. San Antonio: 2,473,974 8. Sacramento, CA: 2,149,127—–8. Portland: 2,423,102——–8. Portland: 2,453,168 9. San Antonio, TX: 2,142,516—–9. Pittsburgh: 2,341,536——9. Pittsburgh: 2,333,367 10. Orlando, FL: 2,134,411—–10. Sacramento: 2,295,233—10. Sacramento: 2,324,884 11. Cincinnati: 2,114,580———-11. Cincinnati: 2,166,029—–11. Las Vegas: 2,204,079 12. Cleveland: 2,077,240————12. Las Vegas: 2,156,724—-12. Cincinnati: 2,179,082 13. Kansas City, MO: 2,009,342-13. Kansas City: 2,106,382-13. Kansas City: 2,128,912 14. Las Vegas, NV: 1,951,269——–14. Austin: 2,060,558——–14. Austin: 2,115,827 15. Columbus: 1,901,974———-15. Cleveland: 2,060,065——15. Columbus: 2,078,725 16. Indianapolis, IN: 1,887,877——16. Columbus: 2,046,977—16. Cleveland: 2,058,844 17. San Jose, CA: 1,836,911—17. Indianapolis: 2,005,612—17. Indianapolis: 2,028,614 18. Austin, TX: 1,716,289————18. San Jose: 1,990,910—-18. San Jose: 1,998,463 19. Virginia Beach, VA: 1,676,822—19. Nashville: 1,868,855—-19. Nashville: 1,903,045 20. Nashville: 1,670,890—20. Virginia Beach: 1,722,766–20. Virginia Beach: 1,725,246 21. Providence, RI: 1,600,852—-21. Providence: 1,615,878—21. Providence: 1,621,122 22. Milwaukee, WI: 1,555,908—–22. Milwaukee: 1,576,143—22. Milwaukee: 1,576,236 23. Jacksonville, FL: 1,345,596-23. Jacksonville: 1,476,503–23. Jacksonville: 1,504,980 24. Grand Rapids: 988,938–24. Grand Rapids: 1,048,826-24. Grand Rapids: 1,059,113 25. Omaha, NE: 865,350————–25. Omaha: 924,003—-25. Omaha: 933,316 26. Dayton: 799,232——————–26. Dayton: 800,886—–26. Dayton: 803,416 27. Akron: 703,200———————27. Akron: 702,556——–27. Akron: 703,505 28. Wichita, KS: 630,919————-28. Madison: 647,432—28. Madison: 654,230 29. Toledo: 610,001——————29. Wichita: 644,680——29. Des Moines: 645,911 30. Madison, WI: 605,435———–30. Des Moines: 634,740—-30. Wichita: 645,628 31. Des Moines, IA: 569,633——-31. Toledo: 604,591——31. Toledo: 603,668 32. Youngstown: 565,773——32. Youngstown: 544,543—32. Youngstown: 541,926 33. Canton: 404,422——————33. Canton: 401,165—-33. Canton: 399,927
Columbus passed up Cleveland to become Ohio’s 2nd largest metro.
Metro Area Total Growth Census 2010-July 1, 2017 and July 1, 2016-July 1, 2017 Census 2010-July 1, 2017—————————–July 1, 2016-July 1, 2017 1. Austin, TX: +399,507———————————–1. Orlando: +56,498 2. Orlando, FL: +375,432———————————2. Austin: +55,269 3. San Antonio, TX: +331,458—————————3. Charlotte: +49,786 4. Charlotte, NC: +308,313——————————-4. San Antonio: +47,763 5. Las Vegas, NV: +252,810—————————–5. Las Vegas: +47,355 6. Minneapolis, MN: +251,760————————–6. Minneapolis: +43,342 7. Nashville, TN: +232,162——————————-7. Nashville: +34,190 8. Portland, OR: +227,167——————————-8. Columbus: +31,748 9. Columbus: +176,724———————————–9. Portland: +30,066 10. Sacramento, CA: +175,740————————10. Sacramento: +29,651 11. San Jose, CA: +161,523—————————-11. Jacksonville: +28,477 12. Jacksonville, FL: +159,382————————-12. Indianapolis: +23,002 13. Indianapolis, IN: +140,524————————-13. Kansas City: +22,530 14. Kansas City, MO: +119,574————————14. Cincinnati: +13,053 15. Des Moines, IA: +76,278—————————15. Des Moines: +11,171 16. Chicago, IL: +71,499——————————–16. Grand Rapids: +10,287 17. Grand Rapids, MI: +70,173————————17. Omaha: +9,313 18. Omaha, NE: +67,960——————————–18. San Jose: +7,533 19. Cincinnati: +64,396———————————–19. Detroit: +7,133 20. Madison, WI: +48,802——————————-20. Madison: +6,798 21. Virginia Beach, VA: +48,429———————-21. Providence: +5,244 22. Milwaukee, WI: +20,282—————————22. Dayton: +2,530 23. Providence, RI: +19,912————————–23. Virginia Beach: +2,480 24. St. Louis, MO: +19,575—————————24. Akron: +949 25. Detroit, MI: +16,685——————————-25. Wichita: +948 26. Wichita, KS: +14,704——————————26. St. Louis: +556 27. Dayton: +4,165————————————-27. Milwaukee: +93 28. Akron: +302—————————————–28. Toledo: -923 29. Canton: -4,501————————————-29. Cleveland: -1,221 30. Toledo: -6,334————————————-30. Canton: -1,238 31. Cleveland: -18,427——————————-31. Youngstown: -2,617 32. Pittsburgh, PA: -22,924————————-32. Pittsburgh: -8,169 33. Youngstown: -23,873—————————-33. Chicago: -13,286
Now, as done with counties, let’s look at the components of population change for metro areas.
Total Births By Metro Census 2010-July 1, 2017 and July 1, 2016-July 1, 2017 Census 2010-July 1, 2017———————————July 1, 2016-July 1, 2017 1. Chicago: +869,178—————————————-1. Chicago: +115,915 2. Detroit: +364,121———————————————-2. Detroit: +49,940 3. Minneapolis: +331,430————————————–3. Minneapolis: +45,810 4. St. Louis: +246,280——————————————4. San Antonio: +34,318 5. San Antonio: +236,348————————————–5. St. Louis: +33,143 6. Charlotte: +217,525——————————————6. Charlotte: +31,315 7. Portland: +201,872——————————————-7. Orlando: +29,173 8. Orlando: +200,843——————————————-8. Portland: +28,220 9. Kansas City: +200,535————————————–9. Columbus: +27,663 10. Sacramento: +198,466————————————10. Kansas City: +27,565 11. Columbus: +197,185—————————————11. Las Vegas: +27,449 12. Cincinnati: +196,146—————————————12. Austin: +27,400 13. Las Vegas: +194,083————————————–13. Sacramento: +27,148 14. Indianapolis: +193,599————————————14. Cincinnati: +26,855 15. Austin: +188,961——————————————–15. Indianapolis: +26,769 16. San Jose: +176,224—————————————-16. Nashville: +24,690 17. Pittsburgh: +173,472—————————————17. San Jose: +23,826 18. Nashville: +170,824—————————————–18. Pittsburgh: +23,614 19. Cleveland: +168,361—————————————19. Cleveland: +22,873 20. Virginia Beach: +163,787———————————20. Milwaukee: +19,474 21. Milwaukee: +144,429————————————–21. Jacksonville: +18,748 22. Jacksonville: +130,339————————————22. Providence: +16,542 23. Providence: +120,526————————————-23. Grand Rapids: +13,548 24. Grand Rapids: +98,214———————————–24. Omaha: +13,421 25. Omaha: +96,558——————————————-25. Dayton: +9,615 26. Dayton: +69,855——————————————-26. Des Moines: +9,172 27. Wichita: +65,873——————————————27. Wichita: +8,694 28. Des Moines: +63,958————————————28. Madison: +7,400 29. Akron: +54,644——————————————–29. Toledo: +7,345 30. Toledo: +54,309——————————————-30. Akron: +7,342 31. Madison: +53,718—————————————-31. Virginia Beach: +5,935 32. Youngstown: +40,696———————————–32. Youngstown: +5,551 33. Canton: +32,199——————————————33. Canton: +4,434
Total Deaths By Metro Census 2010-July 1, 2017 and July 1, 2016-July 1, 2017 Census 2010-July 1, 2017———————————July 1, 2016-July 1, 2017 1. Chicago: -501,469—————————————1. Chicago: -72,491 2. Detroit: -293,091—————————————–2. Detroit: -41,075 3. Pittsburgh: -197,572————————————3. Pittsburgh: -27,439 4. St. Louis: -186,111————————————–4. St. Louis: -26,755 5. Minneapolis: -161,913———————————5. Minneapolis: -23,527 6. Cleveland: -153,138———————————–6. Cleveland: -21,068 7. Cincinnati: -135,975———————————–7. Cincinnati: -19,515 8. Charlotte: -127,523————————————-8. Charlotte: -19,009 9. Portland: -120,590————————————–9. Orlando: -18,268 10. Sacramento: -120,429——————————10. Sacramento: -18,081 11. Kansas City: -119,748——————————11. Portland: -17,875 12. Orlando: -117,771———————————–12. San Antonio: -17,679 13. San Antonio: -117,289——————————13. Kansas City: -17,106 14. Indianapolis: -113,742——————————14. Las Vegas: -16,867 15. Columbus: -108,704——————————–15. Indianapolis: -16,081 16. Las Vegas: -108,003——————————–16. Columbus: -15,833 17. Providence: -107,920——————————-17. Providence: -15,031 18. Nashville: -99,415———————————–18. Nashville: -14,723 19. Virginia Beach: -97,935—————————-19. Milwaukee: -13,399 20. Milwaukee: -95,601———————————20. Jacksonville: -13,288 21. Jacksonville: -86,920——————————-21. San Jose: -11,360 22. San Jose: -73,507———————————–22. Austin: -10,609 23. Austin: -67,704—————————————23. Dayton: -8,359 24. Dayton: -59,736————————————-24. Grand Rapids: -7,674 25. Grand Rapids: -53,725—————————-25. Akron: -7,138 26. Akron: -50,948—————————————26. Youngstown: -6,821 27. Youngstown: -50,302——————————27. Omaha: -6,667 28. Omaha: -47,763————————————-28. Toledo: -5,968 29. Toledo: -42,313————————————-29. Wichita: -5,686 30. Wichita: -40,647————————————30. Des Moines: -4,631 31. Canton: -31,722————————————31. Canton: -4,366 32. Des Moines: -31,563——————————32. Madison: -4,252 33. Madison: -30,385———————————-33. Virginia Beach: -3,280
Total Net Natural Change (Births vs. Deaths) By Metro Census 2010-July 1, 2017 and July 1, 2016-July 1, 2017 Census 2010-July 1, 2017———————————July 1, 2016-July 1, 2017 1. Chicago: +367,709—————————————1. Chicago: +43,424 2. Minneapolis: +169,517———————————–2. Minneapolis: +22,283 3. Austin: +121,257——————————————3. Austin: +16,791 4. San Antonio: +119,059———————————-4. San Antonio: +16,639 5. San Jose: +102,717————————————–5. San Jose: +12,466 6. Charlotte: +90,002—————————————-6. Charlotte: +12,306 7. Columbus: +88,481————————————–7. Columbus: +11,830 8. Las Vegas: +86,080————————————-8. Orlando: +10,905 9. Orlando: +83,072—————————————-9. Indianapolis: +10,688 10. Portland: +81,282————————————-10. Las Vegas: +10,582 11. Kansas City: +80,787———————————11. Kansas City: +10,459 12. Indianapolis: +79,857——————————–12. Portland: +10,345 13. Sacramento: +78,037——————————–13. Nashville: +9,967 14. Nashville: +71,409————————————14. Sacramento: +9,067 15. Detroit: +71,030—————————————15. Detroit: +8,865 16. Virginia Beach: +65,852—————————–16. Virginia Beach: +7,762 17. Cincinnati: +60,171———————————–17. Cincinnati: +7,340 18. St. Louis: +60,169————————————-18. Omaha: +6,754 19. Milwaukee: +48,828———————————-19. St. Louis: +6,388 20. Omaha: +48,795————————————–20. Grand Rapids: +5,874 21. Grand Rapids: +44,489—————————–21. Jacksonville: +5,460 22. Jacksonville: +43,419——————————-22. Des Moines: +4,541 23. Des Moines: +32,395——————————-23. Madison: +3,148 24. Wichita: +25,226————————————-24. Milwaukee: +6,075 25. Madison: +23,333———————————–25. Wichita: +3,008 26. Cleveland: +15,223——————————–26. Cleveland: +1,805 27. Providence: +12,606——————————27. Providence: +1,511 28. Toledo: +11,996———————————–28. Toledo: +1,377 29. Dayton: +10,119———————————-29. Dayton: +1,256 30. Akron: +3,696————————————–30. Akron: +204 31. Canton: +477—————————————31. Canton: +68 32. Youngstown: -9,606——————————-32. Youngstown: -1,270 33. Pittsburgh: -24,100——————————–33. Pittsburgh: -3,825
Total Domestic Migration By Metro Census 2010-July 1, 2017 and July 1, 2016-July 1, 2017 Census 2010-July 1, 2017———————————July 1, 2016-July 1, 2017 1. Austin: +224,351—————————————–1. Charlotte: +31,102 2. Charlotte: +177,484————————————-2. Austin: +30,120 3. San Antonio: +169,684——————————–3. Las Vegas: +29,414 4. Orlando: +155,498————————————–4. San Antonio: +24,891 5. Nashville: +126,142————————————-5. Orlando: +23,321 6. Las Vegas: +119,742———————————-6. Jacksonville: +18,921 7. Portland: +106,839————————————-7. Nashville: +18,708 8. Jacksonville: +87,040———————————8. Portland: +13,384 9. Sacramento: +49,262———————————9. Sacramento: +12,888 10. Columbus: +42,932———————————10. Columbus: +12,562 11. Des Moines: +32,042——————————-11. Kansas City: +8,531 12. Indianapolis: +30,772——————————-12. Minneapolis: +8,095 13. Kansas City: +16,802——————————-13. Indianapolis: +7,763 14. Madison: +13,224————————————14. Des Moines: +4,812 15. Grand Rapids: +12,355—————————-15. Grand Rapids: +2,217 16. Omaha: +5,265—————————————16. Madison: +1,706 17. Minneapolis: +432———————————–17. Cincinnati: +1,541 18. Canton: -5,797—————————————-18. Omaha: +383 19. Akron: -13,427—————————————-19. Dayton: -346 20. Youngstown: -16,228——————————-20. Akron: -877 21. Dayton: -16,864————————————–21. Canton: -1,469 22. Wichita: -18,452————————————–22. Youngstown: -1,711 23. Cincinnati: -21,259———————————-23. Providence: -2,588 24. Toledo: -23,102————————————–24. Toledo: -3,070 25. Pittsburgh: -24,397———————————25. Wichita: -3,235 26. Providence: -33,335——————————-26. Virginia Beach: -4,706 27. Milwaukee: -50,575——————————–27. Cleveland: -8,008 28. Virginia Beach: -51,916—————————28. Pittsburgh: -8,633 29. Cleveland: -64,353——————————–29. Milwaukee: -9,635 30. St. Louis: -67,560———————————30. St. Louis: -8,828 31. San Jose: -73,026——————————–31. Detroit: -14,863 32. Detroit: -141,006———————————-32. San Jose: -25,729 33. Chicago: -479,482——————————–33. Chicago: -85,177
Total International Migration By Metro Census 2010-July 1, 2017 and July 1, 2016-July 1, 2017 Census 2010-July 1, 2017———————————July 1, 2016-July 1, 2017 1. Chicago: +183,162—————————————1. Chicago: +28,302 2. Orlando: +135,860—————————————2. Orlando: +22,207 3. San Jose: +132,938————————————-3. San Jose: +20,747 4. Detroit: +86,366——————————————4. Detroit: +13,214 5. Minneapolis: +83,552———————————-5. Minneapolis: +13,107 6. Sacramento: +49,560———————————-6. Austin: +8,185 7. Austin: +49,311——————————————7. Sacramento: +7,722 8. Las Vegas: +46,411————————————8. Columbus: +7,350 9. Columbus: +45,744————————————9. Las Vegas: +7,221 10. Providence: +41,325——————————–10. Providence: +6,381 11. San Antonio: +40,953——————————-11. Portland: +6,335 12. Charlotte: +39,380———————————–12. Charlotte: +6,279 13. Portland: +38,542————————————13. San Antonio: +6,173 14. Virginia Beach: +34,619—————————-14. Nashville: +5,510 15. Nashville: +33,169———————————–15. Cleveland: +5,045 16. Cleveland: +31,236———————————-16. Indianapolis: +4,603 17. Indianapolis: +30,329——————————-17. Pittsburgh: +4,359 18. Jacksonville: +28,593——————————-18. Cincinnati: +4,285 19. St. Louis: +27,666————————————19. Jacksonville: +4,043 20. Pittsburgh: +27,300———————————20. St. Louis: +4,032 21. Cincinnati: +26,502———————————21. Milwaukee: +3,689 22. Kansas City: +23,098——————————22. Kansas City: +3,572 23. Milwaukee: +22,616——————————–23. Grand Rapids: +2,233 24. Omaha: +14,383————————————24. Omaha: +2,213 25. Grand Rapids: +13,800—————————25. Madison: +1,949 26. Madison: +12,367———————————-26. Des Moines: +1,807 27. Des Moines: +11,592—————————–27. Dayton: +1,654 28. Dayton: +11,230———————————–28. Akron: +1,647 29. Akron: +10,413————————————-29. Wichita: +1,187 30. Wichita: +8,117————————————-30. Virginia Beach: +1,077 31. Toledo: +4,627————————————-31. Toledo: +769 32. Youngstown: +2,171——————————32. Youngstown: +381 33. Canton: +1,118————————————33. Canton: +174
Total Net Migration By Metro Census 2010-July 1, 2017 and July 1, 2016-July 1, 2017 Census 2010-July 1, 2017———————————July 1, 2016-July 1, 2017 1. Orlando: +291,358————————————–1. Orlando: +45,528 2. Austin: +273,662—————————————-2. Austin: +38,305 3. Charlotte: +216,864————————————3. Charlotte: +37,381 4. San Antonio: +210,637——————————–4. Las Vegas: +36,635 5. Las Vegas: +166,153———————————-5. San Antonio: +31,064 6. Nashville: +159,311————————————6. Nashville: +24,218 7. Portland: +145,381————————————7. Jacksonville: +22,964 8. Jacksonville: +115,633——————————-8. Minneapolis: +21,202 9. Sacramento: +98,822——————————–9. Sacramento: +20,610 10. Columbus: +88,676——————————–10. Columbus: +19,912 11. Minneapolis: +83,984——————————11. Portland: +19,719 12. Indianapolis: +61,101——————————12. Indianapolis: +12,366 13. San Jose: +59,912———————————-13. Kansas City: +12,103 14. Des Moines: +43,634——————————14. Des Moines: +6,619 15. Kansas City: +39,900——————————15. Cincinnati: +5,826 16. Grand Rapids: +26,155—————————16. Grand Rapids: +4,450 17. Madison: +25,591———————————-17. Providence: +3,793 18. Omaha: +19,648————————————18. Madison: +3,655 19. Providence: +7,990———————————19. Omaha: +2,596 20. Cincinnati: +5,243———————————-20. Dayton: +1,308 21. Pittsburgh: +2,903———————————-21. Akron: +770 22. Akron: -3,014—————————————-22. Canton: -1,295 23. Canton: -4,679————————————–23. Youngstown: -1,330 24. Dayton: -5,634————————————–24. Detroit: -1,649 25. Wichita: -10,335————————————25. Wichita: -2,048 26. Youngstown: -14,057—————————–26. Toledo: -2,301 27. Virginia Beach: -17,297————————–27. Cleveland: -2,963 28. Toledo: -18,475————————————28. Virginia Beach: -3,629 29. Milwaukee: -27,959——————————29. Pittsburgh: -4,274 30. Cleveland: -33,117——————————-30. San Jose: -4,982 31. St. Louis: -39,894———————————31. St. Louis: -5,796 32. Detroit: -54,640————————————32. Milwaukee: -5,946 33. Chicago: -296,320——————————-33. Chicago: -56,875